Download as PDF, PPTX

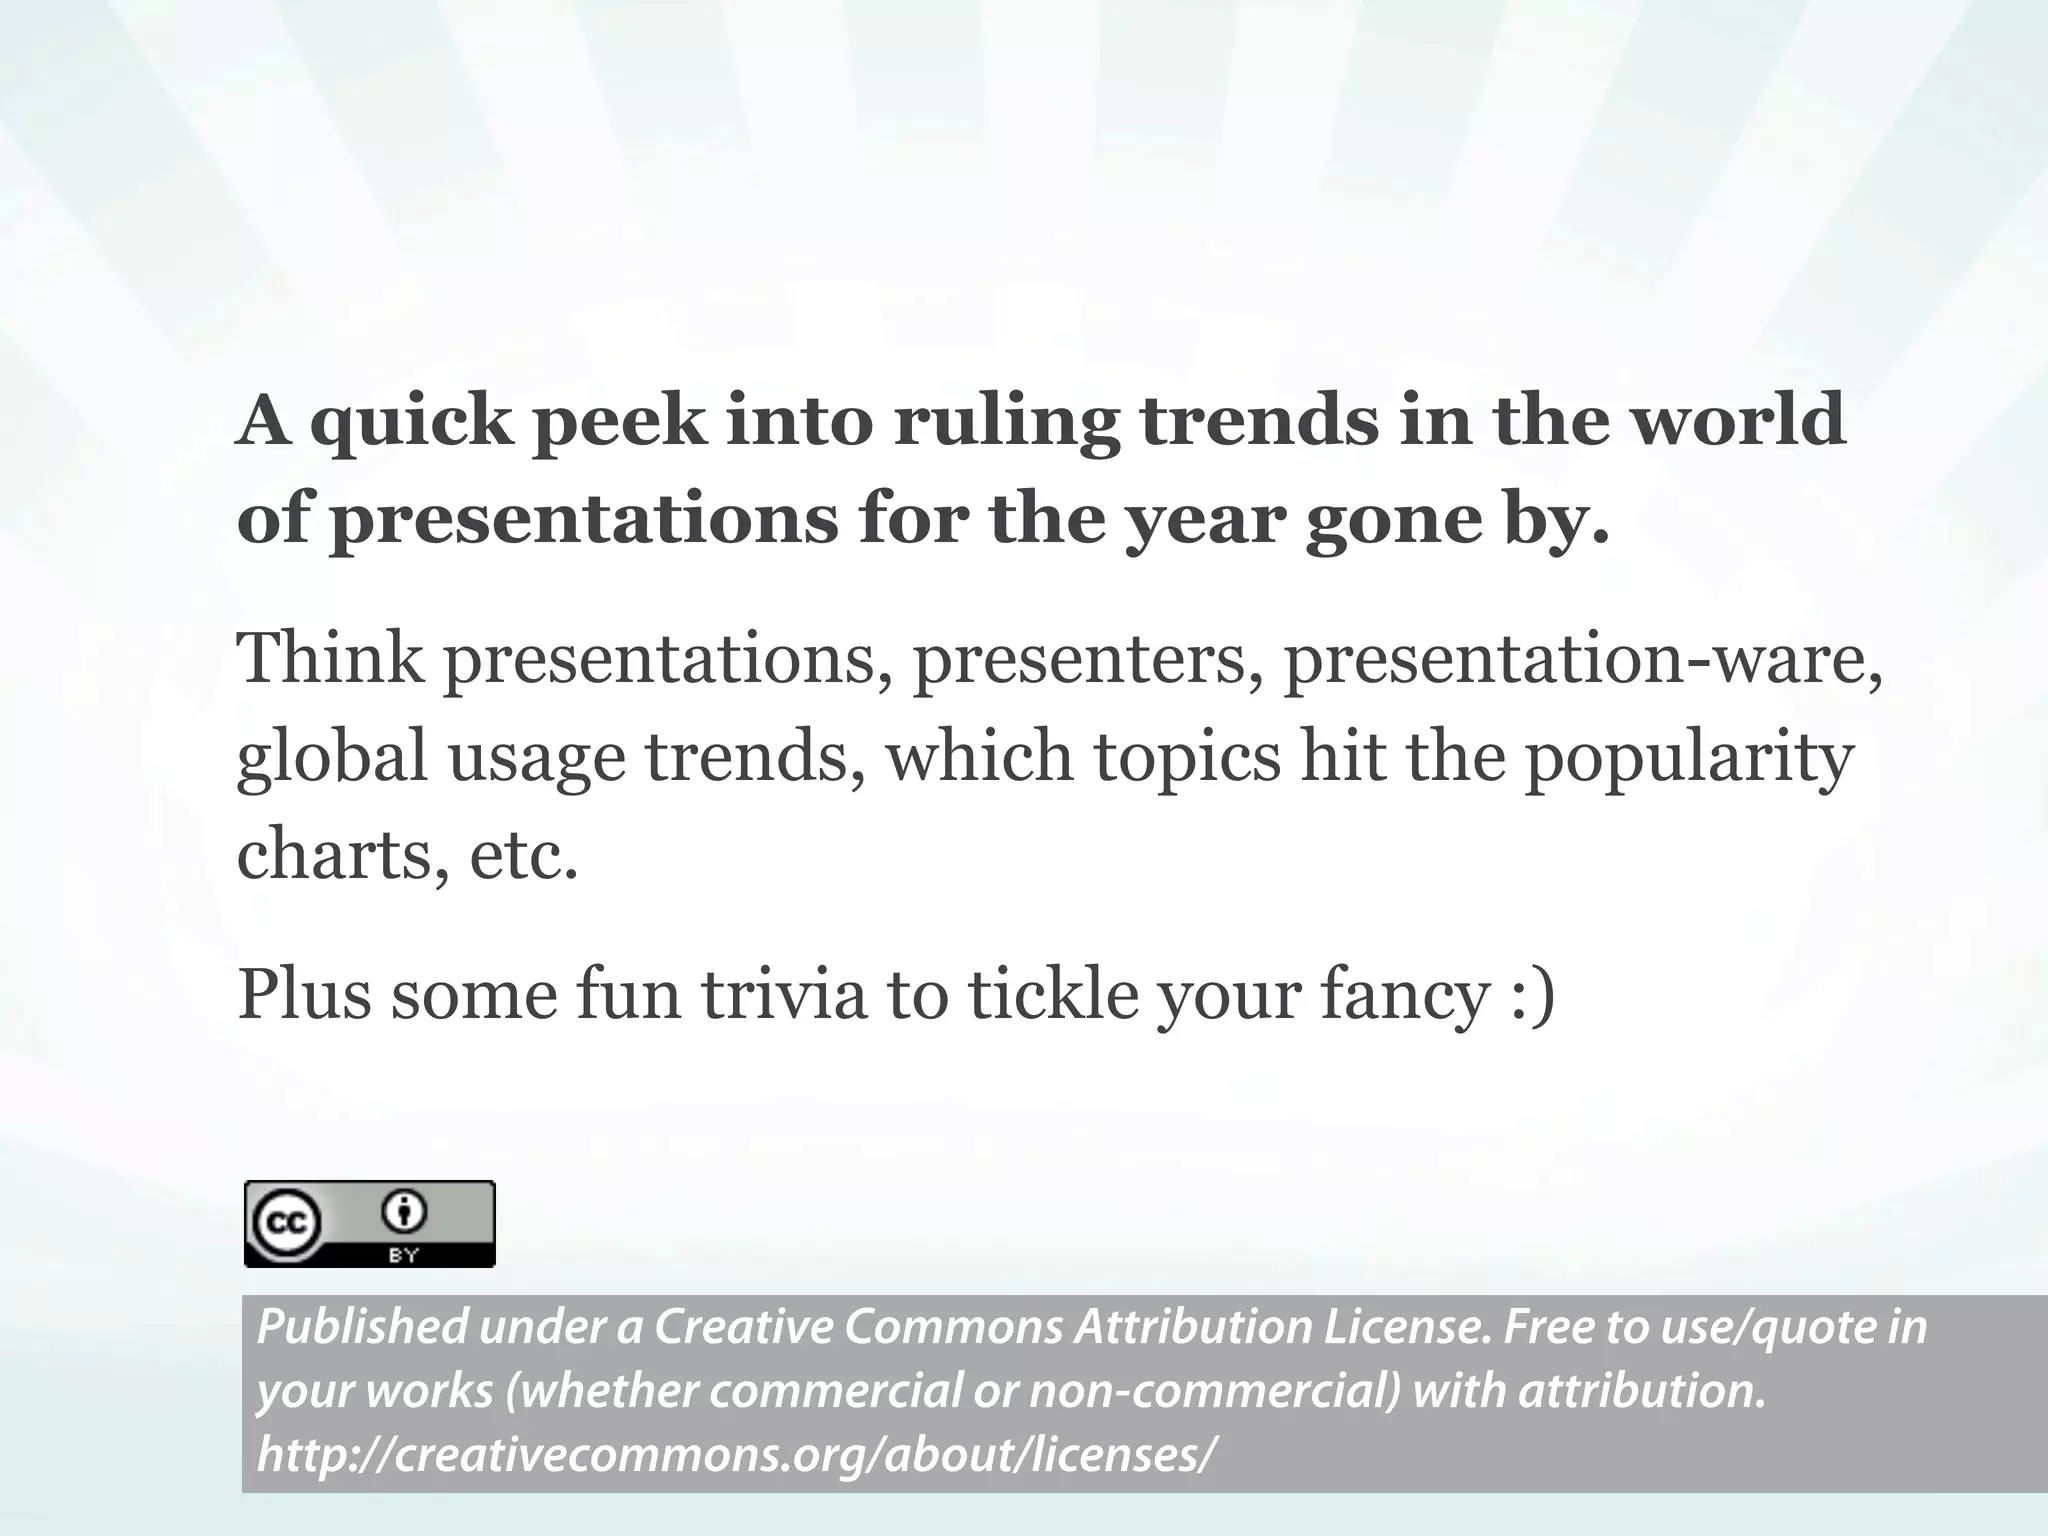
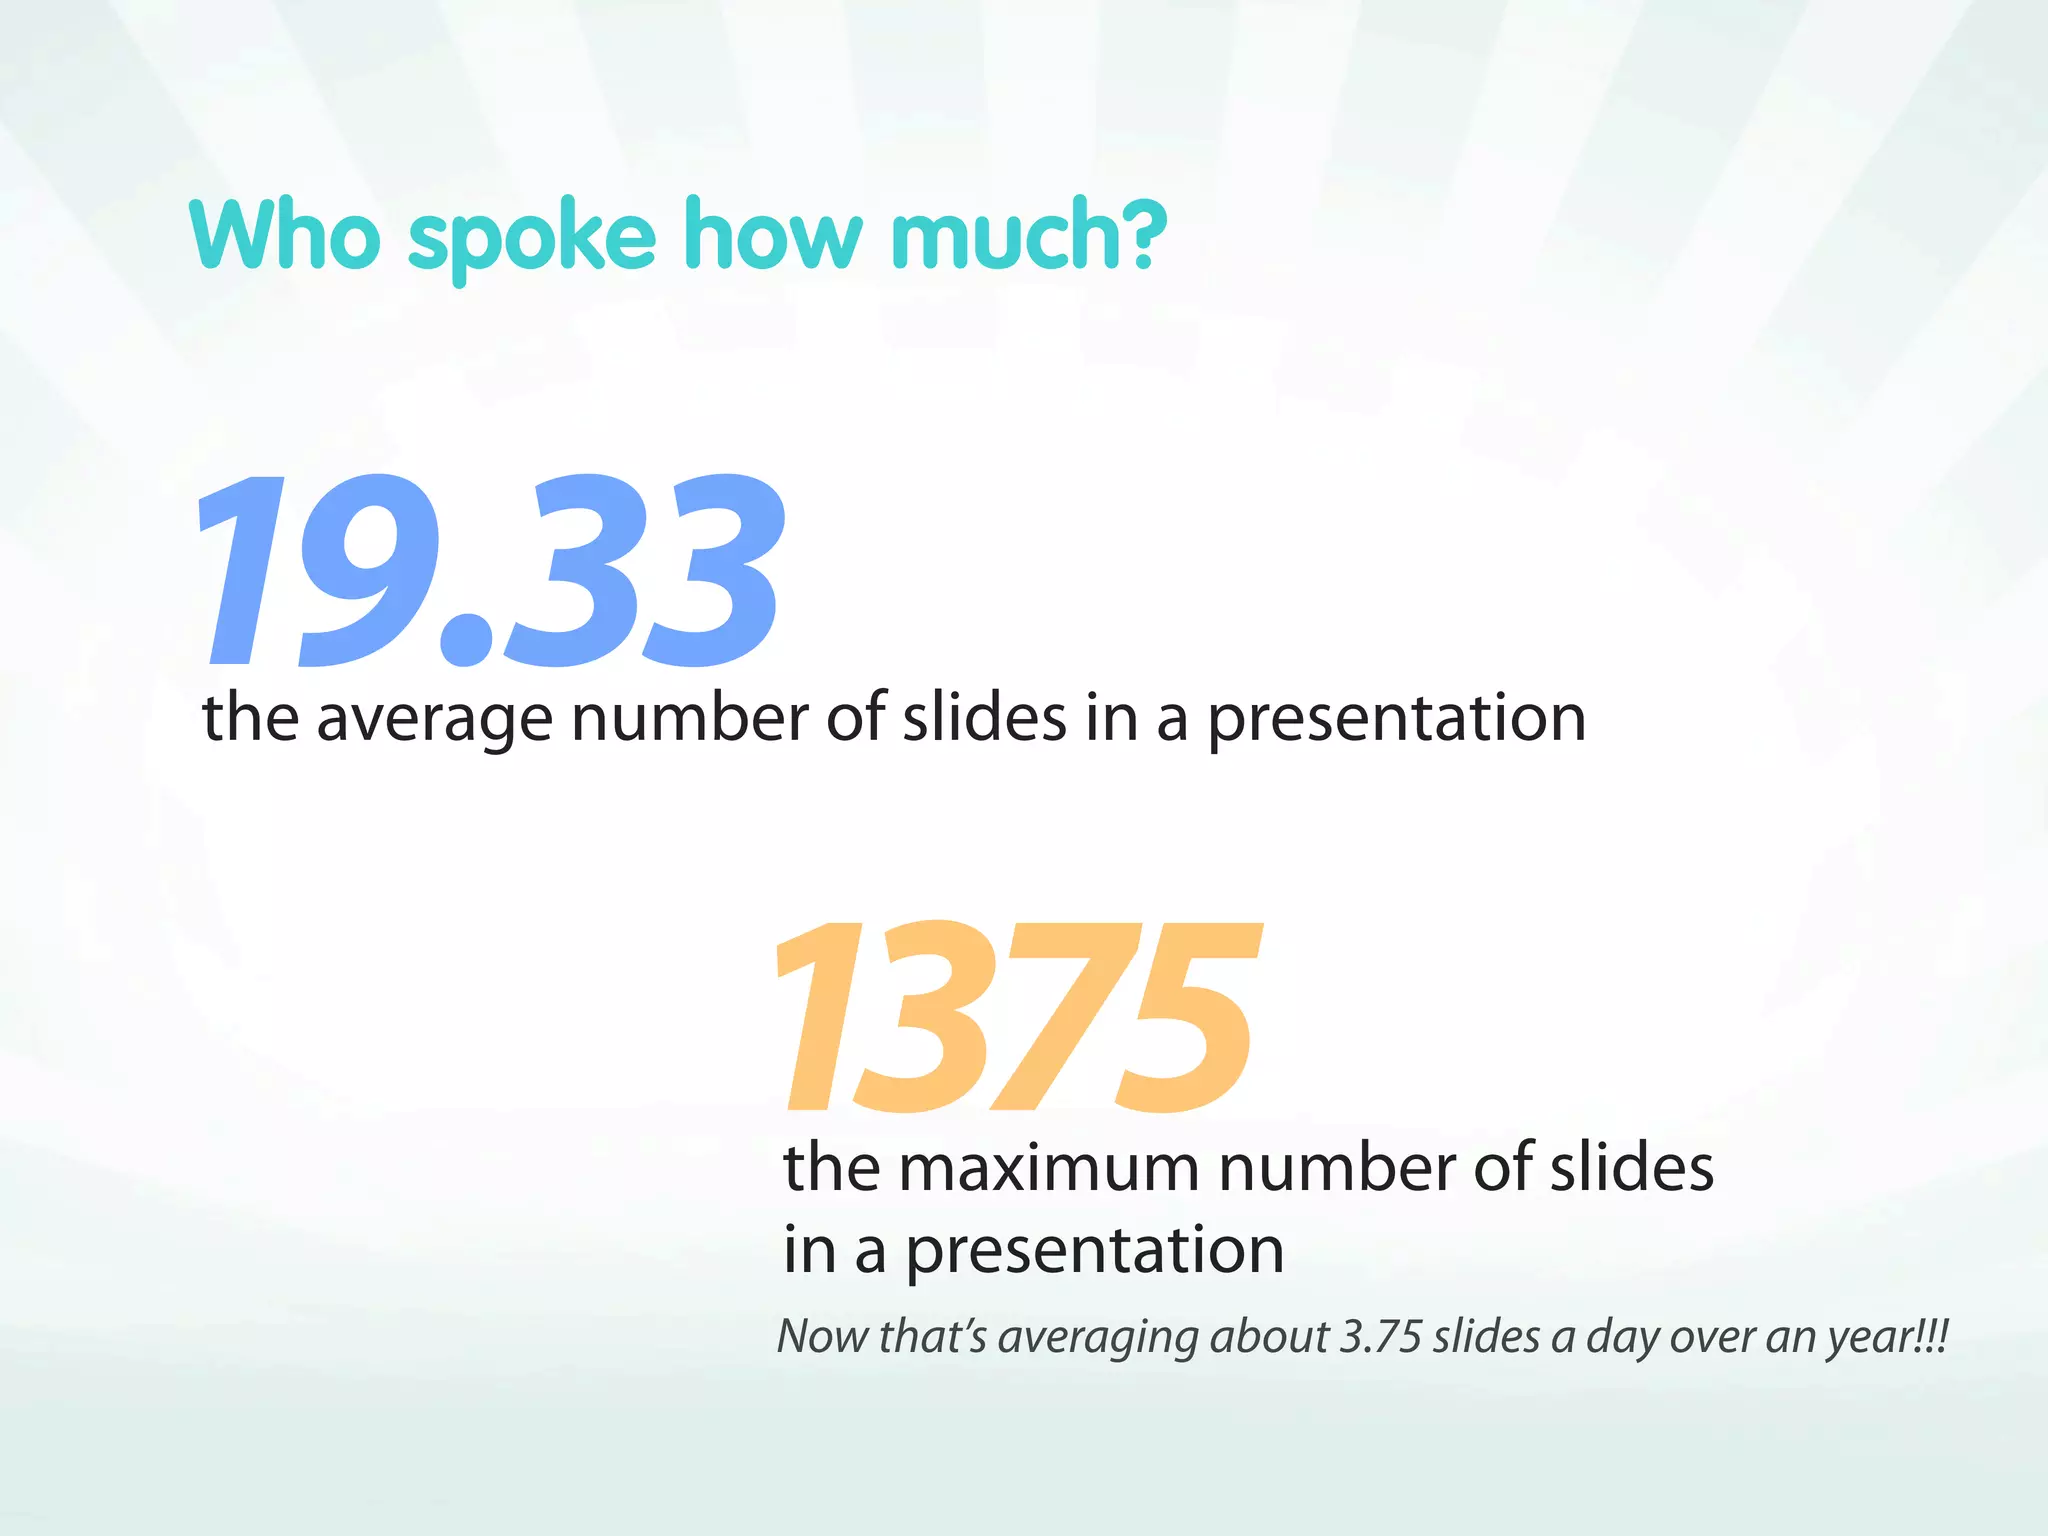
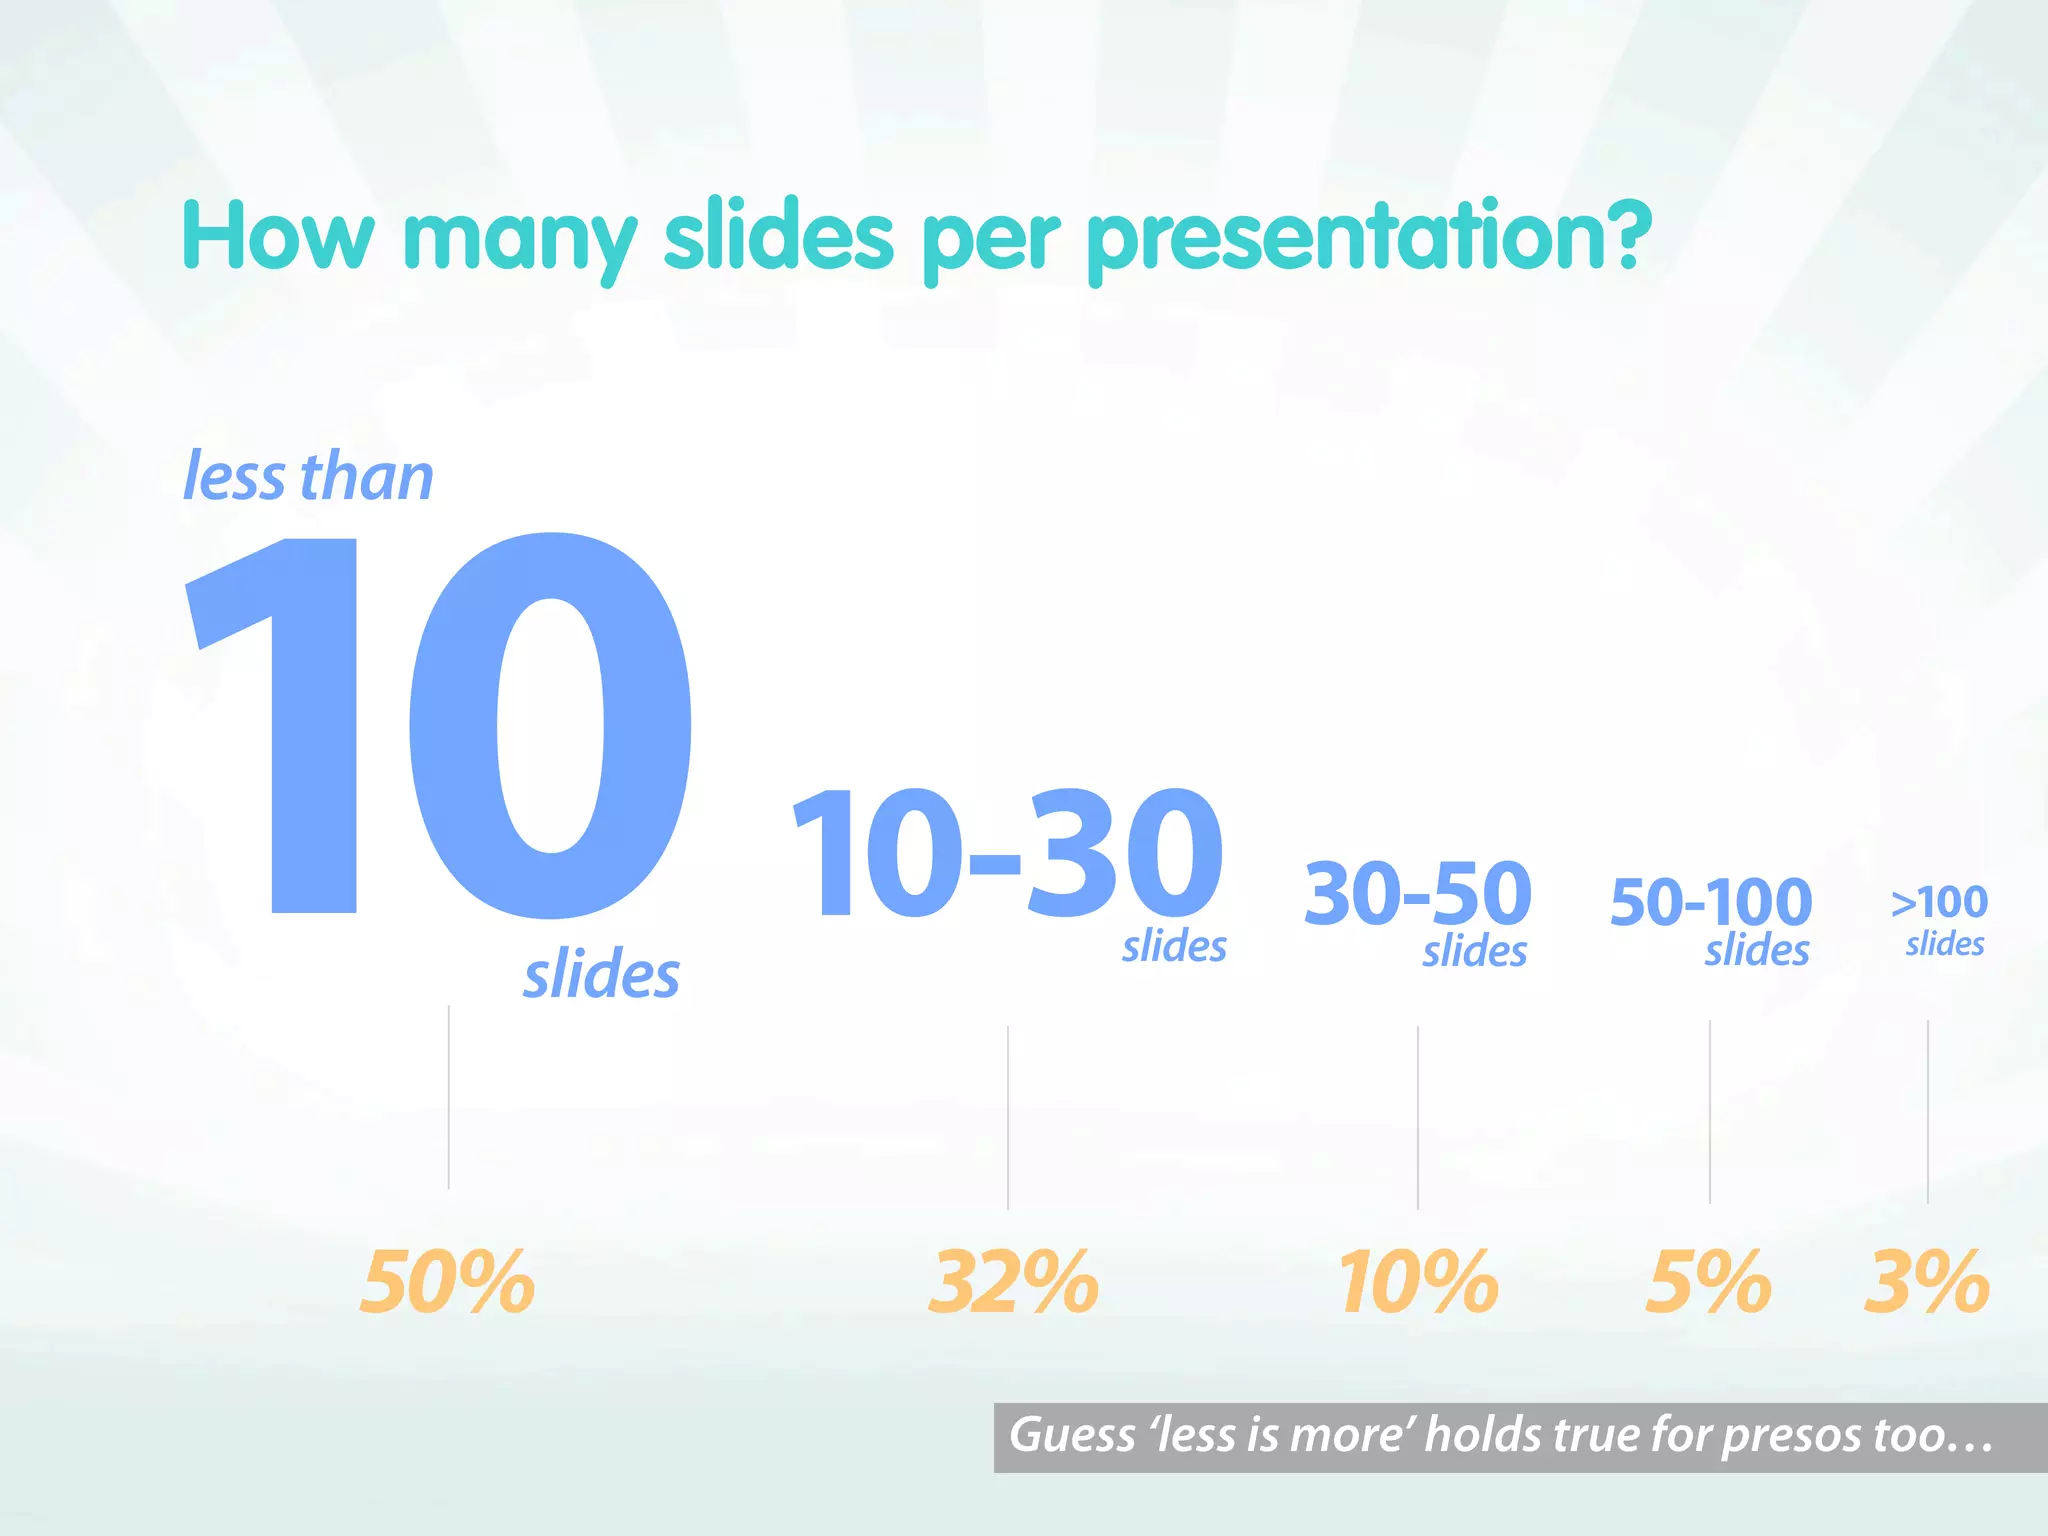
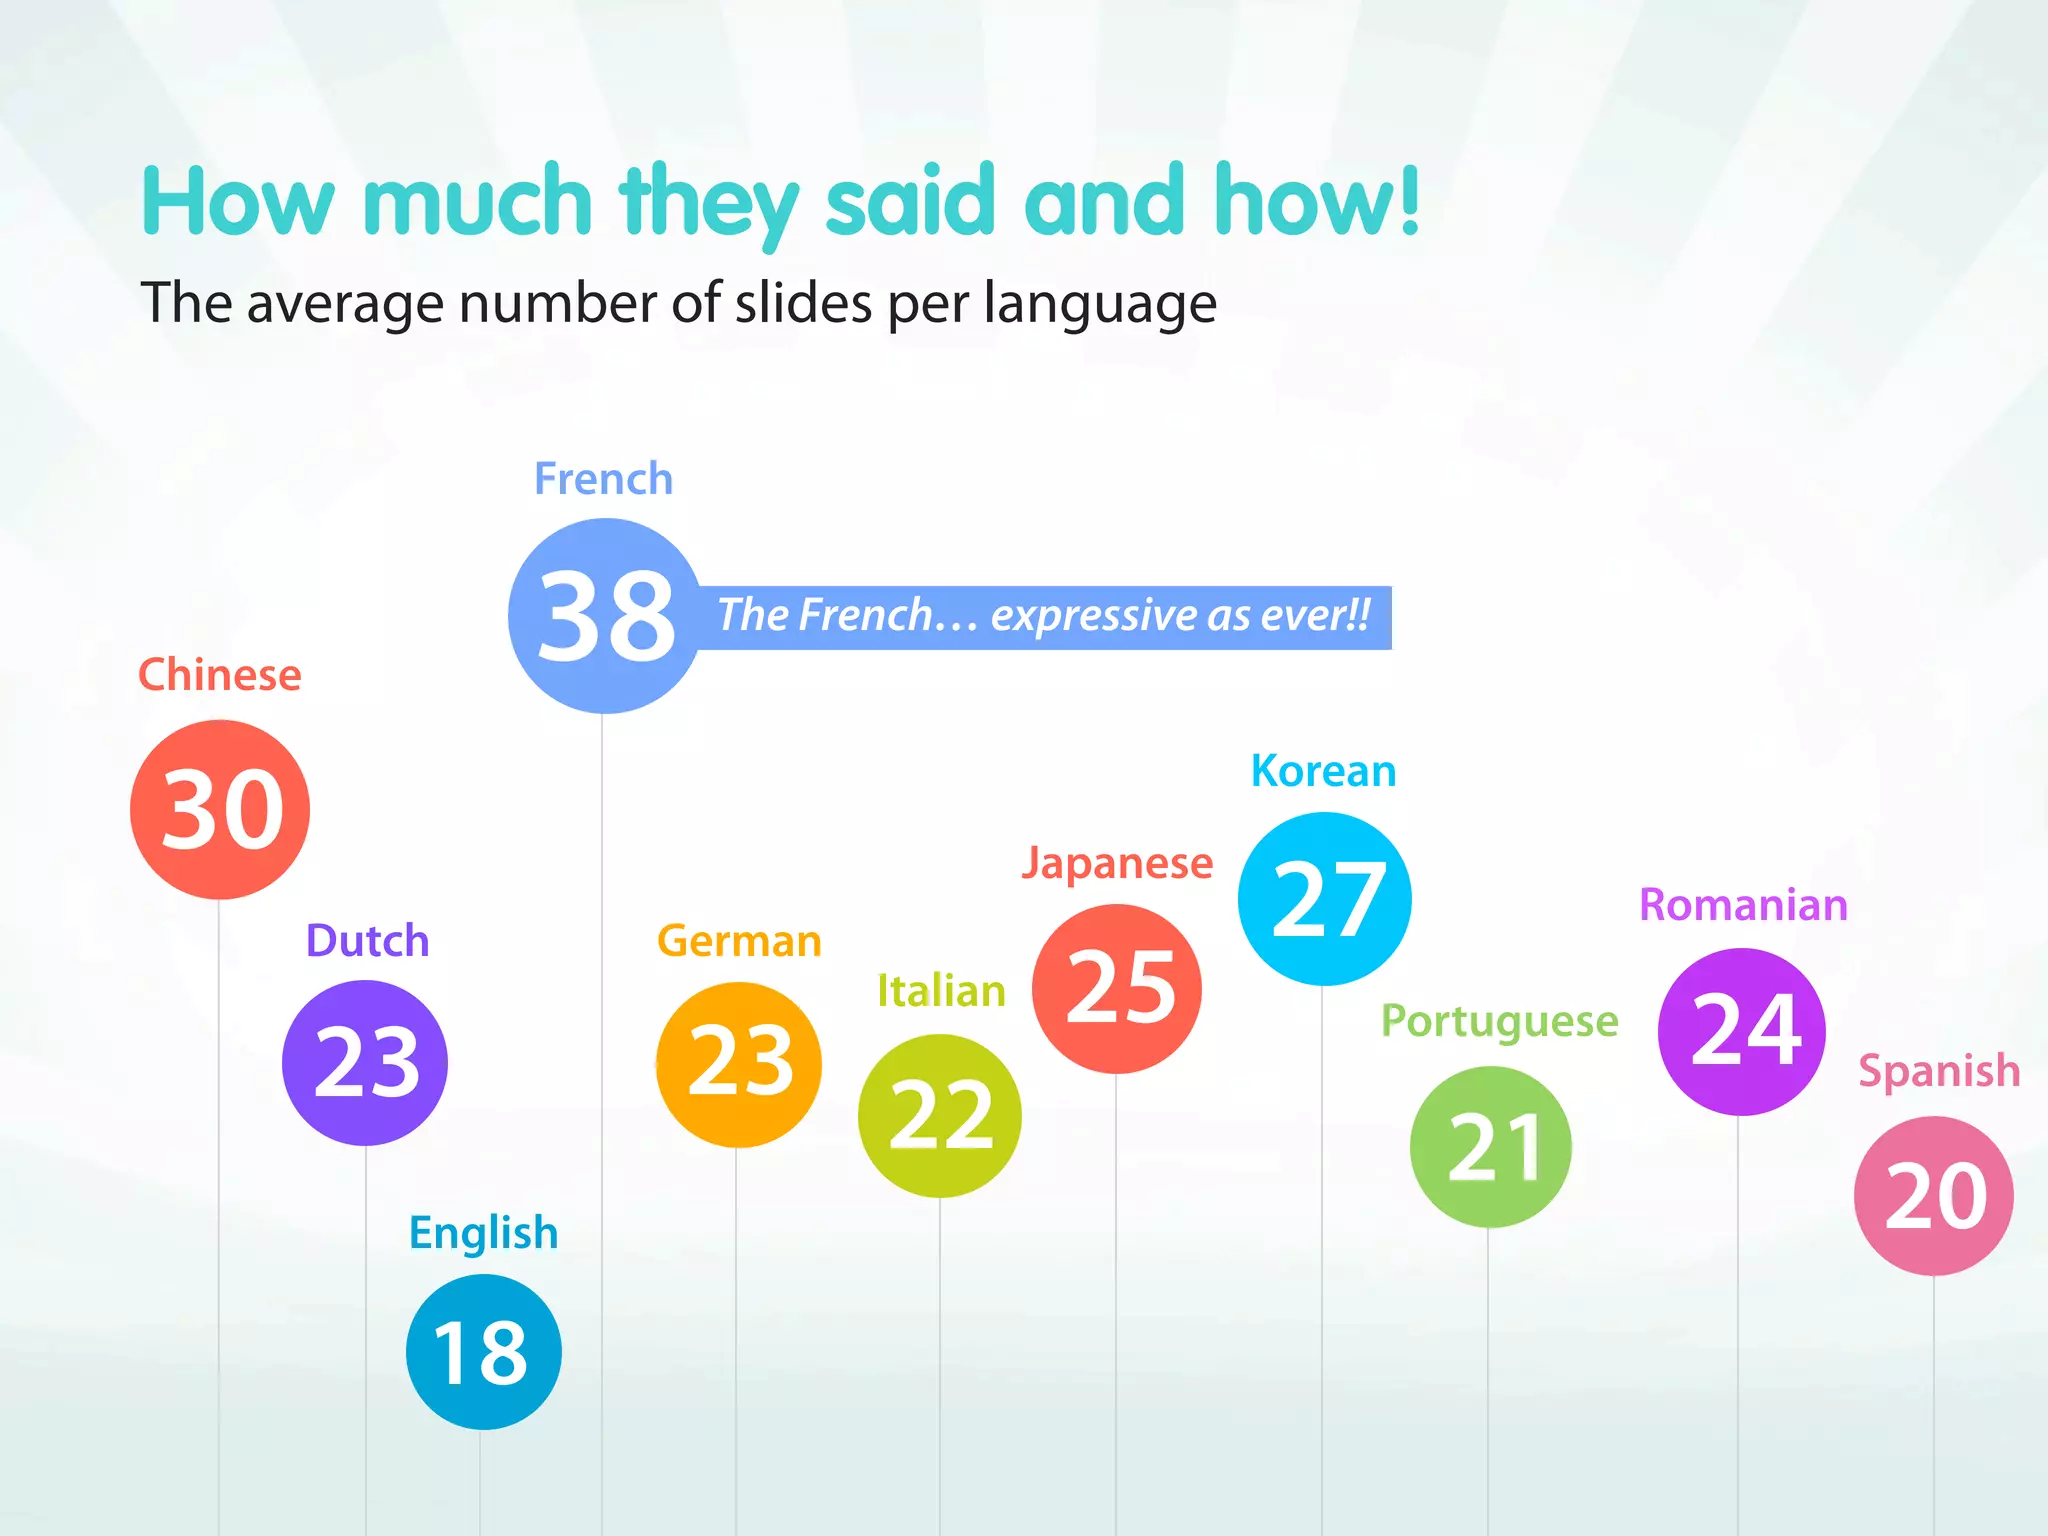
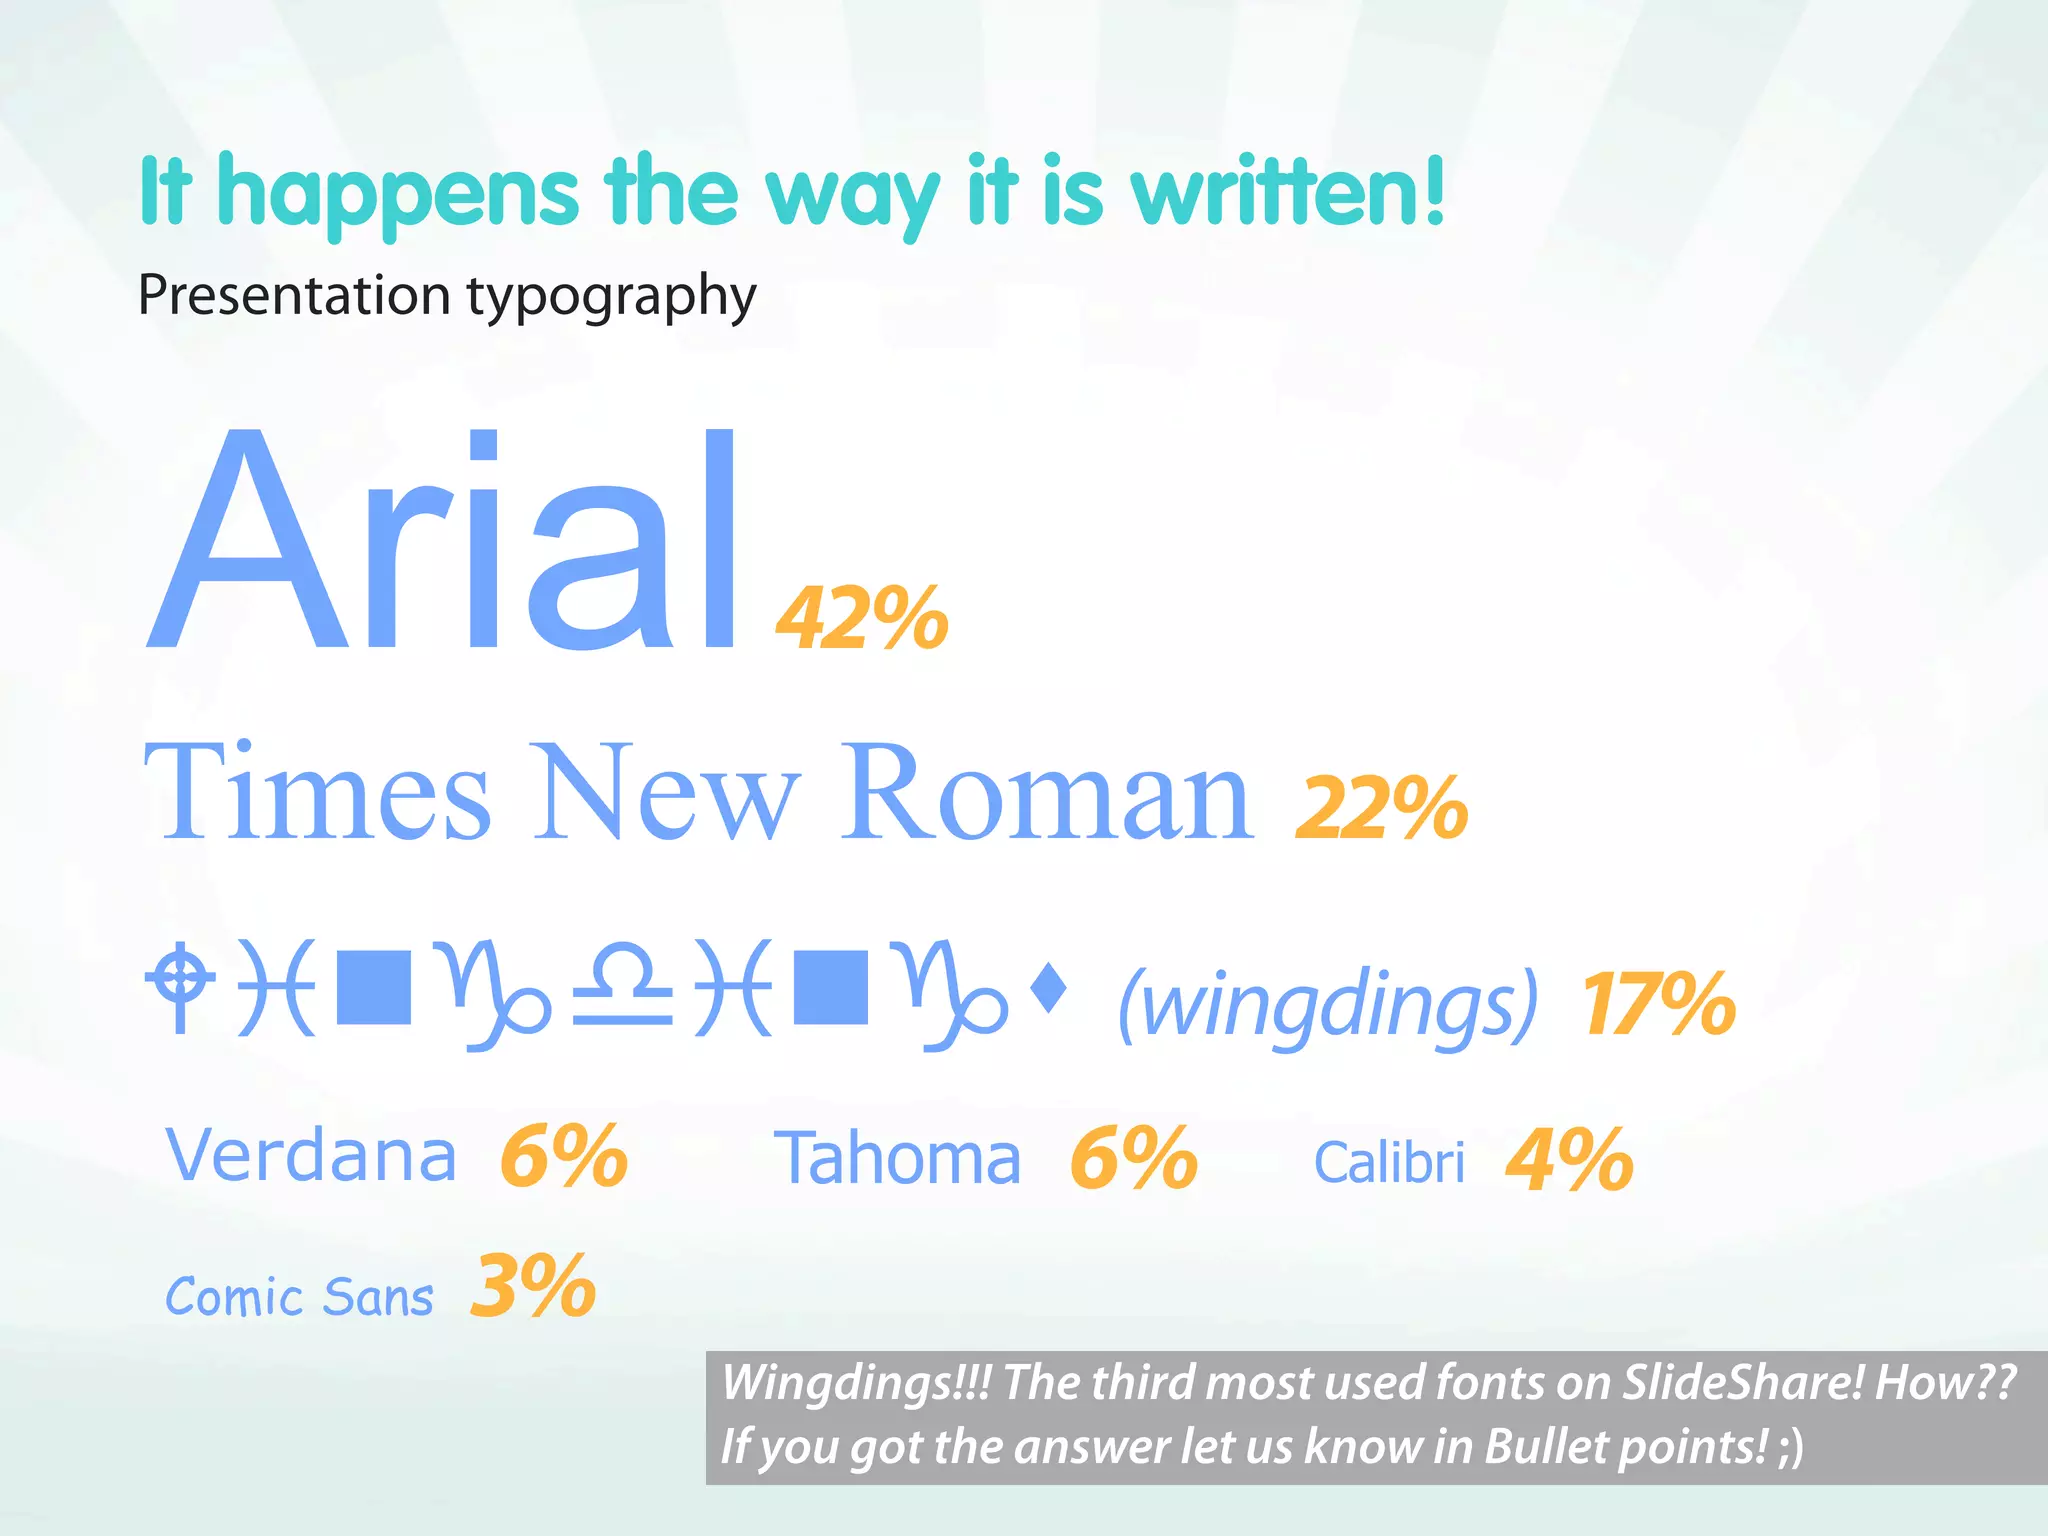
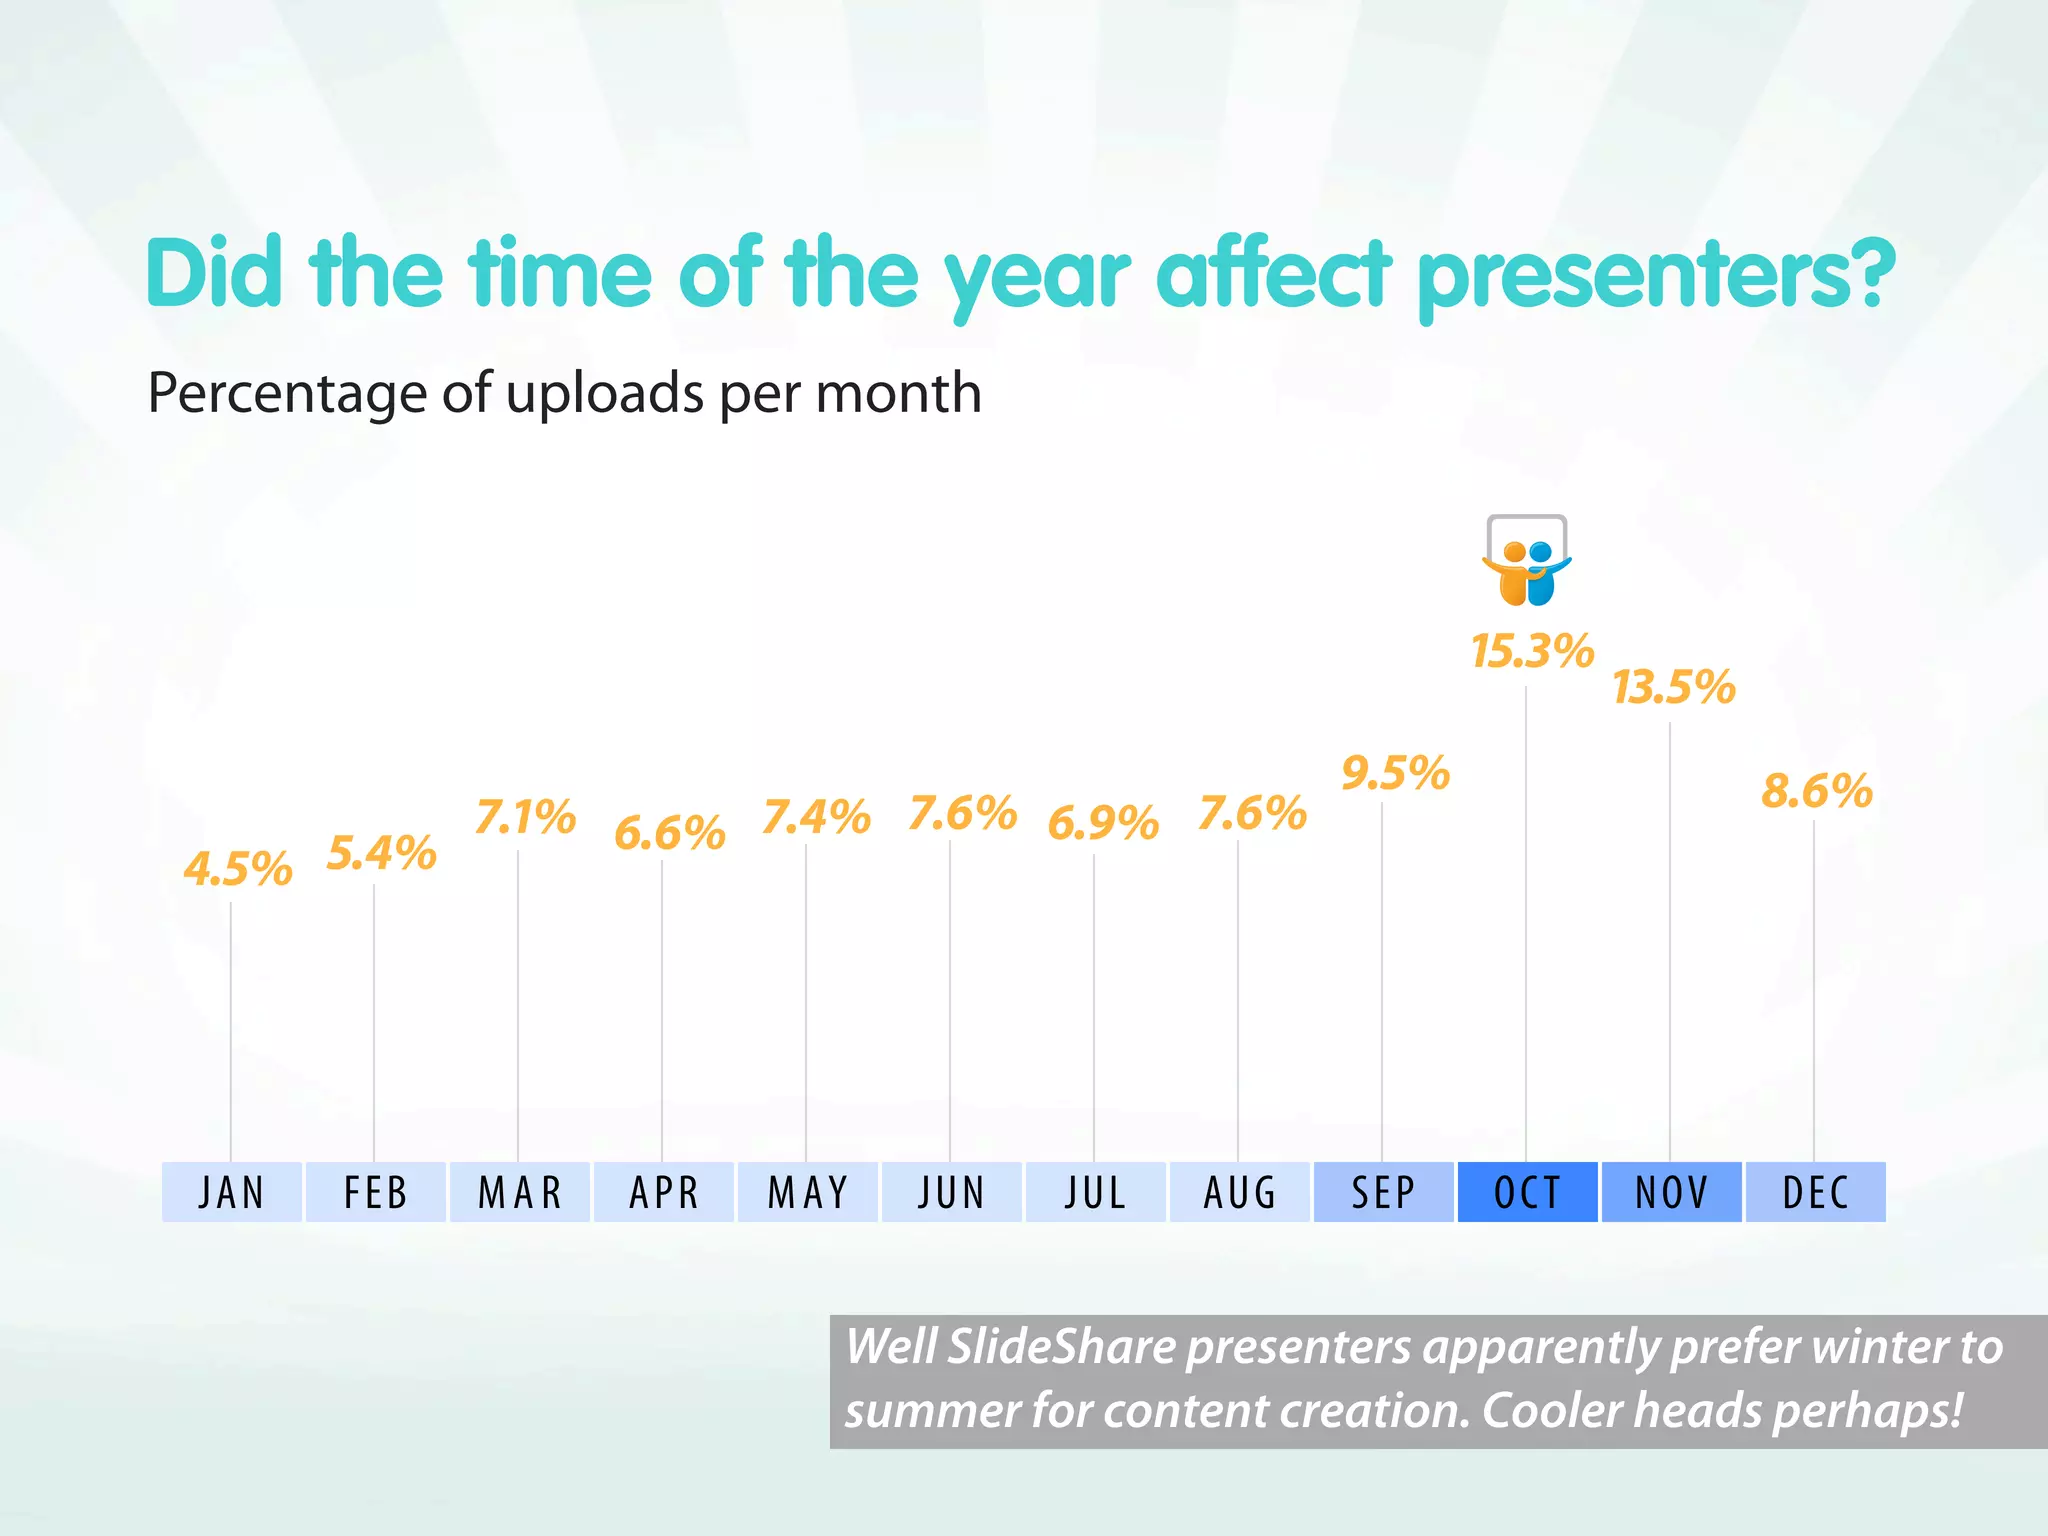
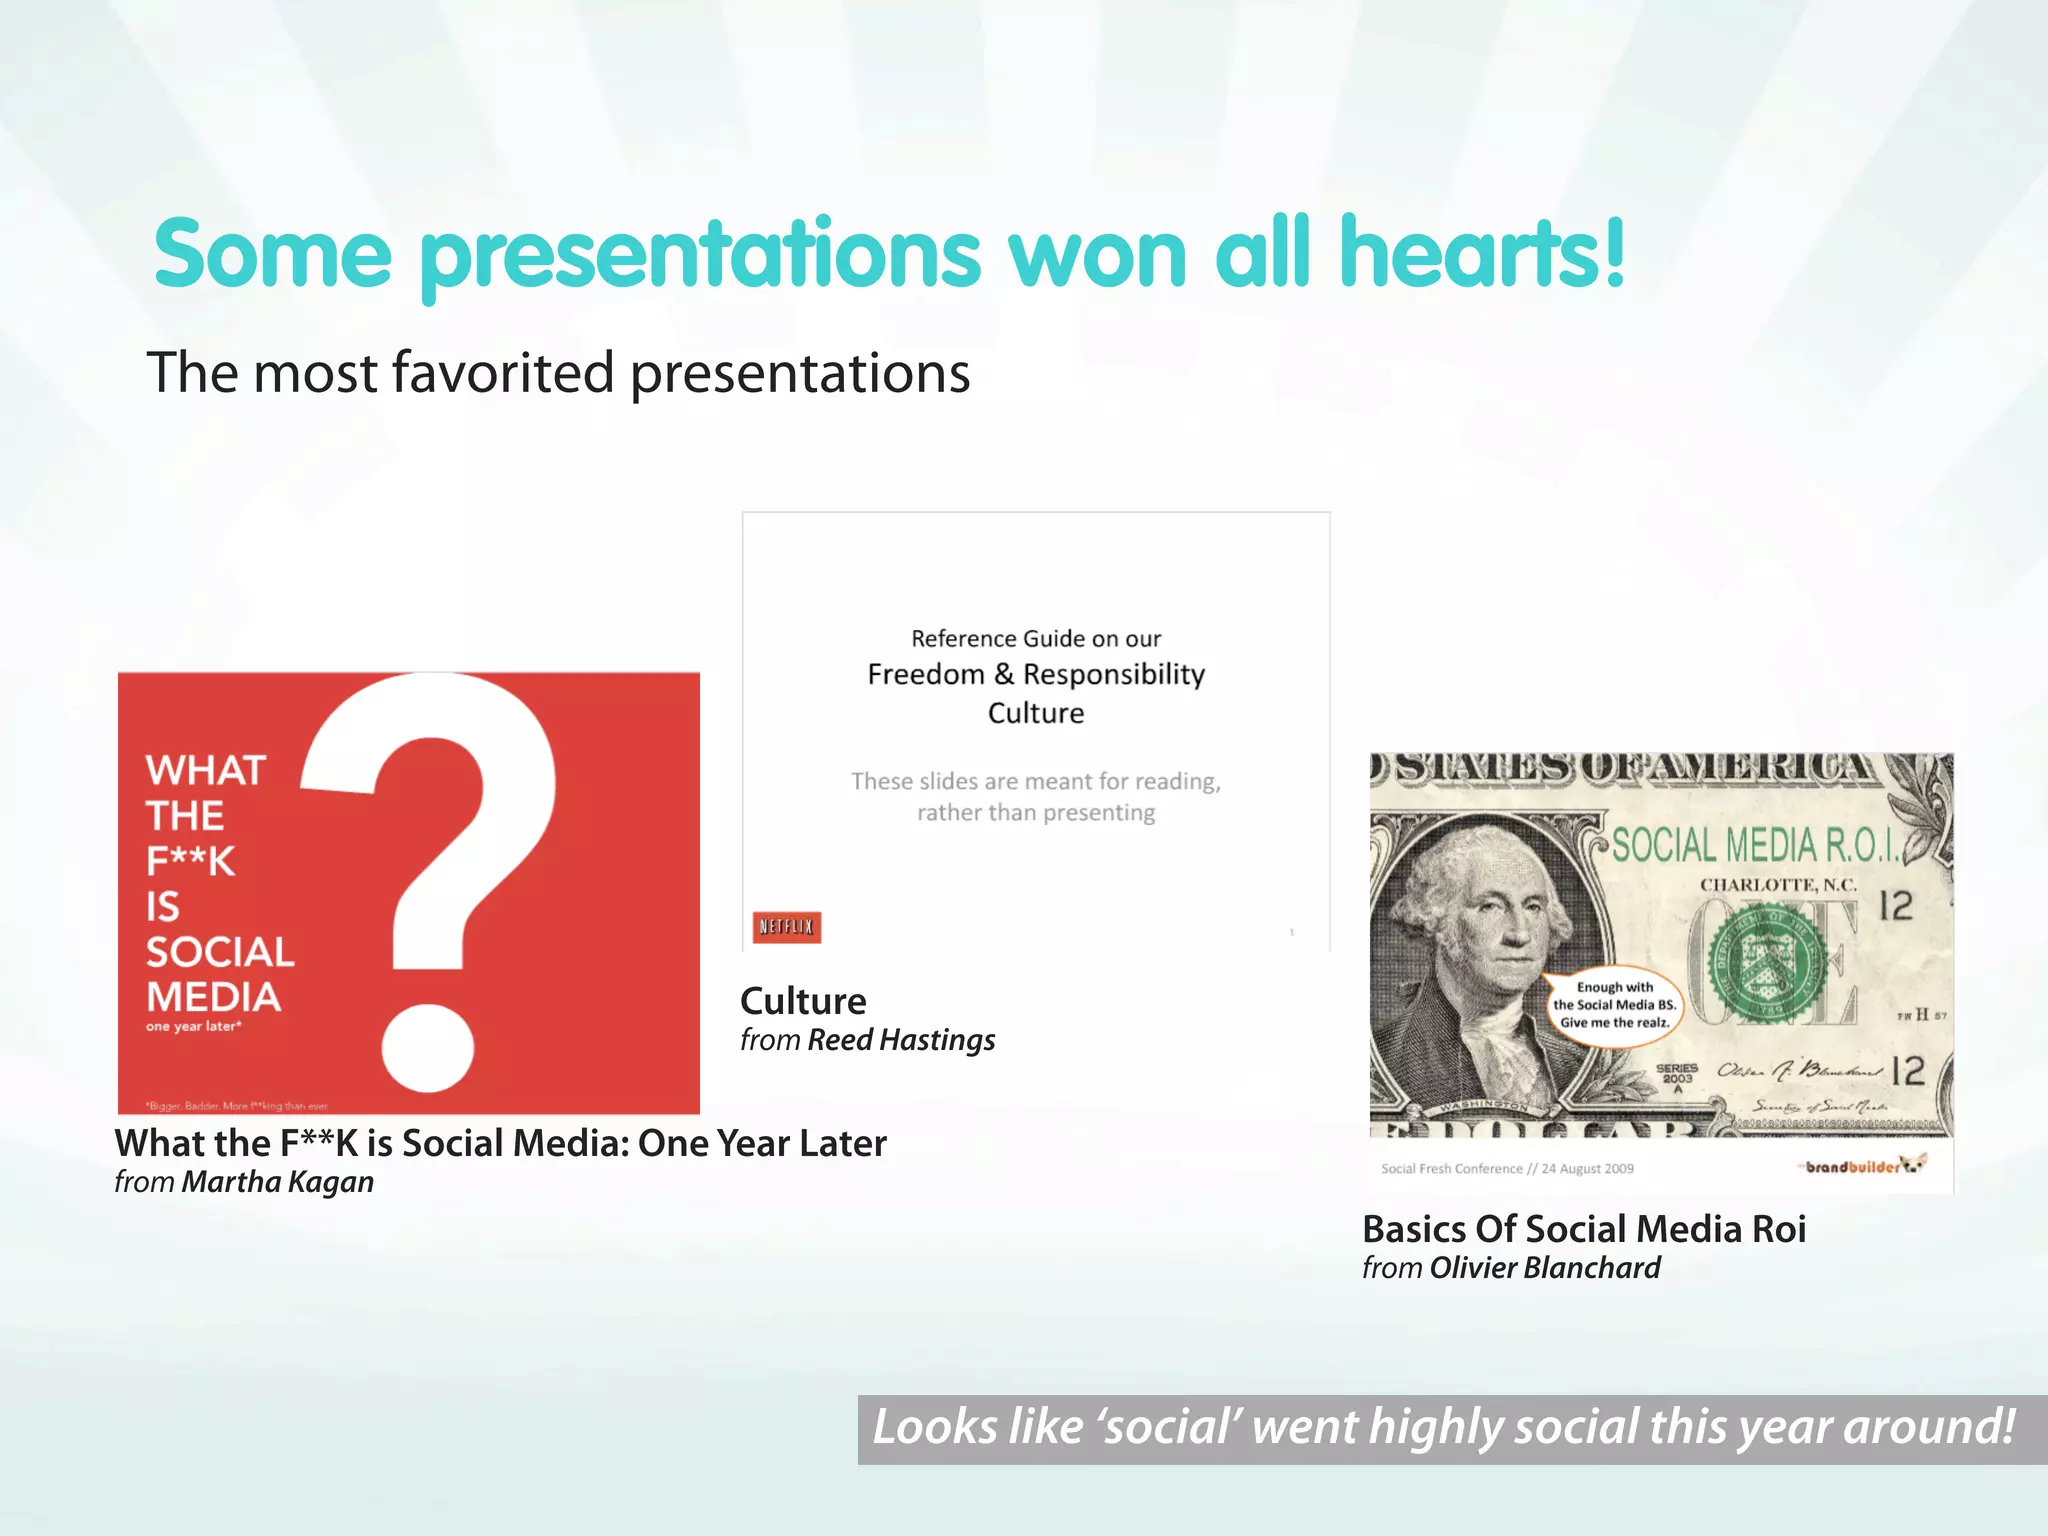
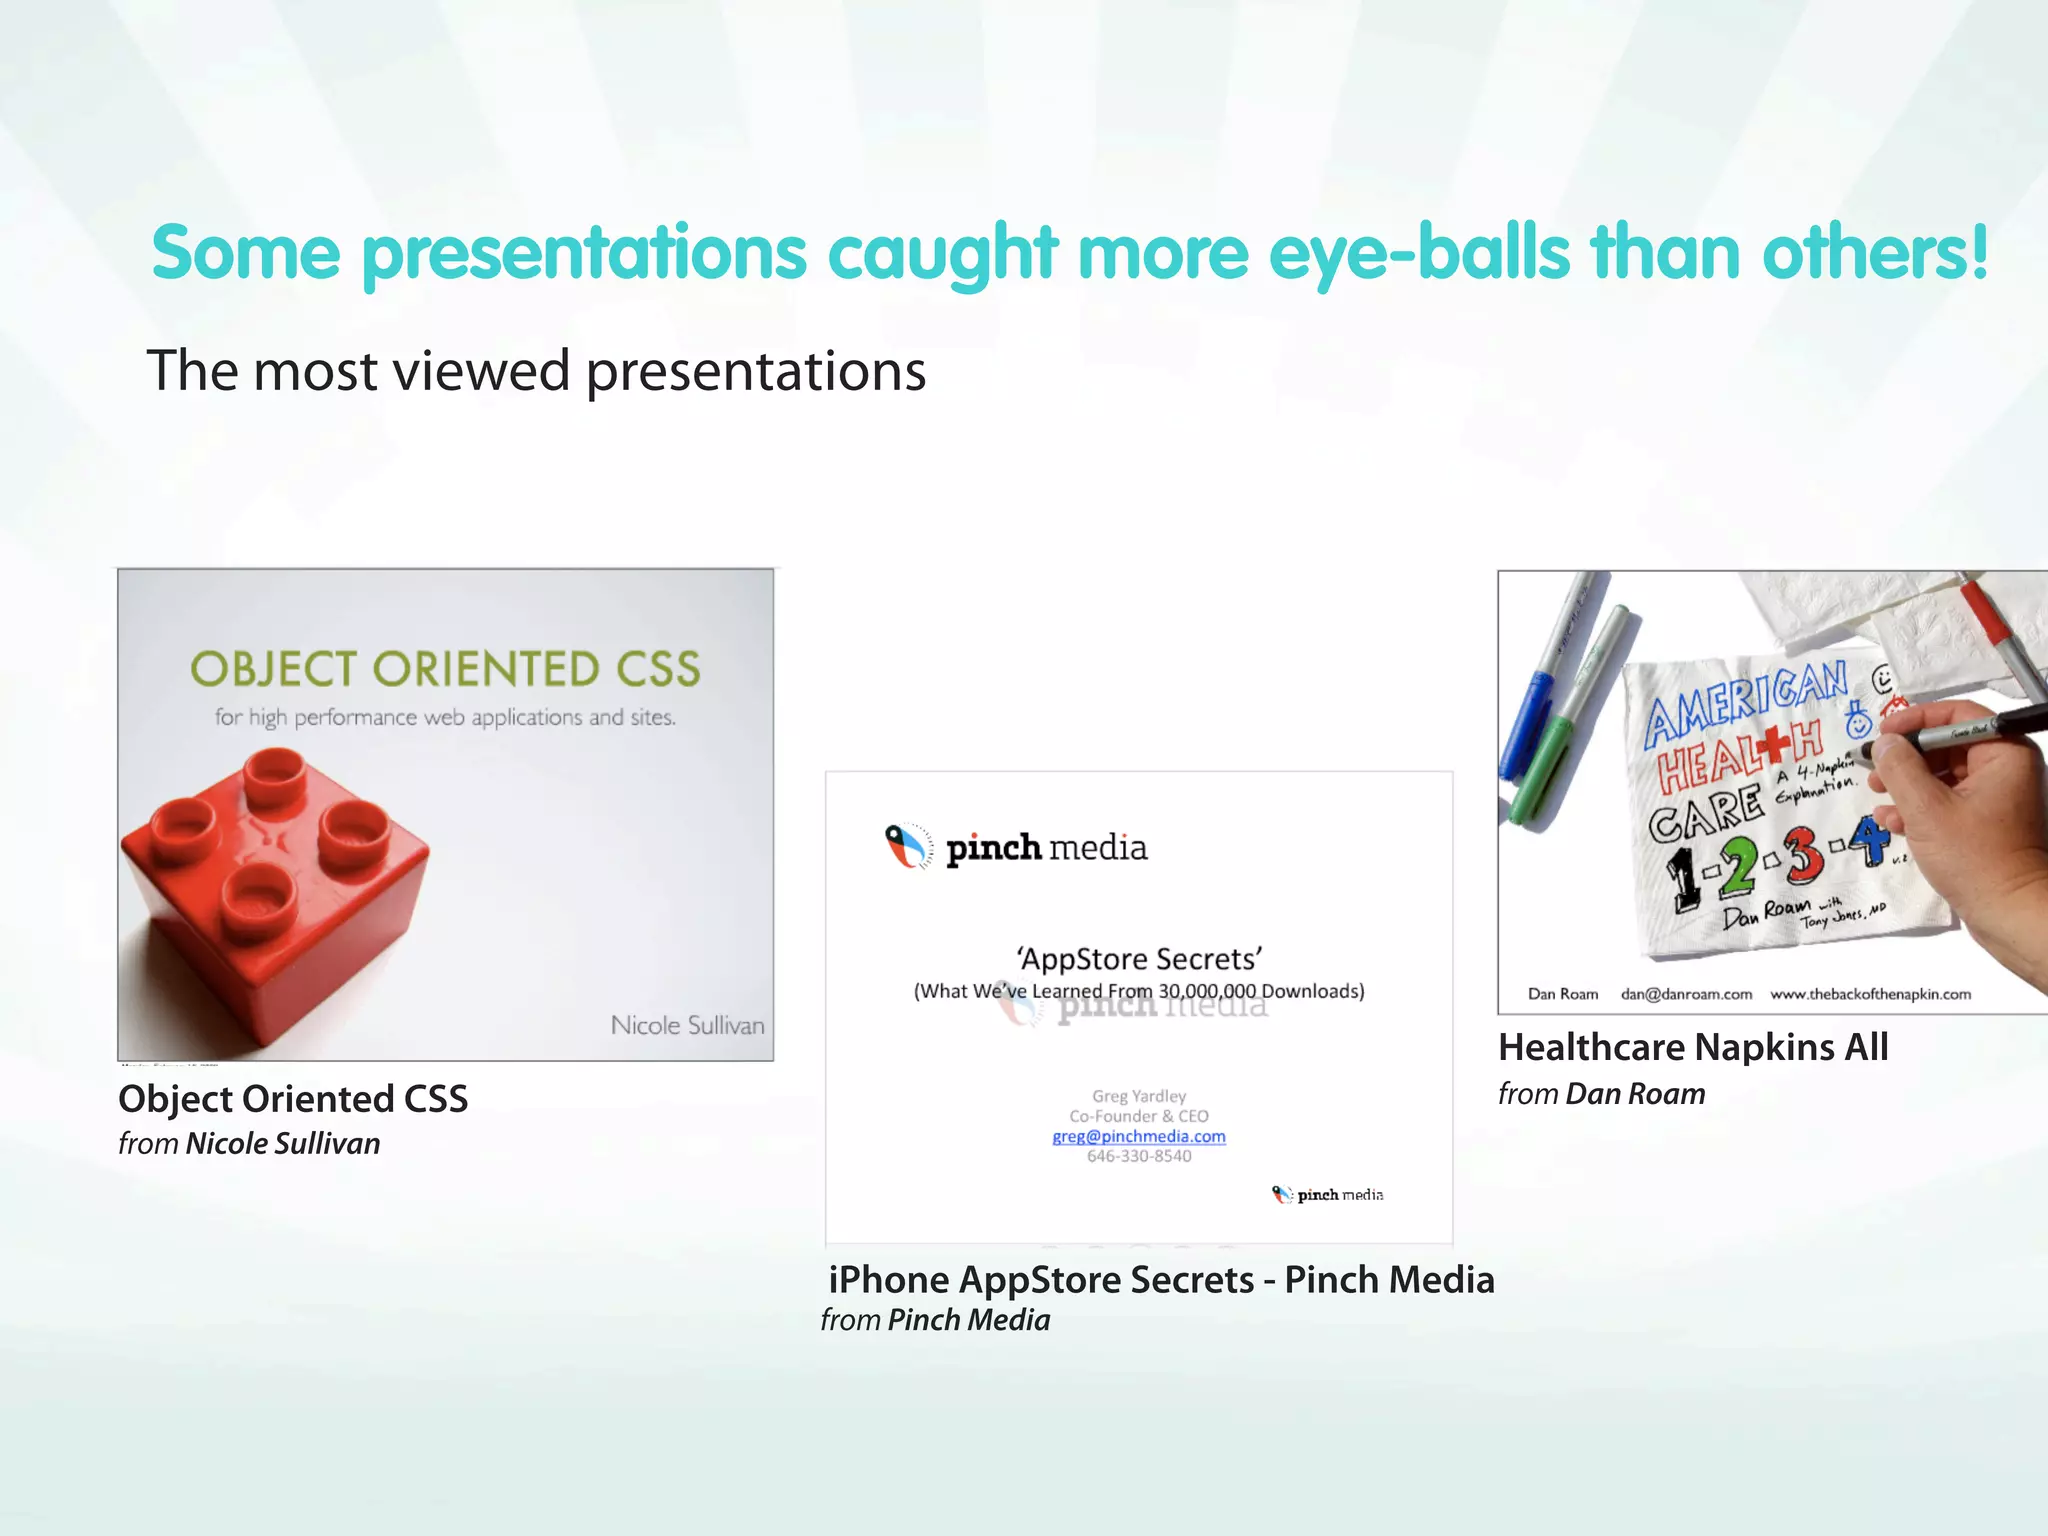
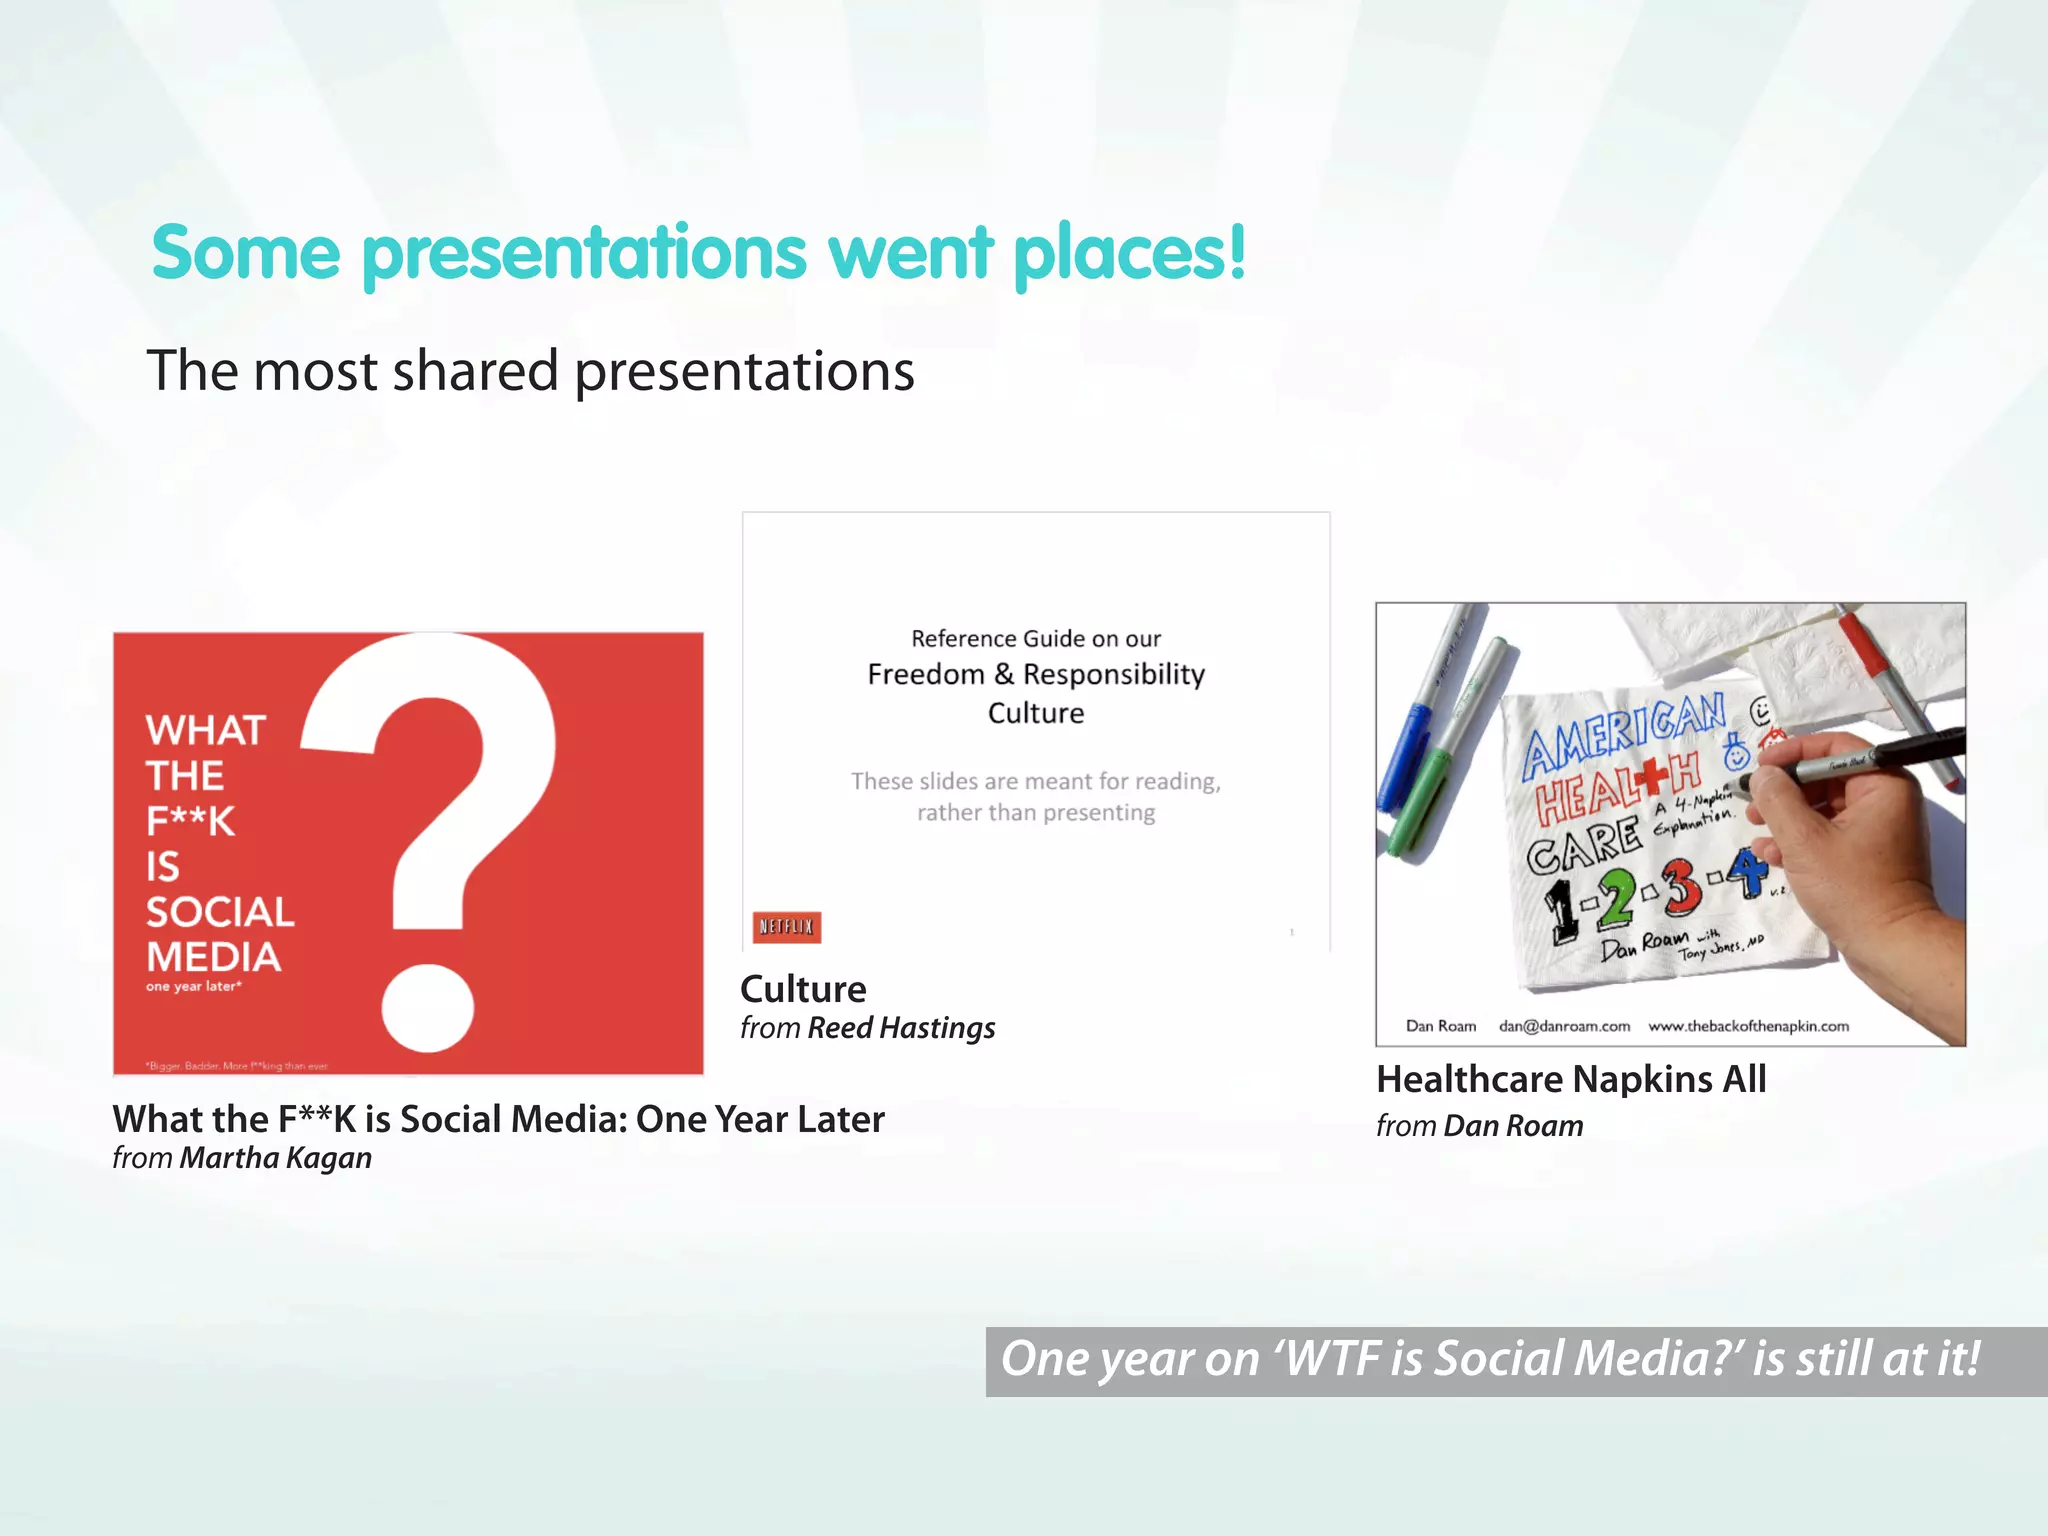
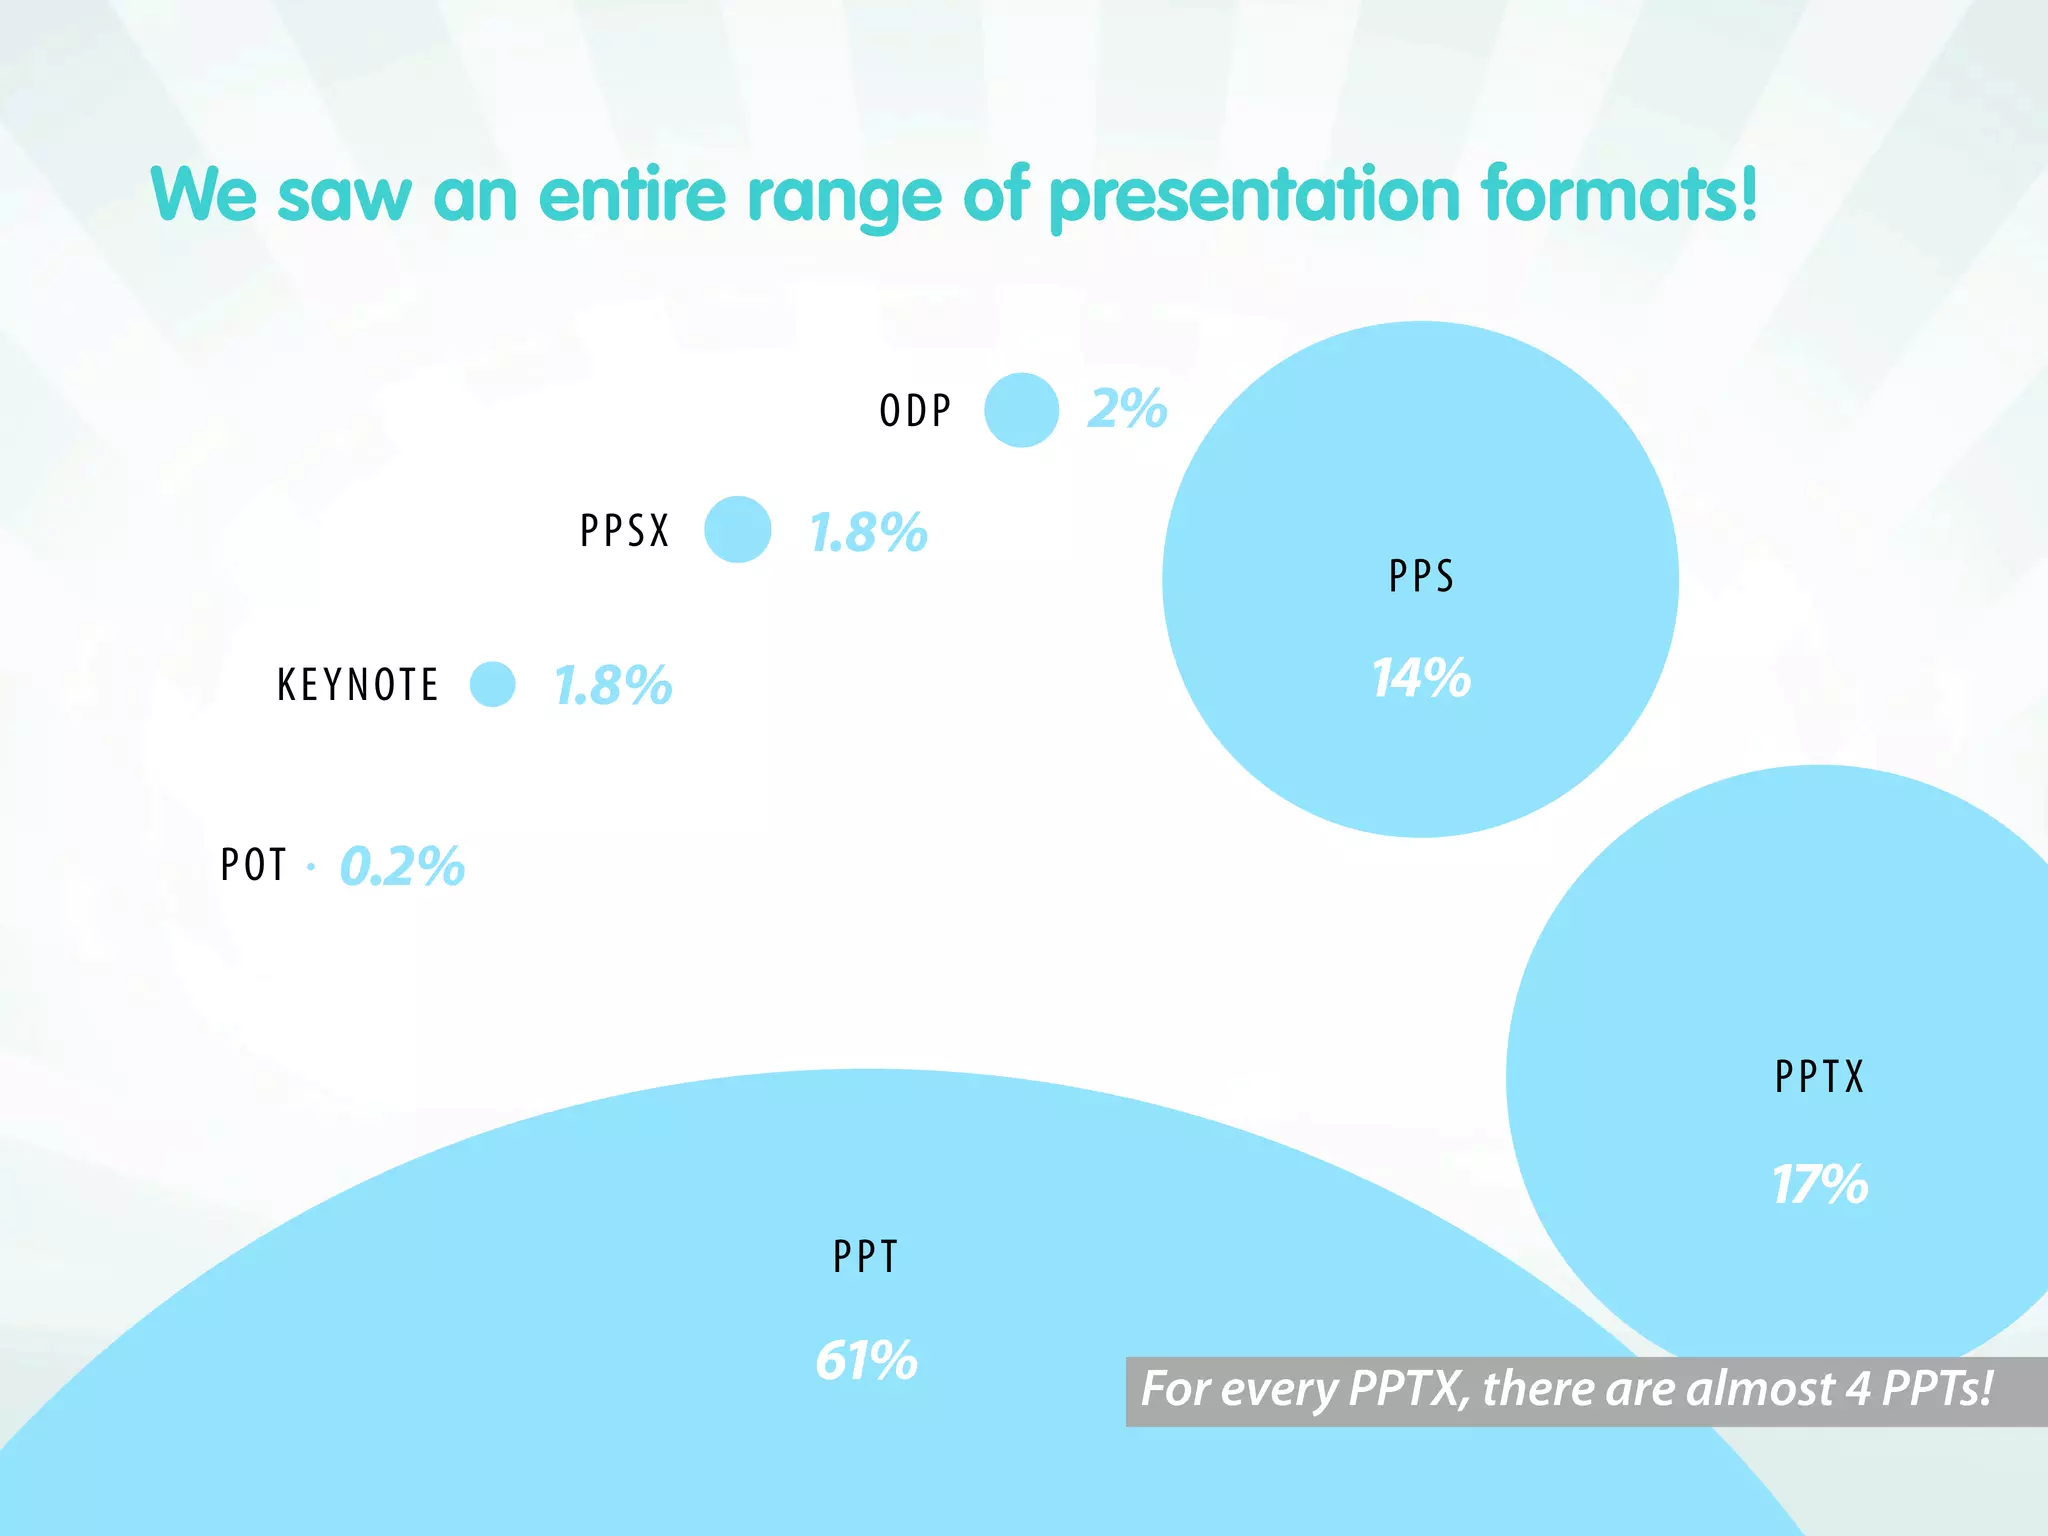
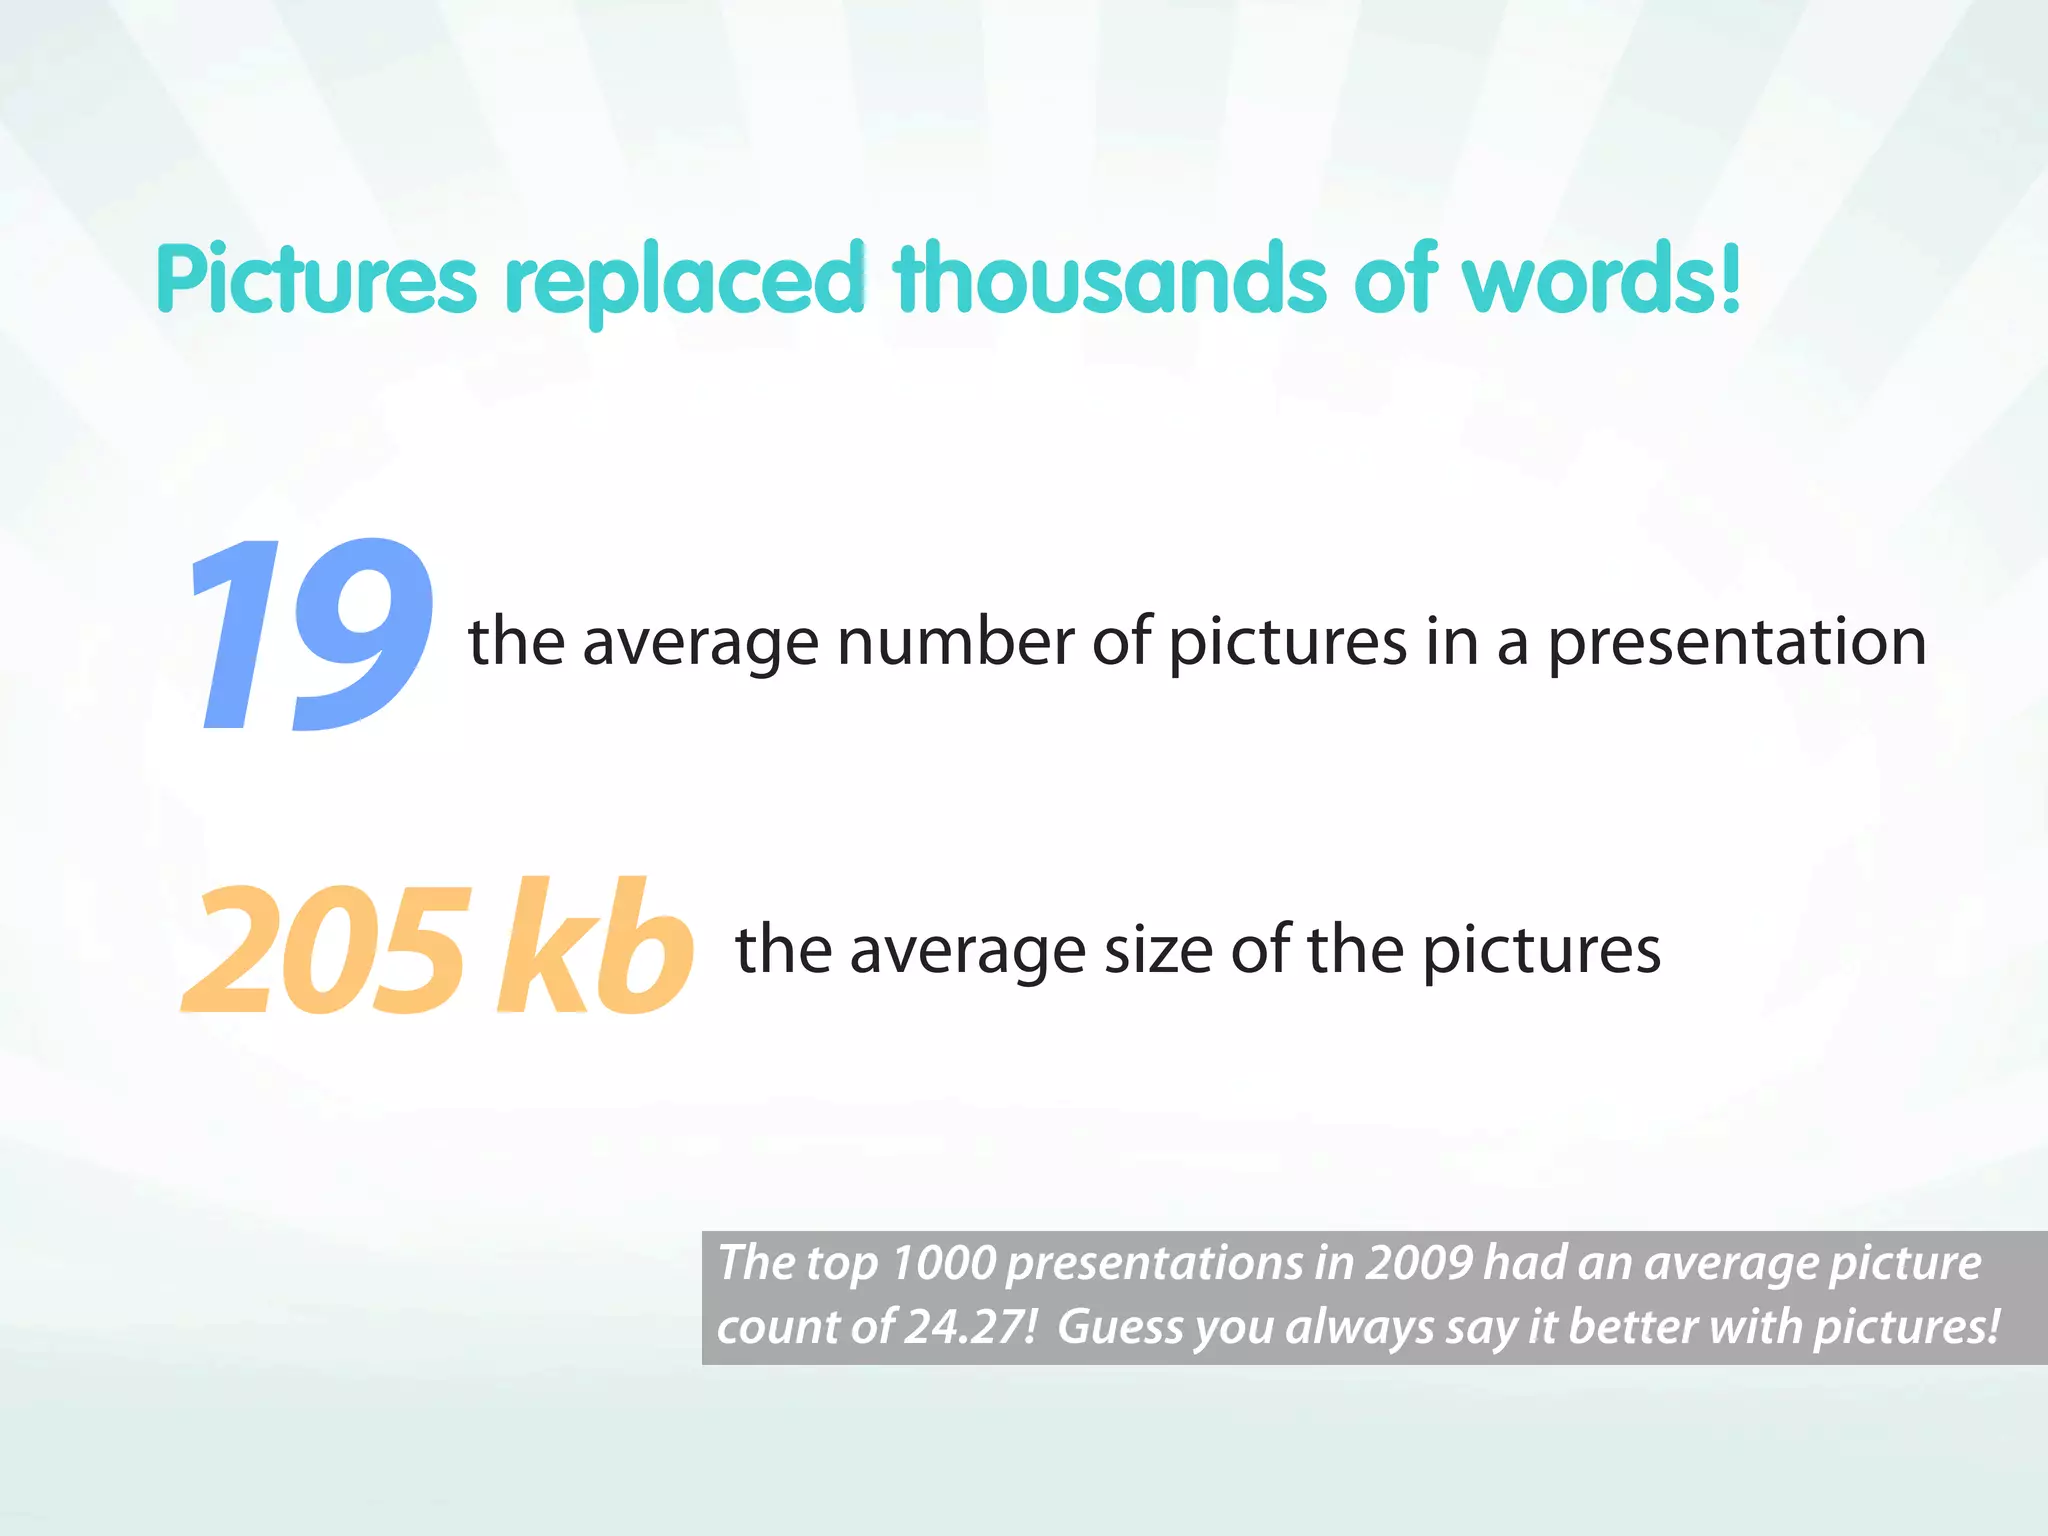
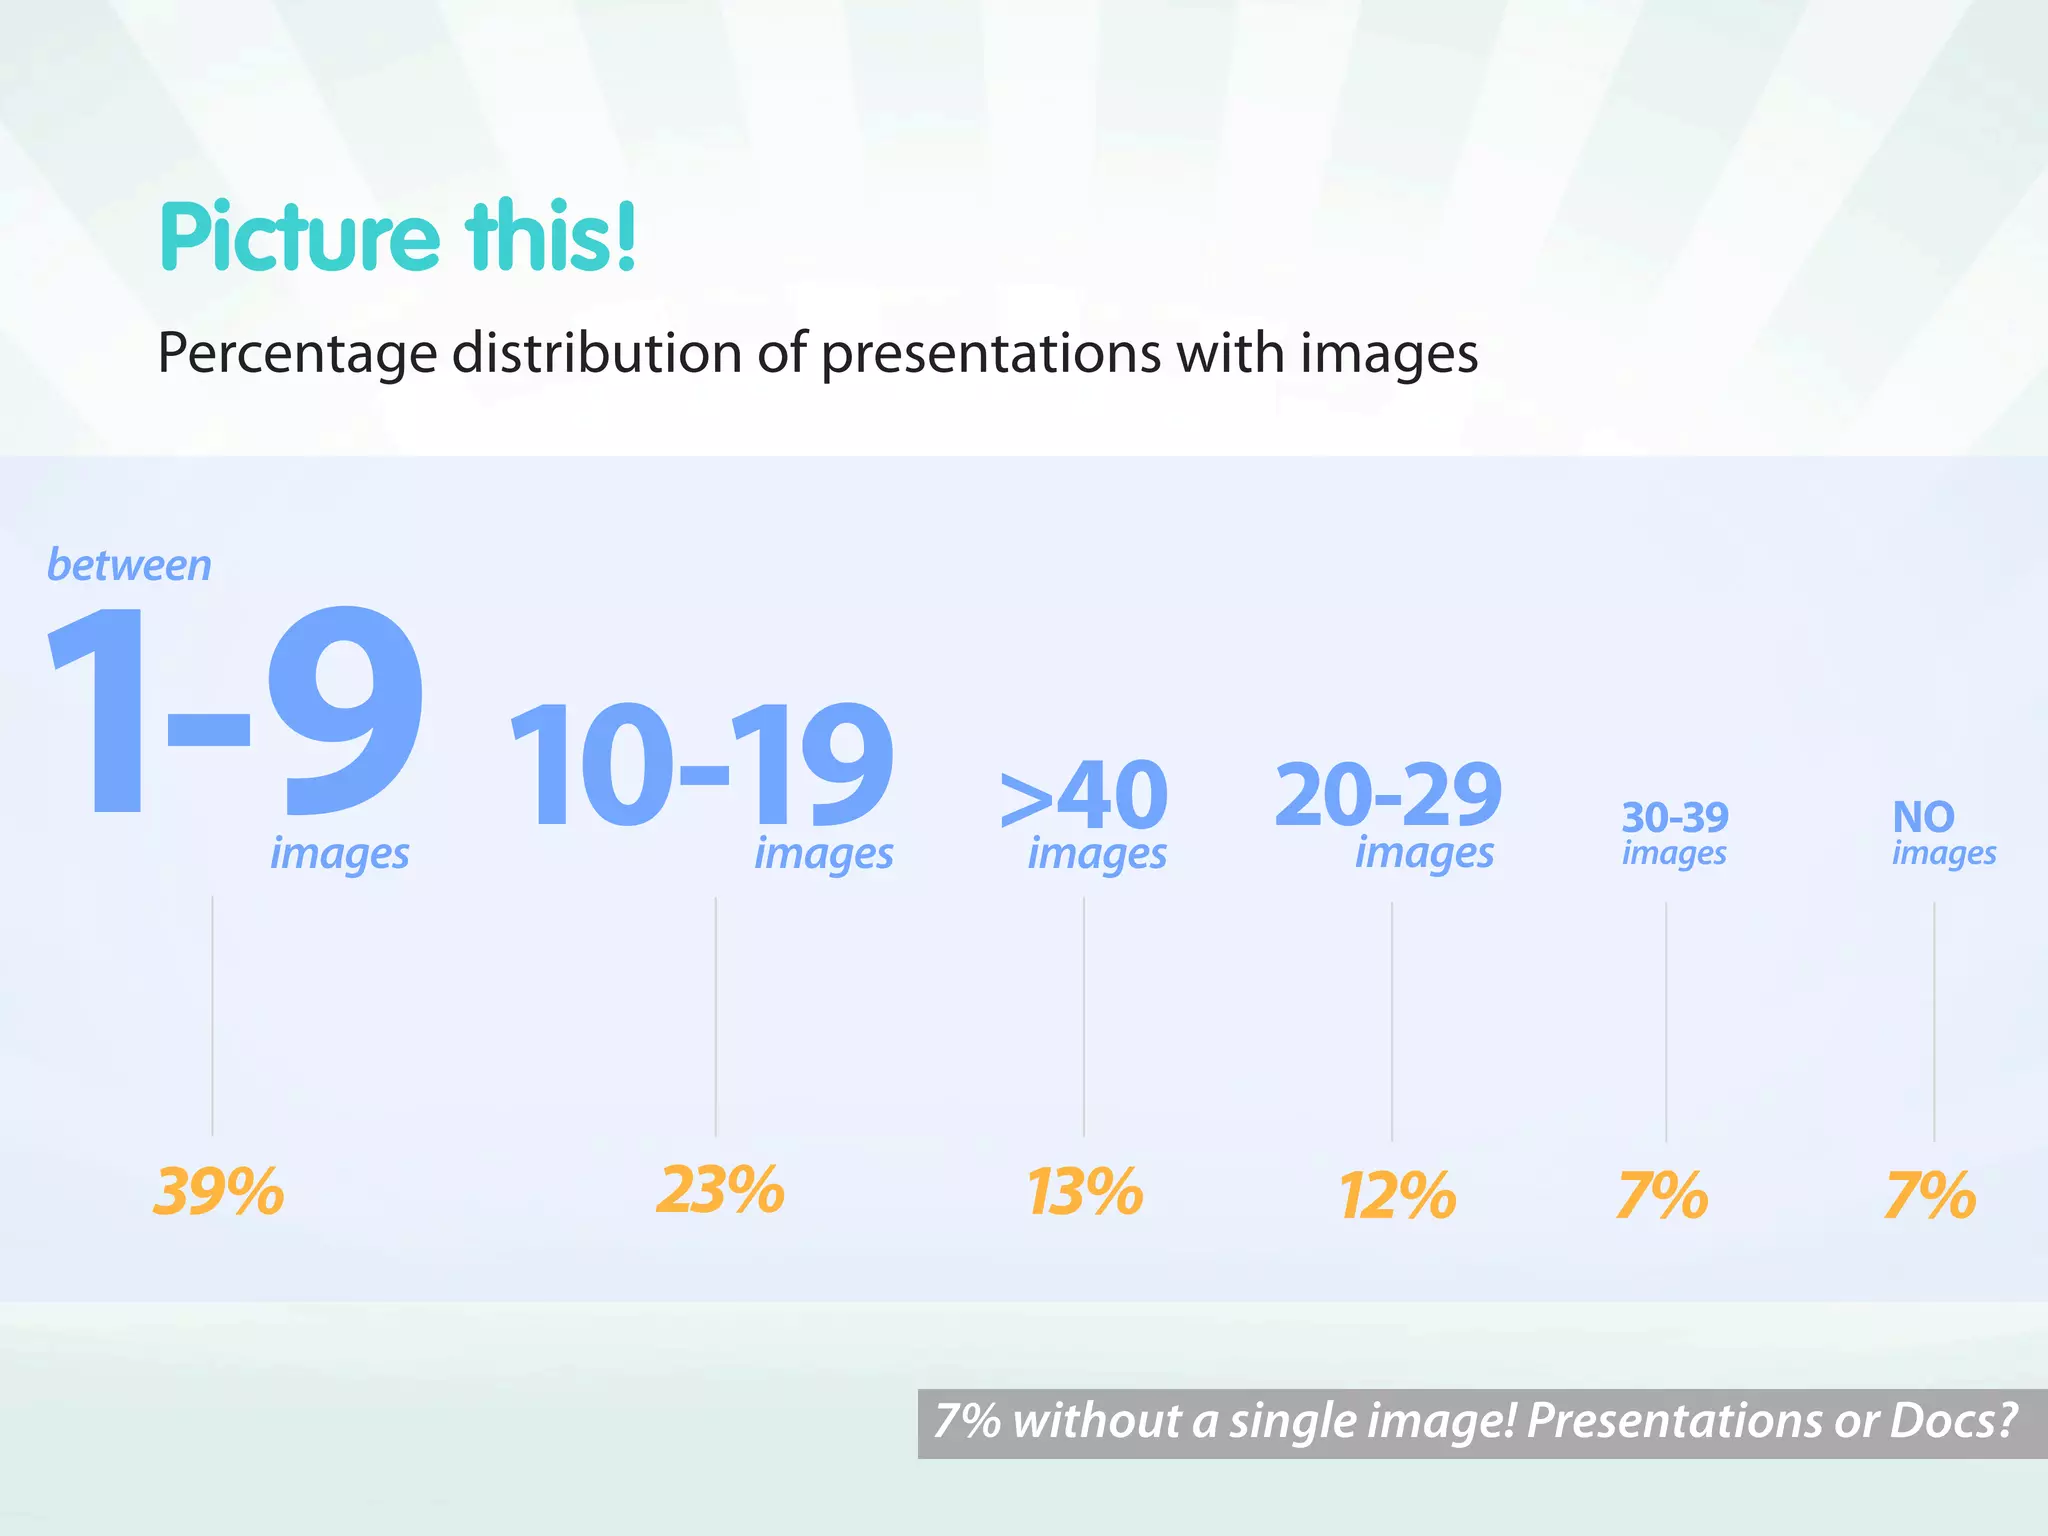
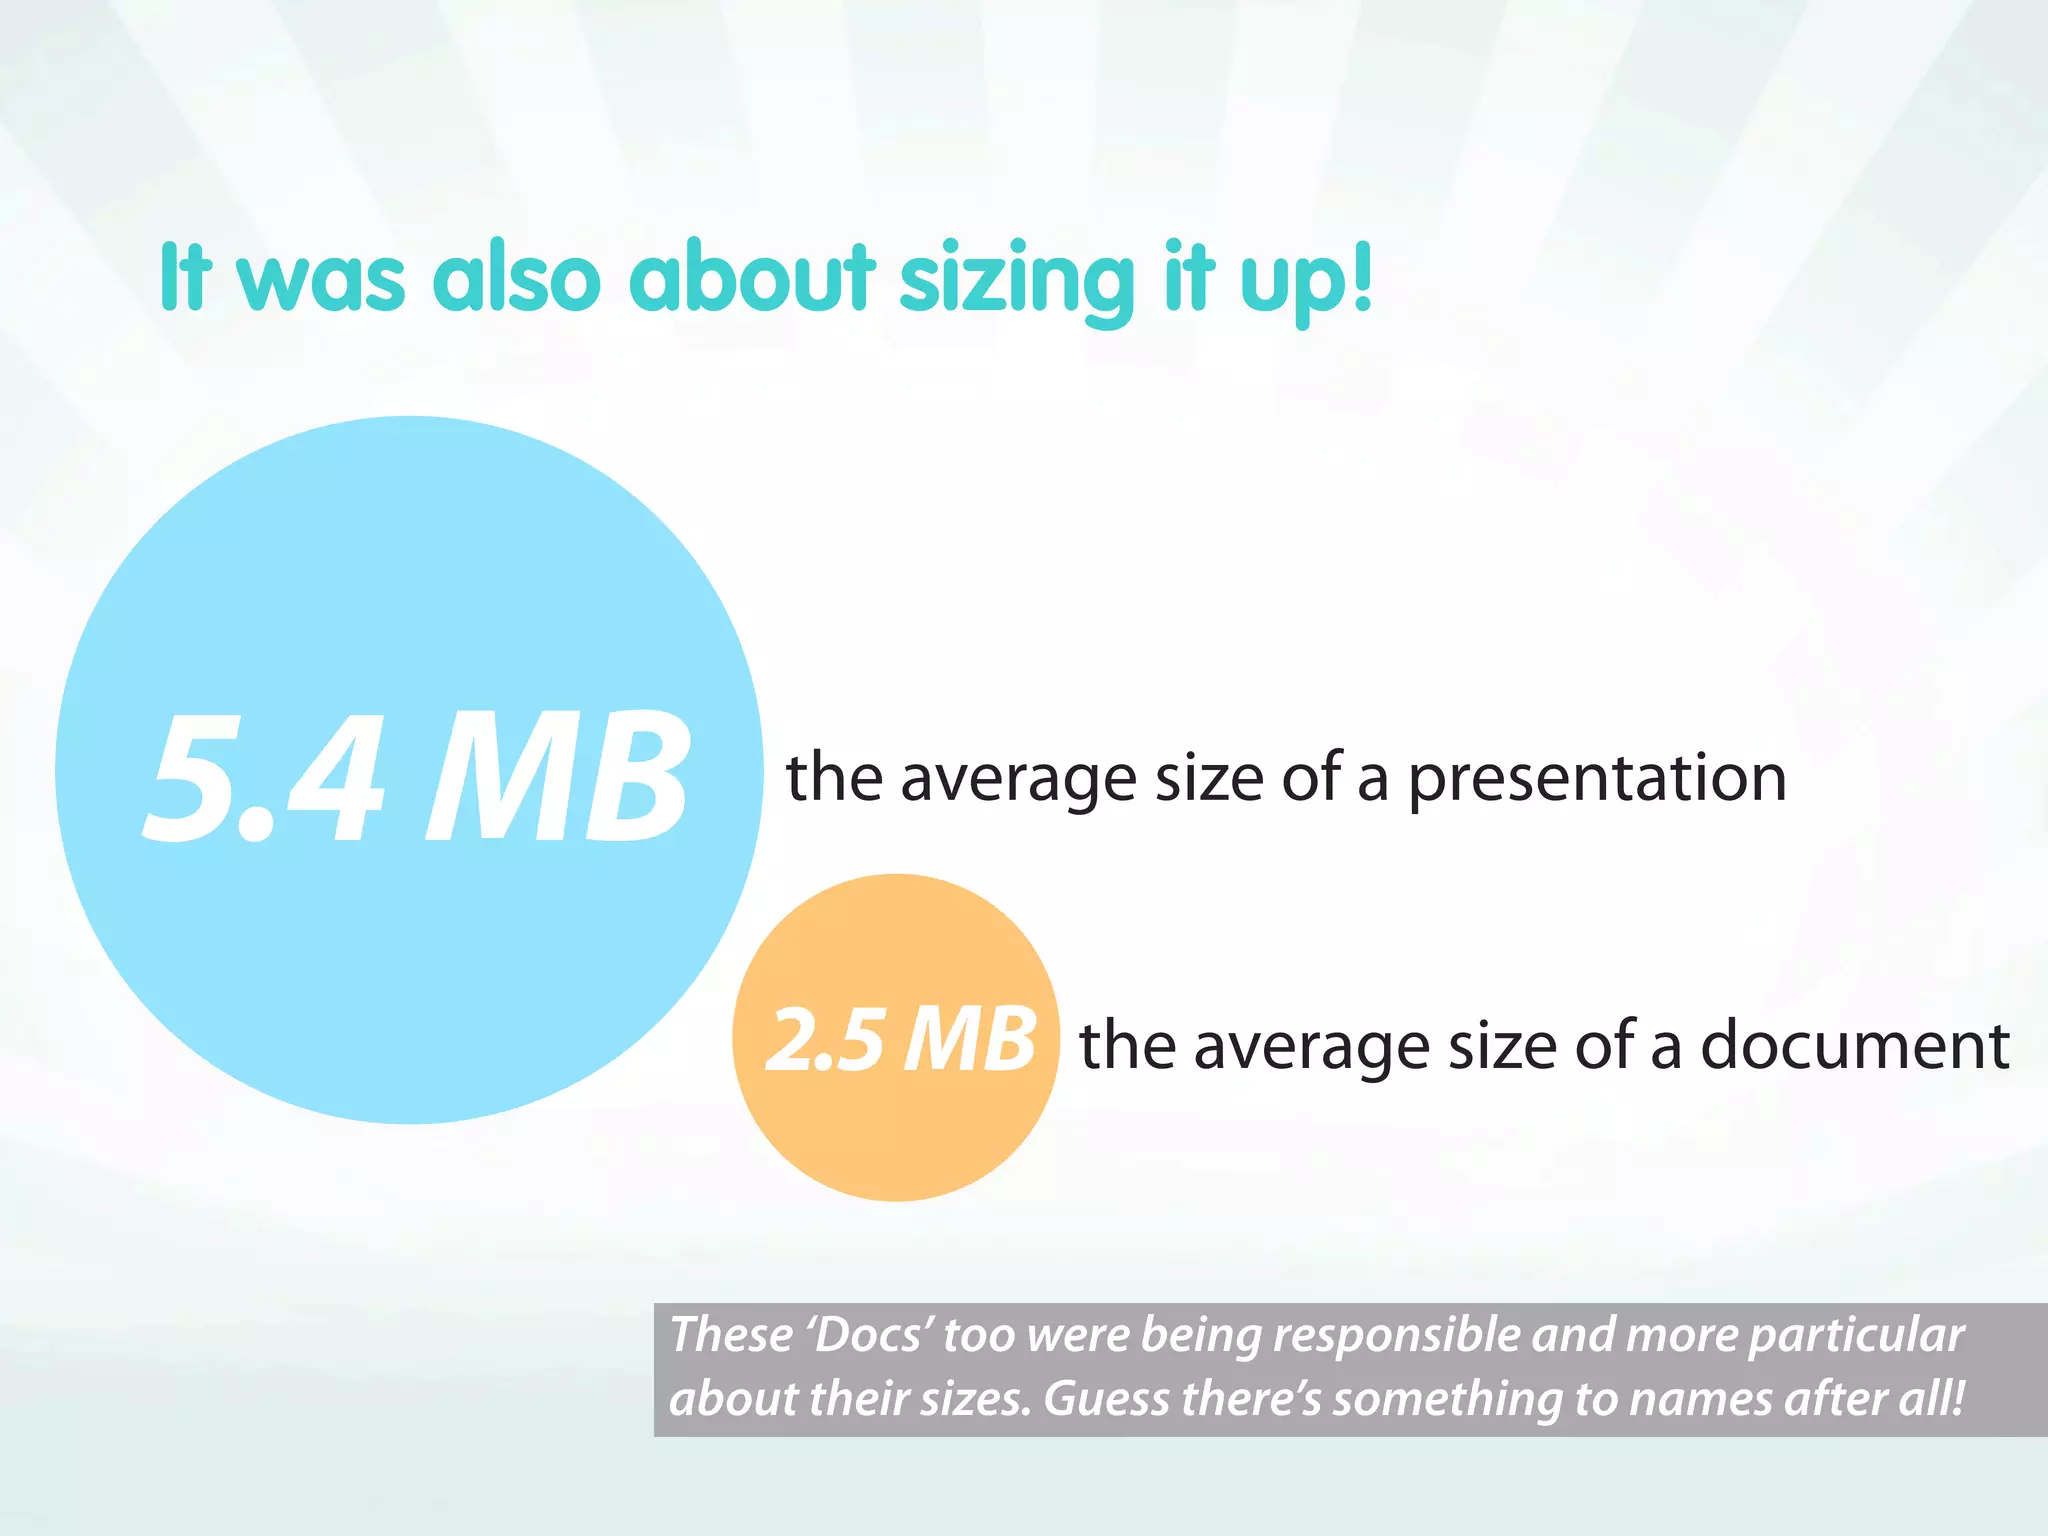
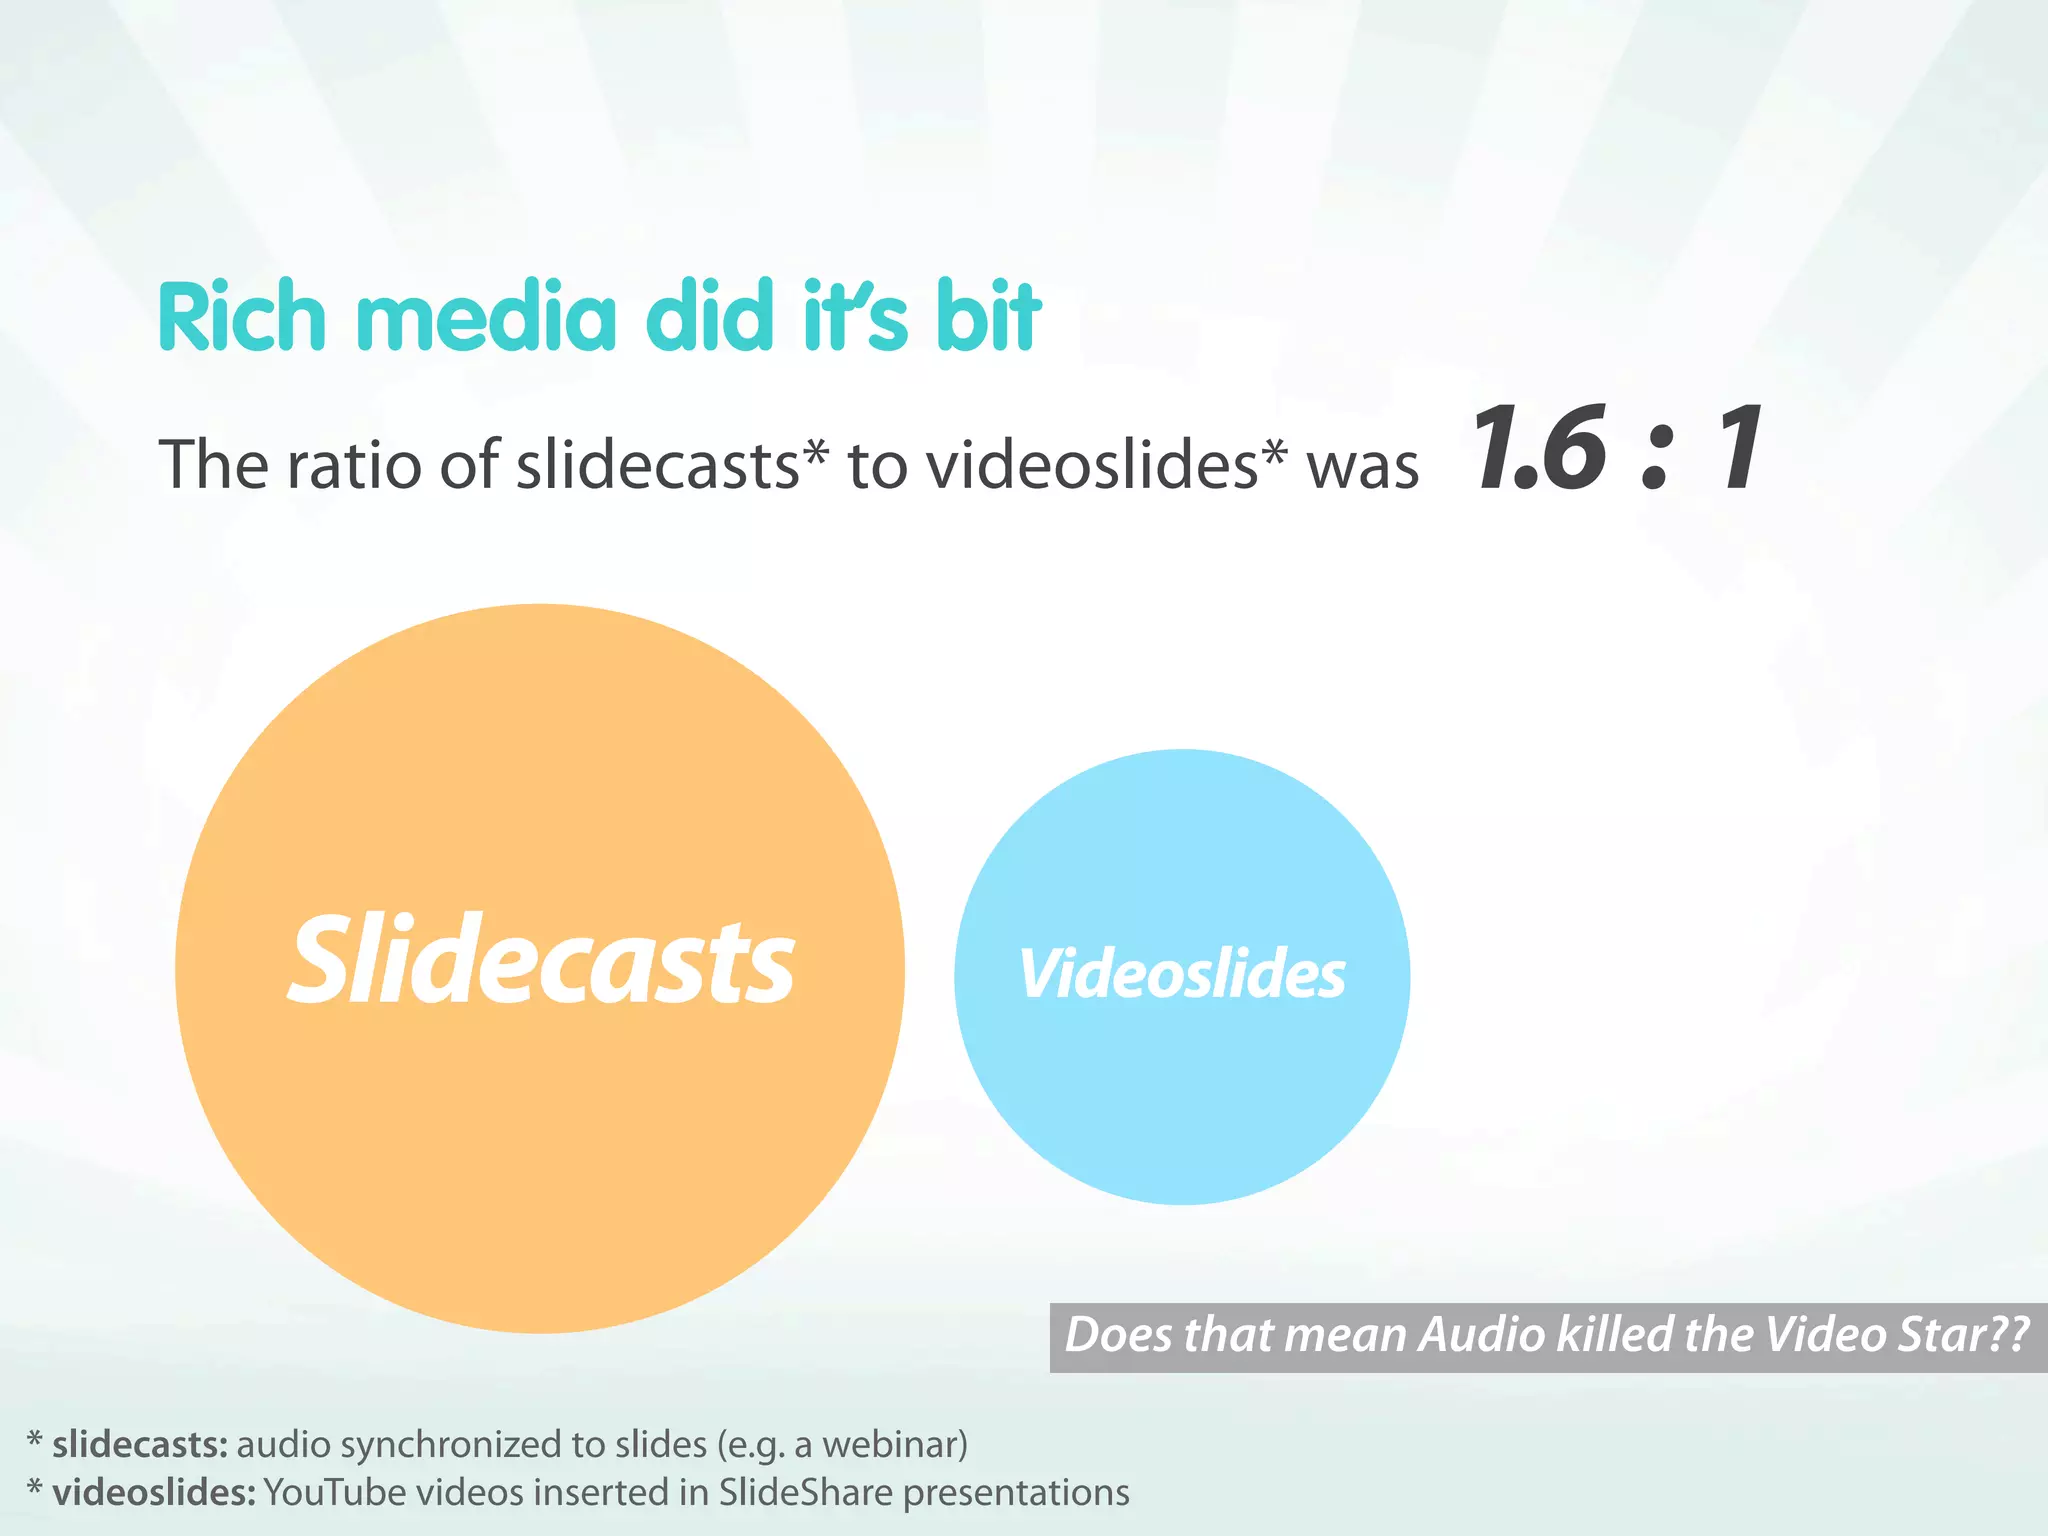
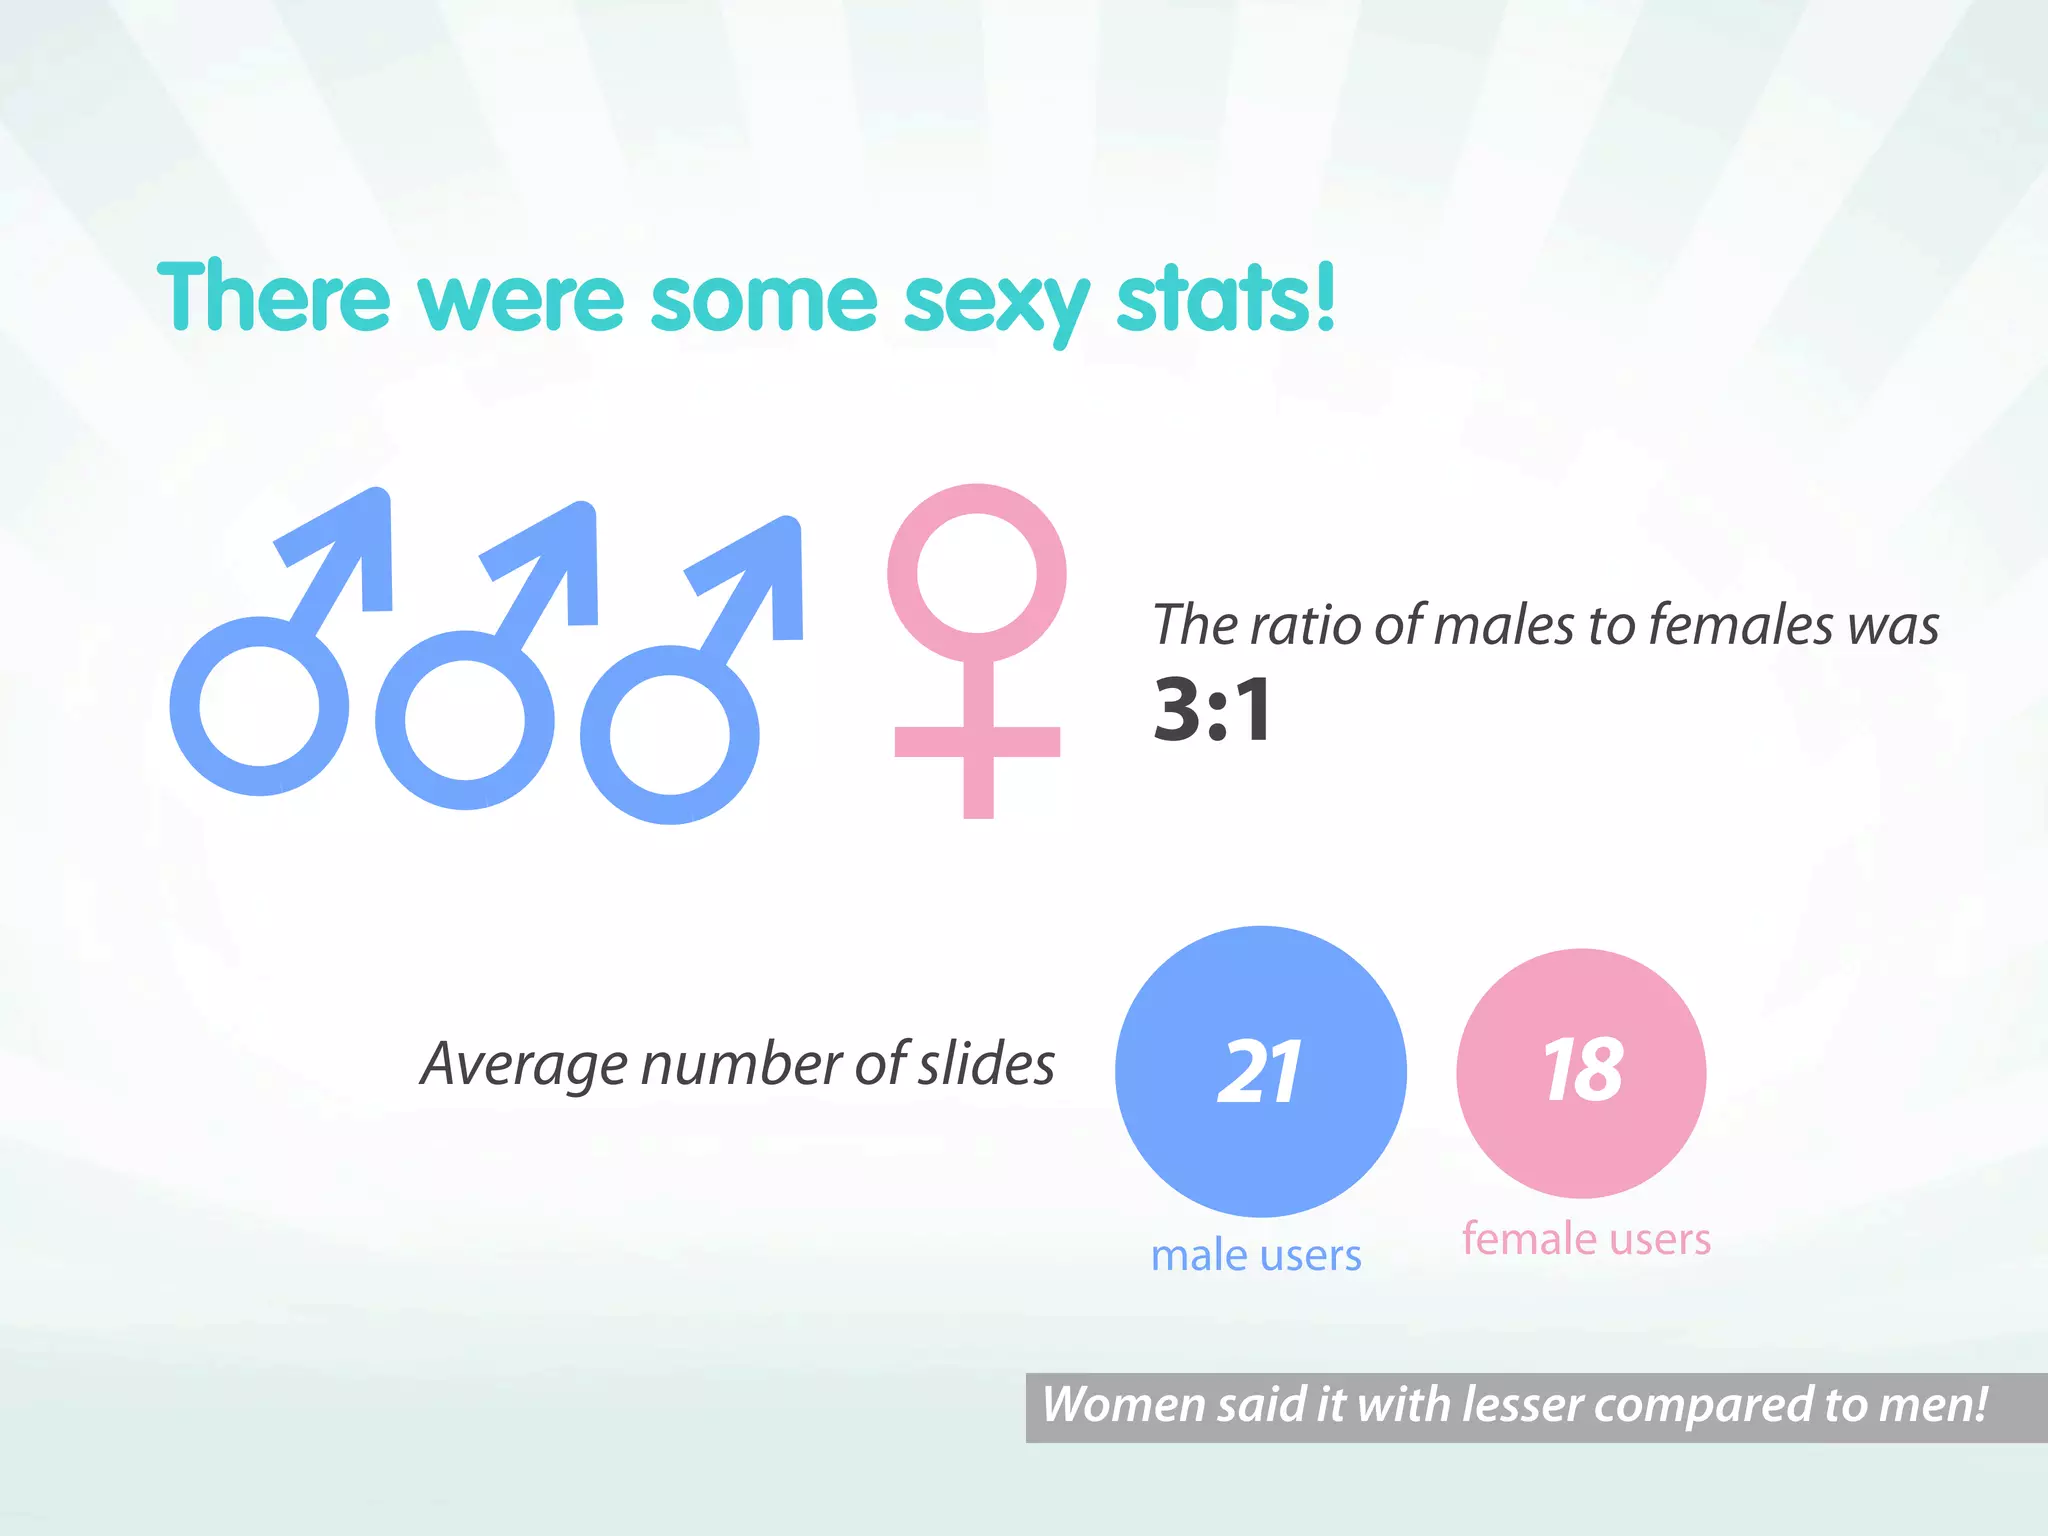


The document analyzes global presentation trends from the past year, highlighting statistics such as average slide counts and language usage. It emphasizes trends in presentation formats, popular themes, and gender distribution among users. Additionally, it notes the impact of visuals, with images being prevalent in presentations, and the document is shared under a Creative Commons license.