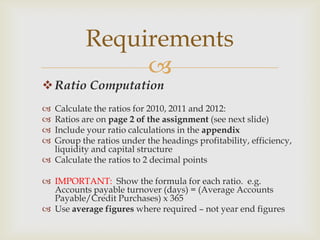
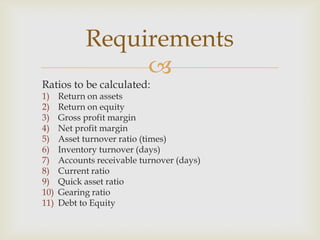
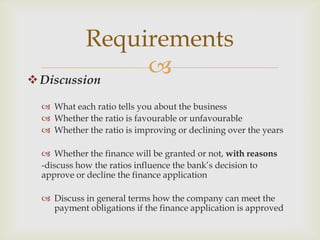
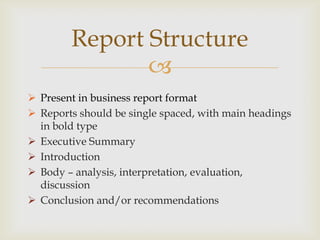
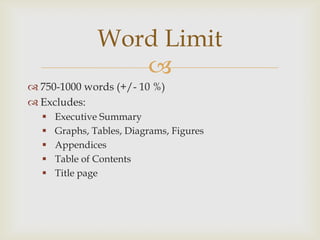
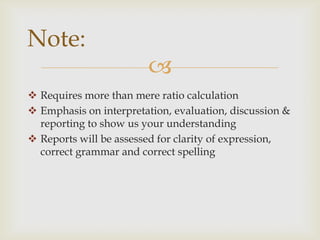
Collaborate Session
May 2014

 Due date: 9 am (AEST) Monday 19 May 2014
 Weighting: 25%
Assignment
Ratio Analysis

Ratio Computation
 Calculate the ratios for 2010, 2011 and 2012:
 Ratios are on page 2 of the assignment (see next slide)
 Include your ratio calculations in the appendix
 Group the ratios under the headings profitability, efficiency,
liquidity and capital structure
 Calculate the ratios to 2 decimal points
 IMPORTANT: Show the formula for each ratio. e.g.
Accounts payable turnover (days) = (Average Accounts
Payable/Credit Purchases) x 365
 Use average figures where required – not year end figures
Requirements

Ratios to be calculated:
1) Return on assets
2) Return on equity
3) Gross profit margin
4) Net profit margin
5) Asset turnover ratio (times)
6) Inventory turnover (days)
7) Accounts receivable turnover (days)
8) Current ratio
9) Quick asset ratio
10) Gearing ratio
11) Debt to Equity
Requirements
Discussion
 What each ratio tells you about the business
 Whether the ratio is favourable or unfavourable
 Whether the ratio is improving or declining over the years
 Whether the finance will be granted or not, with reasons
-discuss how the ratios influence the bank’s decision to
approve or decline the finance application
 Discuss in general terms how the company can meet the
payment obligations if the finance application is approved
Requirements

 Present in business report format
 Reports should be single spaced, with main headings
in bold type
 Executive Summary
 Introduction
 Body – analysis, interpretation, evaluation,
discussion
 Conclusion and/or recommendations
Report Structure

 750-1000 words (+/- 10 %)
 Excludes:
 Executive Summary
 Graphs, Tables, Diagrams, Figures
 Appendices
 Table of Contents
 Title page
Word Limit

 Follow submission requirements
 Word limit: 750 – 1000 words (+/- 10%)
 Make sure you read and follow all the instructions
carefully, for example:
 Swinburne now uses Turnitin to provide
personalised feedback and allows you to check the
originality of your assessments.
 Instructions on how to use this are found under the
Assessment tab, or copy this link into your browser.
To Avoid Penalties

 Requires more than mere ratio calculation
 Emphasis on interpretation, evaluation, discussion &
reporting to show us your understanding
 Reports will be assessed for clarity of expression,
correct grammar and correct spelling
Note:

 Concise - short sentences that get right to the point
 Headings and sub-headings – improve readability
 Tables, graphs – to visually present data & findings
 Selective underlining/highlighting for emphasis
 Follow the guidelines on the marking rubric and
stick to what is being asked. Include additional
information only if relevant.
Tips

SOME DETAILS ON RATIOS YOU ARE
REQUIRED TO COMPUTE
RATIOS

•This ratio indicates the amount of sales generated for
every dollar's worth of assets the business has.
•It is an indication of how efficiently the business is at
using its assets in generating sales or revenue – generally,
the higher the number the better.
Return on Assets

• The profit generated by the business expressed as a percentage of shareholders
equity.
• This ratio measures the businesses profitability - how much profit has been made
with the money shareholders have invested.
• Ordinary Share Capital = Issued Capital
• Retained Earnings = Reserves
• TIP – The average will be the average of the whole year ((so beginning balance
which is end balance from previous year + ending balance of the year) / 2 )
Return on Equity

• This ratio provides the percentage of total sales
revenue that the business retains after subtracting the
direct costs associated with producing the goods and
services sold by the business. The higher the
percentage, the more the business keeps for each dollar
of sales to service its other expenses and obligations.
Gross Profit Margin

• This ratio reveals the overall profitability of the business
(before interest and tax have been paid)
Net Profit Margin

• This efficiency ratio reveals how many times a year the business turns over its
assets – convert them into sales
• Note - this ratio is explained on p306 of your textbook, but not very clearly.
• It is different to the Asset TO Period which is Av Total Assets / Sales x 365
• We will provide a worked example in excel which shows the difference but
they work in reverse to each other – if assets increase the Asset TO Period
increases, and the Asset TO Times decreases
Asset Turnover Ratio
Times
Asset Turnover Times = Sales
Average Total Assets

• This ratio gives investors an idea of how long it takes
the business to turn its inventory (including goods that
are work in progress, if applicable) into sales. Generally,
the lower (shorter) the ratio the better, but it is
important to note that the average ratio varies from
one industry to another.
Inventory Turnover
Period

Accounts Receivable
Turnover (days)
• This ratio focuses on the time it takes for debtors to
pay their accounts. The ratio indicates whether
debtors are being allowed excessive credit. A high
figure (more than the industry average) may suggest
that you have problems with your debt collection
procedures or the financial position of major
customers. This ratio is important to businesses as
efficient and timely collection of customer debts is a
vital part of cash flow management.

Current Ratio
• The ratio is generally used to give an indication of
the businesses ability to pay back its short-term
liabilities (debt and payables) with its short-term
assets (cash, inventory, receivables).

• This ratio measures the businesses short-term liquidity.
• It tells you whether the business is able to meet its short-term
obligations using its most liquid assets. The higher the quick ratio,
the better the position of the business.
• This is a stronger measure of liquidity compared to the current
ratio as inventory can be harder to sell/convert to cash.
Quick Asset Ratio

• The gearing ratio looks at the financial leverage of the
business. It compares the proportion of equity vs. debt
that the business is using to finance its assets.
• A high ratio often indicates that the business has been
aggressive in financing growth via debt. This can be an
issue due to interest expenses, especially in volatile
economic times.
Gearing Ratio

Debt to Equity Ratio = Total Debt
Total Equity
• The debt-to-equity ratio looks at the financial leverage of
the business. It answers the questions, what proportion of
the businesses assets has been funded via debt?
• A high debt/equity ratio often indicates that the business
has been aggressive in financing growth via debt. This can
be an issue due to interest expenses, especially in volatile
economic times.
Debt to Equity Ratio

 Swinburne Guidance: Report Structure
 Marking guide (Rubric) – attached at the end of the
assignment
eLAs will use this to grade assignment
 Example report
Actual student report from previous period (different
scenario)
Additional resources

To Pass:
 Attempt at discussing performance
 Some reference to ratios
 Basic summary included
 Report format mostly followed
Marking Guide

For Distinction:
 Comprehensive discussion - show solid understanding of
concepts and ratios
 Good use of facts from company information to support
findings
 Correct report format
 Well written summary – clear and concise
 Concise clear writing style
 Excellent presentation – layout; use of graphs, etc.; easy to
read.
 Include additional info (relevant)
 Suggest other helpful information for more comprehensive
complete analysis
Marking Guide

To Fail:
 Inadequate discussion – merely describing results
 Limited explanation
 Little or no reference to ratios
Marking Guide

You can also post your questions on
Black board.
Good luck!
QUESTIONS?

Slbc100 assignment 1 ratio analysis - collaborate session - tp1 2014 (1)

  • 1.
  • 2.
      Due date:9 am (AEST) Monday 19 May 2014  Weighting: 25% Assignment Ratio Analysis
  • 3.
     Ratio Computation  Calculatethe ratios for 2010, 2011 and 2012:  Ratios are on page 2 of the assignment (see next slide)  Include your ratio calculations in the appendix  Group the ratios under the headings profitability, efficiency, liquidity and capital structure  Calculate the ratios to 2 decimal points  IMPORTANT: Show the formula for each ratio. e.g. Accounts payable turnover (days) = (Average Accounts Payable/Credit Purchases) x 365  Use average figures where required – not year end figures Requirements
  • 4.
     Ratios to becalculated: 1) Return on assets 2) Return on equity 3) Gross profit margin 4) Net profit margin 5) Asset turnover ratio (times) 6) Inventory turnover (days) 7) Accounts receivable turnover (days) 8) Current ratio 9) Quick asset ratio 10) Gearing ratio 11) Debt to Equity Requirements
  • 5.
    Discussion  What eachratio tells you about the business  Whether the ratio is favourable or unfavourable  Whether the ratio is improving or declining over the years  Whether the finance will be granted or not, with reasons -discuss how the ratios influence the bank’s decision to approve or decline the finance application  Discuss in general terms how the company can meet the payment obligations if the finance application is approved Requirements
  • 6.
      Present inbusiness report format  Reports should be single spaced, with main headings in bold type  Executive Summary  Introduction  Body – analysis, interpretation, evaluation, discussion  Conclusion and/or recommendations Report Structure
  • 7.
      750-1000 words(+/- 10 %)  Excludes:  Executive Summary  Graphs, Tables, Diagrams, Figures  Appendices  Table of Contents  Title page Word Limit
  • 8.
      Follow submissionrequirements  Word limit: 750 – 1000 words (+/- 10%)  Make sure you read and follow all the instructions carefully, for example:  Swinburne now uses Turnitin to provide personalised feedback and allows you to check the originality of your assessments.  Instructions on how to use this are found under the Assessment tab, or copy this link into your browser. To Avoid Penalties
  • 9.
      Requires morethan mere ratio calculation  Emphasis on interpretation, evaluation, discussion & reporting to show us your understanding  Reports will be assessed for clarity of expression, correct grammar and correct spelling Note:
  • 10.
      Concise -short sentences that get right to the point  Headings and sub-headings – improve readability  Tables, graphs – to visually present data & findings  Selective underlining/highlighting for emphasis  Follow the guidelines on the marking rubric and stick to what is being asked. Include additional information only if relevant. Tips
  • 11.
     SOME DETAILS ONRATIOS YOU ARE REQUIRED TO COMPUTE RATIOS
  • 12.
     •This ratio indicatesthe amount of sales generated for every dollar's worth of assets the business has. •It is an indication of how efficiently the business is at using its assets in generating sales or revenue – generally, the higher the number the better. Return on Assets
  • 13.
     • The profitgenerated by the business expressed as a percentage of shareholders equity. • This ratio measures the businesses profitability - how much profit has been made with the money shareholders have invested. • Ordinary Share Capital = Issued Capital • Retained Earnings = Reserves • TIP – The average will be the average of the whole year ((so beginning balance which is end balance from previous year + ending balance of the year) / 2 ) Return on Equity
  • 14.
     • This ratioprovides the percentage of total sales revenue that the business retains after subtracting the direct costs associated with producing the goods and services sold by the business. The higher the percentage, the more the business keeps for each dollar of sales to service its other expenses and obligations. Gross Profit Margin
  • 15.
     • This ratioreveals the overall profitability of the business (before interest and tax have been paid) Net Profit Margin
  • 16.
     • This efficiencyratio reveals how many times a year the business turns over its assets – convert them into sales • Note - this ratio is explained on p306 of your textbook, but not very clearly. • It is different to the Asset TO Period which is Av Total Assets / Sales x 365 • We will provide a worked example in excel which shows the difference but they work in reverse to each other – if assets increase the Asset TO Period increases, and the Asset TO Times decreases Asset Turnover Ratio Times Asset Turnover Times = Sales Average Total Assets
  • 17.
     • This ratiogives investors an idea of how long it takes the business to turn its inventory (including goods that are work in progress, if applicable) into sales. Generally, the lower (shorter) the ratio the better, but it is important to note that the average ratio varies from one industry to another. Inventory Turnover Period
  • 18.
     Accounts Receivable Turnover (days) •This ratio focuses on the time it takes for debtors to pay their accounts. The ratio indicates whether debtors are being allowed excessive credit. A high figure (more than the industry average) may suggest that you have problems with your debt collection procedures or the financial position of major customers. This ratio is important to businesses as efficient and timely collection of customer debts is a vital part of cash flow management.
  • 19.
     Current Ratio • Theratio is generally used to give an indication of the businesses ability to pay back its short-term liabilities (debt and payables) with its short-term assets (cash, inventory, receivables).
  • 20.
     • This ratiomeasures the businesses short-term liquidity. • It tells you whether the business is able to meet its short-term obligations using its most liquid assets. The higher the quick ratio, the better the position of the business. • This is a stronger measure of liquidity compared to the current ratio as inventory can be harder to sell/convert to cash. Quick Asset Ratio
  • 21.
     • The gearingratio looks at the financial leverage of the business. It compares the proportion of equity vs. debt that the business is using to finance its assets. • A high ratio often indicates that the business has been aggressive in financing growth via debt. This can be an issue due to interest expenses, especially in volatile economic times. Gearing Ratio
  • 22.
     Debt to EquityRatio = Total Debt Total Equity • The debt-to-equity ratio looks at the financial leverage of the business. It answers the questions, what proportion of the businesses assets has been funded via debt? • A high debt/equity ratio often indicates that the business has been aggressive in financing growth via debt. This can be an issue due to interest expenses, especially in volatile economic times. Debt to Equity Ratio
  • 23.
      Swinburne Guidance:Report Structure  Marking guide (Rubric) – attached at the end of the assignment eLAs will use this to grade assignment  Example report Actual student report from previous period (different scenario) Additional resources
  • 24.
     To Pass:  Attemptat discussing performance  Some reference to ratios  Basic summary included  Report format mostly followed Marking Guide
  • 25.
     For Distinction:  Comprehensivediscussion - show solid understanding of concepts and ratios  Good use of facts from company information to support findings  Correct report format  Well written summary – clear and concise  Concise clear writing style  Excellent presentation – layout; use of graphs, etc.; easy to read.  Include additional info (relevant)  Suggest other helpful information for more comprehensive complete analysis Marking Guide
  • 26.
     To Fail:  Inadequatediscussion – merely describing results  Limited explanation  Little or no reference to ratios Marking Guide
  • 27.
     You can alsopost your questions on Black board. Good luck! QUESTIONS?