Download to read offline
![International Research Journal of Engineering and Technology (IRJET) e-ISSN: 2395-0056
Volume: 10 Issue: 05 | May 2023 www.irjet.net p-ISSN: 2395-0072
© 2023, IRJET | Impact Factor value: 8.226 | ISO 9001:2008 Certified Journal | Page 1083
malignant melanomas. Lesions such as seborrheic keratosis
and angiomatosis make up the remaining 715 photos. In
addition to the images themselves, the collection contains
descriptive information aboutthem,suchasthepatient'sage
and gender, the anatomical location of the lesion, and the
diagnosis. In it, you will find examples of both benign and
malignant skin lesions. Below are the seven classes of skin
diseases present in the HAM 10000 dataset.
Moles or melanocytic nevi (nv),arebenignskingrowthsmade
up of melanocytes, which are epidermal cellsresponsiblefor
creating pigment.
Melanoma (mel) is the malignant skin cancer which occurs
because of the melanocytes that is the pigment-producing
cells of the epidermis.
Lesions that mimic seborrheic keratosis or solar lentigines,
which are benign skin growths, are known as keratosis-like
lesions (bkl).
Cancer of the basal cells of the epidermis, also known as
basal cell carcinoma (bcc), manifestsasa firm,pink,orpearly
white nodule on the skin.
Actinic keratoses (akiec) are the premalignant skin lesions
that, if untreated, can develop into squamouscell carcinoma.
They are typically brought on by prolonged sun exposure.
Blood vessel abnormalities such as angiomas,
angiokeratomas, and pyogenic granulomasarereferredto as
Vascular lesions (vas).
A benign skin growth known as a dermatofibroma (df)
typically presents as a tiny, hard bump.
Cancer of the epidermis or other melanocyte-containing
tissues, known as melanoma, begins in these cells. A black,
asymmetrical lesion on the skin is one possible
manifestation. Different layers of skin are affected byeach of
these blemish’s kinds.
Epidermis lesions such as melanocytic nevi and seborrheic
keratosis are more common than those caused by basal cell
and squamous cell carcinomas, which can affect both the
epidermis and the higher dermal layers. Skin's dermis and
subcutaneous tissue are not immune to melanoma's reach.
The affected skin layers might also be affected by the
location and severity of the lesion.
2. LITERATURE SURVEY
[1] Here the authors have used SVM as a machine learning
algorithm to focus on Melanoma and Carcinoma.Theauthors
of this paper aimed to create an automated system that can
assist dermatologists in determining whether a skin lesionis
benign or malignant, which is useful in the early detection of
Melanoma. They trained and tested their SVM-based
classification system on 1,032 skin lesion images in their
study and extracted relevant features from the images using
image processing techniques such as normalization,
segmentation, and featureextraction. The extracted features
were then used to train the SVM classifier, which achievedan
accuracy rate of 95.8%.
[2] In this paper the authors have investigated theefficacyof
different machine-learning algorithms for classifying skin
diseases using color and texture features extracted from
images. The authors gathered a collection of skin disease
images from various sources and preprocessed them to
extract color and texturefeatures.Theimagedatasetconsists
of Chronic Eczema, Lichen, and Plaque psoriasis images
captured with a digital camera and processed to extract Red,
Green, and Blue (RGB) color features and Gray Level Co-
occurrence Matrix (GLCM) texture features. To compare
classifier performance, different combinations of features
with four popular ML algorithms were considered. Linear
Discriminant Analysis (LDA) and Support Vector Machine
(SVM) had the highest classification accuracy of the four
algorithmstested.Thepaperconcludesthatmachinelearning
algorithms can be effective tools for classifying skin diseases
and that the algorithmchosen shouldbebasedonthespecific
features of the disease being diagnosed. The study's results
show that LDA performed better in binary and multi-class
scenarios using color feature-based classification, SVM
performed better for texture features in both binary and
multi-class classifiers, and LDA and SVM classifiers
performed better in binary and multi-class classification for
the combined feature.
[3] In this paper the authors did a literature review to
compare how different image-processing techniques can
detect and classify psoriasis diseases. The goal of theauthors
was to look at the current research in this area and compare
how well different methods work for finding and classifying
psoriasis from images ofskin.Thereviewfoundthatdifferent
image processing methods, such as texture analysis, feature
extraction,and machinelearning algorithms, havebeenused
to find and classify psoriasis. Texture analysis has been used
to look at how the skin of psoriasis lesions feels, and feature
extraction techniques have been used to pull out things like
color, shape, and texture from images of skin. Psoriasis has
been put into groups using machine learning algorithms like
support vector machines (SVMs), artificial neural networks
(ANNs), and random forests (RFs). The machine learning
algorithms have shown promise in correctly classifying
psoriasislesions, with SVMsbeingthemostusedalgorithmin
the literature.
[4] Here they offered an overview of the different techniques
and methods used to findandcategorize skin diseases. Using
Image Processing andclassificationtechniques,themaingoal
of this projectwastomakediagnosticsystemsmoreaccurate.
In the system that is being proposed, an image captured by a
camera is used as input. By using Contrast Enhancement and](https://image.slidesharecdn.com/irjet-v10i5169-230701092215-2354a56b/85/Skin-disease-detection-and-classification-using-different-segmentation-and-classification-techniques-2-320.jpg)
![International Research Journal of Engineering and Technology (IRJET) e-ISSN: 2395-0056
Volume: 10 Issue: 05 | May 2023 www.irjet.net p-ISSN: 2395-0072
© 2023, IRJET | Impact Factor value: 8.226 | ISO 9001:2008 Certified Journal | Page 1084
Grayscale Conversion, this image will be prepared for
segmentation. The Global Thresholding technique is used to
divide the image that has already been processed into
sections. This is how the real affected area is found. Using
Grey Level Co-occurrence Matrix, texture features like
Energy, Entropy, Contrast, and IDM (Inverse Difference
Moment) are taken from a segmented image. Image Quality
Assessment features are taken out, such as Mean Square
Error (MSE) and Peak Signal to Noise Ratio(PSNR).Usingthe
Decision tree technique,theextractedtexturefeatureswillbe
used to find skin diseases and classify them as melanoma,
leprosy, or eczema if they are found. This system uses
pictures of the skin taken by a camera to figure out if it is
healthy or not. If it isn't healthy, it is categorized as
Melanoma, Eczema, or Leprosy.
[5]Here the authors gaveamethodfordecidingwhetherskin
cancer in two different moles is benign or malignant. At first,
the dataset has images of two different kinds of moles that
are mixed. These images have already been changed so that
they can be used for classification. When the pre-processing
of the dataset is done, these images are sent to CNN models
like VGG16, VGG19, and Inception V3 to pull out the
characteristics. Lastly, these images are sent to different
machine-learning classifiers to figure out if the moles are
harmless or dangerous. The results show that the Inception
V3 model with the neural network classifier has the best
accuracy at 83.2%.
[6] In this work they have used features such as entropy,
variance, and maximum histogram value of Hue-Saturation-
Value (HSV). These characteristics are used to construct a
machine learning algorithm using Decision Tree (DT) and
Support Vector Machine (SVM). Accuracy is used to evaluate
the proposed algorithm's performance. The first phase
includes image processing for skin disease detection,andthe
secondphaseincludesamachine-learningalgorithm.Because
of changes in the skin's characteristic features such as color
and texture, it is difficult to diagnose skin disease in the
primary and other stages. SVM color features produce 8%
better results. As a result, the decision tree produces better
results. The color of various skin diseases is nearly identical.
It makes classification difficult. As a result, texture features
produce better results.
[7] Here they have thoroughly examined how texture-based
feature extraction can be used to find skin diseases and
suggest a system based on what they found. In this paper,
they worked on texture-based features derived from the
GLCM matrix that are used to find skin diseases is discussed
and consolidated. Most of the work is done to find skin
cancer, but some of the works also look at other diseases like
psoriasis, warts, moles, and eczema. Classifiers like neural
networks and SVM decidewhether an image showsadisease
or not. Most of theresearchshowsanoverallaccuracyof90%
or higher. Contrast, Correlation, Energy, Entropy, and
Homogeneity are the top five features used in all this work.
3. METHODOLOGY
In the proposed system we start with the basic image
processing techniques with a smaller dataset andthenas we
move ahead, we work on multiple images and proceed
towards the exploration of segmentation techniques.
Thereafter we have worked on the complete HAM10000
dataset, using different ML techniques. Furthermore, to
increase the efficiency of the model CNN was used and
finalized.
3.1 Basic Thresholding
The first algorithm developed by us is basic thresholding.
This type of thresholding technique is based on pixel
intensities, if the pixel intensity is greater than the specified
threshold it would be considered as one or vice versa. Thus,
converted into binary image. It is one of the basic algorithms
used to detect whether the skin disease is presentornot.For
this thresholding algorithm,weuploadedtheimagefrom our
dataset in the model and a basic classification of the image
(disease detected or disease not detected) was done.
Initially, the image is passed through gaussian filter so that
other insignificant parts would become blur and then the
thresholding algorithm was applied on basis of term
percentage.
3.2 Entropy based thresholding
In Entropy based thresholding algorithm, the optimum
thresholding value is acquired using the maximum entropy
plotted on the histogram and by choosing that respective
pixel intensity and applying the thresholding techniqueonit
and acquiring the results.
In Entropy based thresholding, a histogram is plotted to
obtain the frequency of gray levels in an image and then
cumulative sum of the histogram was obtained and is
normalized. After that, initialization of threshold value and
maximum entropy is done, and the model is made to iterate
through all the possible values where probabilities of two
parts were been calculated. Then, the maximum entropy of
two parts was calculated by applying the equations:
entropy1 = -p1 * np.log2(p1) if p1 > 0 else 0 …3.2.1
entropy2 = -p2 * np.log2(p2) if p2 > 0 else 0 …3.2.2
After taking into consideration,thetotal entropyobtainedby
adding both the results of above equations.
The parameters were updated i.e., threshold value and
maximum entropy based on current entropy. While
implementing it, If the current entropy is higher than the
parameters mentioned, then the entropy would be updated
or vice versa. And finally, thethresholdingwasperformed on
the image and the desired results were obtained.](https://image.slidesharecdn.com/irjet-v10i5169-230701092215-2354a56b/85/Skin-disease-detection-and-classification-using-different-segmentation-and-classification-techniques-3-320.jpg)
![International Research Journal of Engineering and Technology (IRJET) e-ISSN: 2395-0056
Volume: 10 Issue: 05 | May 2023 www.irjet.net p-ISSN: 2395-0072
© 2023, IRJET | Impact Factor value: 8.226 | ISO 9001:2008 Certified Journal | Page 1087
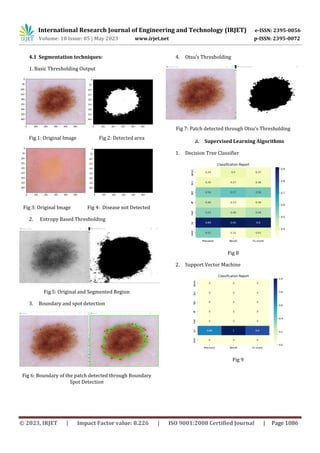
3. Random Forest Classifier
Fig 10
In Supervised Machine learning algorithms, we classified
using Decision trees, Support Vector Machine, Random
Forest and got maximum accuracies of 77.7%, 67%, 79.3%
respectively. But due to low accuracies, overfitting and due
to high biasness of the model led us to move further to deep
learning.
b. Convolution Neural Network
Fig 11
As per the studies, we found out that the ConvolutionNeural
Network was the best suitable technique for the
classification of diseases. Due to high computation capacity
and the ability to classify a huge dataset, this model proved
to be better than the other classification techniques that
were used above. It also overcame the drawback of
overfitting, and can classify new and unseen data while
maintaining a high accuracy of 82%.
3. CONCLUSIONS
Using the HAM 10000 dataset, a comparison of multiple
algorithms has been carried out in order to detect skin
conditions and for the classificationofskinconditions.When
we began the research with fundamental image processing
methods, we obtained the highest possible accuracy of 75%.
However, when we movedontoclassificationalgorithms,we
obtained the highest possible accuracy of 97% in both the
decision tree and the random forest. On the other hand,
because of the problems associated with overfitting and the
model becoming biased, we decidedtomoveontothe neural
network. Convolutionneural network appearstobethemost
effective algorithm for the classificationofimages,according
to our findings. We found that it was accurate 82% of the
time, and it enabled us to verify that it workedappropriately
with random data as well. Additionally, it assisted us in
attaining a greater degree of precision.
4. REFERENCES
[1].Kumar, N. V., Kumar, P. V., Pramodh, K., & Karuna, Y.
(2019, March). Classification of Skin diseases using Image
processing and SVM. In 2019 International Conference on
Vision Towards Emerging Trends in Communication and
Networking (ViTECoN) (pp. 1-5). IEEE.
[2]. Hegde, P. R., Shenoy, M. M., & Shekar, B. H. (2018,
September). Comparison of machine learningalgorithms for
skin disease classificationusingcolorandtexturefeatures.In
2018 International Conference on Advances in Computing,
Communications, andInformatics(ICACCI)(pp.1825-1828).
IEEE
[3]. Vincent, L., & Jayasingh, J. R. (2022, April). Comparison
of Psoriasis Disease Detection and Classification Through
Various Image ProcessingTechniques-AReview.In2022 6th
International Conference on Devices, Circuits and Systems
(ICDCS) (pp. 122-124). IEEE.
[4]. Pugazhenthi, V., Naik, S. K., Joshi, A. D., Manerkar, S. S.,
Nagvekar, V. U., Naik, K. P., ... & Sagar, K. (2019). Skin disease
detection and classification. International Journal of
Advanced Engineering Research and Science (IJAERS), 6(5),
396-400.
[5]. Gupta, S., Panwar, A., & Mishra, K. (2021, July). Skin
disease classification using dermoscopy images through
deep feature learning models and machine learning
classifiers. In IEEE EUROCON 2021-19th International
Conference on Smart Technologies (pp. 170-174). IEEE.
[6]. Swamy, K. V., & Divya, B. (2021, December).SkinDisease
Classification using Machine Learning Algorithms. In 2021
2ndInternational ConferenceonCommunication,Computing
and Industry 4.0 (C2I4) (pp. 1-5). IEEE.
[7]. Kolkur, S., & Kalbande, D. R. (2016,November).Survey of
texture-based feature extraction for skin disease detection.
In 2016 International Conference on ICT in Business
Industry & Government (ICTBIG) (pp. 1-6). IEEE.](https://image.slidesharecdn.com/irjet-v10i5169-230701092215-2354a56b/85/Skin-disease-detection-and-classification-using-different-segmentation-and-classification-techniques-6-320.jpg)

This document presents a study on using different image segmentation and classification techniques to detect and classify skin diseases. It explores region-based segmentation, thresholding, boundary detection, and entropy-based segmentation techniques. It also uses machine learning classifiers like support vector machines, decision trees, and random forests to classify diseases. The document evaluates these techniques on the HAM10000 public skin lesion dataset, which contains images of lesions from seven classes of diseases. The goal is to improve diagnostic accuracy by applying image processing and machine learning methods.