BREEZE LFG Fire/Risk from Trinity Consultants combines SOURCE5, DEGADIS and LNGFIRE3 into one package, allowing the analyst to efficiently simulate a broad set of potential hazards associated with LNG process operations.
Subsystem Squeak & Rattle Analysis Using Altair’s Squeak and Rattle Director...Altair
LOGEengine is an integrated simulation method for the prediction and optimization of engine in-cylinder performance parameters and studies of fuel effects on exhaust emissions. It contains a stochastic reactor model for 0D modelling (0d-SRM) with local effects in gas-phase space, direct fuel injection, temperature and species concentrations as random variables, detailed chemical kinetics, prediction of engine exhaust emissions (Soot, NOx, uHC), turbulence consideration via mixing modeling and self-calibration. LOGEengine can also model soot formation for diesel engines using detailed kinetic soot models, with gas phase chemistry, soot particle inception, condensation, coagulation, surface growth and oxidation. It can run equivalence ratio - Temperature (f-T ) diagnostics maps for analysis of regimes of emission formation in diesel engines using zero-dimensional methods with low CPU cost. It analyses local inhomogeneities in gas-phase space for species concentration and temperature due to mixing, fuel injection and heat transfer to cylinder walls, and their influence on soot and NOx formation from different fuels and in individual combustion cycles.
Comparative Economic Analysis of Using Natural Gas For Liquefied Natural Gas ...IJRES Journal
Comparative economic analysis of the production of diesel through Gas-to-Liquid (GTL) Technology and the production of Liquefied Natural Gas (LNG) both using natural gas was presented. The data for costs of constructing and running GTL and LNG plants were obtained for the study. Plant procurement costs, shipping and tanker facilities costs, the expected capacities of the GTL and LNG plants and the feed gas volume needed to produce those capacities of liquid products were gathered with which the costs analyses and revenue analyses were conducted. Two assumptions made were that the diesel would be the only product of the GTL project and LNG, the only product of the LNG plant. The 33000bbl/day of liquid product from the GTL plant was taken to be all diesel while the 5mmtpa of NGL got from the LNG plant was ignored. The 33000bbl/day of diesel and 22mmtpa of LNG were then used for the analyses. Concentration was on the profit indicators used to evaluate the advantage of one over the other. Figures were used to determine the pay-out of the projects which is 9.16years for GTL and 1.97years for LNG respectively. The Net Present Value (NPV) and Profit per Dollar Invested (P/$) that make up the project economics were estimated for GTL and LNG. The NPV over 15years and at an expected rate of return of 10% was $2.11billion for GTL and $45.17billion for LNG. For GTL, the P/$ was 2.02 and for LNG, it was 6.62. From the whole analysis done it is easily seen that the LNG project is more economically viable than the GTL project since the LNG project has higher NPV, lower pay-out and higher P/$ than the GTL project.
Evaluating AERMOD and Wind Tunnel Derived Equivalent Building DimensionsSergio A. Guerra
While the current EBD method is the best available option to determine correct building dimensions in the model, a different method was suggested by EPA in the 2011 Memo: Model Clearinghouse Review of EBD for AERMOD.9 Attachment B to the 2011 Memo includes an assessment of the Alcoa Davenport Works EBD Study. In this evaluation EPA compared wind tunnel observations with AERMOD derived concentrations. However, this evaluation has important shortcomings. First, to carry out this comparison between wind tunnel and AERMOD concentrations, it is necessary to collect velocity profiles that include longitudinal and vertical turbulent intensity measurements upwind of the stack. These data were not available for the EPA evaluation of the Alcoa Davenport Works EBD Study. Second, the wind tunnel model operating conditions were converted to full scale conditions by using exact similarity. However, exact similarity is not used to specify model operating conditions since only momentum ratios are matched but not buoyancy ones. Whereas EPA did not provide important details on how this study was performed, this paper outlines how to properly carry out this new method where AERMOD is used to determine equivalent building dimensions. The viability of this new method was also evaluated and discussed.
Use of Wind Tunnel Refinements in the Dispersion Modeling Analysis of the Ala...Sergio A. Guerra
The proposed Alaska LNG GTP project includes the construction of a natural gas treatment plant on the Alaska North Slope. The Gas Treatment Plant (GTP) is proposed to be located on the west coast of Prudhoe Bay and would treat natural gas produced on the North Slope.
Initial dispersion modeling of the Alaska LNG Gas Treatment Plant (GTP) found results inconsistent with local and regional measurements when evaluating compliance with the 1-hour NO2 National Ambient Air Quality Standard (NAAQS) due in part to two adjacent nearby sources. These existing sources include the Central Gas Facility (CGF) and Central Compression Plant (CCP) located immediately east of the GTP. The prevailing winds at the site are east-northeast and west-southwest which align with the arrangement of the facilities.
The building downwash inputs generated by the Building Profile Input Program for PRIME (BPIPPRM) were evaluated for the CGF and CCP facilities. This analysis confirmed that the building dimension inputs for numerous wind directions were outside of the tested theory used to develop the building downwash algorithms in AERMOD. Previous studies2,8,11,12,13 suggest that AERMOD predictions are biased to overstate downwash effects for certain building input ratios.
Wind tunnel determined equivalent building dimensions (EBD) were conducted for the most critical stacks and wind directions to refine AERMOD-derived predicted concentrations. The current paper covers the EBD method used to refine the building inputs for the CGF and CCP facilities. The regulatory process and benefits from this physical modeling method is also discussed.
Probabilistic & Source Characterization Techniques in AERMOD ComplianceSergio A. Guerra
The short term NAAQS are more stringent and traditional techniques are not suitable anymore. The probabilistic nature of these standards also opens the door to modeling techniques based on probability. Source characterization studies can also be used to refine AERMOD’s inputs to be more accurate and achieve reductions of more than half. This presentation will cover these compliance methods.
Currently, it is assumed that a given emission unit is in operation at its maximum capacity every hour of the year. However, assuming constant maximum emissions is overly conservative for facilities such as power plants that are not in operation all the time at full load. A better approach is the use of the Monte Carlo technique to account for emission variability. Another conservative assumption in NAAQS modeling relates to combining predicted concentrations from AERMOD with maximum or design concentrations from the monitor. A more reasonable approach is to combine the 50th percentile background concentration with AERMOD values.
The inputs to AERMOD can be obtained by more accurate source characterization studies. Such is the case of building dimensions commonly calculated with BPIP. These dimensions tend to overstate the wake effects and produce significantly higher concentrations especially for lattice structures, elongated buildings, and streamlined structures. An Equivalent Building Dimensions (EBD) study can be used to inform AERMOD with more accurate downwash characteristics.
Presentation given at CARIBIC workshop at Lufthansa Training & Conference Center Seeheim (Germany), October 2011.
This material is now online as a discussion paper in ACPD, that can be found on http://www.atmos-chem-phys-discuss.net/12/589/2012/acpd-12-589-2012.html
Extended Primary Care Access in Southwark Nuffield Trust
Dr Lauren Parry, Improving Health; Rebecca Dallmeyer, Quay Health Solutions and Hayley Sloan, NHS Southwark CCG present on their Extended Primary Care Access programme.
With increasing pollution worldwide, the emission standards for diesel engines has become more stringent. The Euro 6 limits the NOxemission from diesel engine to 0.08 g Km. The current paper presents the various analysis method of EGR cooler operating under different conditions. The primary causes of EGR failures i.e. fouling is also studied by various scholars. The numerical method CFD encompassing 1D geometry and experimental techniques of evaluating EGR cooler is also studied. The effect of geometry, material and operating conditions on performance of EGR cooler are investigated by various scholars and the results obtained by such tests are also presented. Dwarika Sahu | Dr. S. S. K. Deepak "Review on Numerical Analysis of EGR Cooler" Published in International Journal of Trend in Scientific Research and Development (ijtsrd), ISSN: 2456-6470, Volume-4 | Issue-6 , October 2020, URL: https://www.ijtsrd.com/papers/ijtsrd33570.pdf Paper Url: https://www.ijtsrd.com/engineering/mechanical-engineering/33570/review-on-numerical-analysis-of-egr-cooler/dwarika-sahu
The existence of countless proprietary file formats and the exchange of 3D CAD data has been a significant problem since the beginning of 3D CAD modeling. CAD applications and methods using digital data are constantly changing, which predicates the need for a solution to share validated and accurately translated data, thus the birth of STEP242
Willie Nelson Net Worth: A Journey Through Music, Movies, and Business Venturesgreendigital
Willie Nelson is a name that resonates within the world of music and entertainment. Known for his unique voice, and masterful guitar skills. and an extraordinary career spanning several decades. Nelson has become a legend in the country music scene. But, his influence extends far beyond the realm of music. with ventures in acting, writing, activism, and business. This comprehensive article delves into Willie Nelson net worth. exploring the various facets of his career that have contributed to his large fortune.
Follow us on: Pinterest
Introduction
Willie Nelson net worth is a testament to his enduring influence and success in many fields. Born on April 29, 1933, in Abbott, Texas. Nelson's journey from a humble beginning to becoming one of the most iconic figures in American music is nothing short of inspirational. His net worth, which estimated to be around $25 million as of 2024. reflects a career that is as diverse as it is prolific.
Early Life and Musical Beginnings
Humble Origins
Willie Hugh Nelson was born during the Great Depression. a time of significant economic hardship in the United States. Raised by his grandparents. Nelson found solace and inspiration in music from an early age. His grandmother taught him to play the guitar. setting the stage for what would become an illustrious career.
First Steps in Music
Nelson's initial foray into the music industry was fraught with challenges. He moved to Nashville, Tennessee, to pursue his dreams, but success did not come . Working as a songwriter, Nelson penned hits for other artists. which helped him gain a foothold in the competitive music scene. His songwriting skills contributed to his early earnings. laying the foundation for his net worth.
Rise to Stardom
Breakthrough Albums
The 1970s marked a turning point in Willie Nelson's career. His albums "Shotgun Willie" (1973), "Red Headed Stranger" (1975). and "Stardust" (1978) received critical acclaim and commercial success. These albums not only solidified his position in the country music genre. but also introduced his music to a broader audience. The success of these albums played a crucial role in boosting Willie Nelson net worth.
Iconic Songs
Willie Nelson net worth is also attributed to his extensive catalog of hit songs. Tracks like "Blue Eyes Crying in the Rain," "On the Road Again," and "Always on My Mind" have become timeless classics. These songs have not only earned Nelson large royalties but have also ensured his continued relevance in the music industry.
Acting and Film Career
Hollywood Ventures
In addition to his music career, Willie Nelson has also made a mark in Hollywood. His distinctive personality and on-screen presence have landed him roles in several films and television shows. Notable appearances include roles in "The Electric Horseman" (1979), "Honeysuckle Rose" (1980), and "Barbarosa" (1982). These acting gigs have added a significant amount to Willie Nelson net worth.
Television Appearances
Nelson's char
Micro RNA genes and their likely influence in rice (Oryza sativa L.) dynamic ...Open Access Research Paper
Micro RNAs (miRNAs) are small non-coding RNAs molecules having approximately 18-25 nucleotides, they are present in both plants and animals genomes. MiRNAs have diverse spatial expression patterns and regulate various developmental metabolisms, stress responses and other physiological processes. The dynamic gene expression playing major roles in phenotypic differences in organisms are believed to be controlled by miRNAs. Mutations in regions of regulatory factors, such as miRNA genes or transcription factors (TF) necessitated by dynamic environmental factors or pathogen infections, have tremendous effects on structure and expression of genes. The resultant novel gene products presents potential explanations for constant evolving desirable traits that have long been bred using conventional means, biotechnology or genetic engineering. Rice grain quality, yield, disease tolerance, climate-resilience and palatability properties are not exceptional to miRN Asmutations effects. There are new insights courtesy of high-throughput sequencing and improved proteomic techniques that organisms’ complexity and adaptations are highly contributed by miRNAs containing regulatory networks. This article aims to expound on how rice miRNAs could be driving evolution of traits and highlight the latest miRNA research progress. Moreover, the review accentuates miRNAs grey areas to be addressed and gives recommendations for further studies.
Diabetes is a rapidly and serious health problem in Pakistan. This chronic condition is associated with serious long-term complications, including higher risk of heart disease and stroke. Aggressive treatment of hypertension and hyperlipideamia can result in a substantial reduction in cardiovascular events in patients with diabetes 1. Consequently pharmacist-led diabetes cardiovascular risk (DCVR) clinics have been established in both primary and secondary care sites in NHS Lothian during the past five years. An audit of the pharmaceutical care delivery at the clinics was conducted in order to evaluate practice and to standardize the pharmacists’ documentation of outcomes. Pharmaceutical care issues (PCI) and patient details were collected both prospectively and retrospectively from three DCVR clinics. The PCI`s were categorized according to a triangularised system consisting of multiple categories. These were ‘checks’, ‘changes’ (‘change in drug therapy process’ and ‘change in drug therapy’), ‘drug therapy problems’ and ‘quality assurance descriptors’ (‘timer perspective’ and ‘degree of change’). A verified medication assessment tool (MAT) for patients with chronic cardiovascular disease was applied to the patients from one of the clinics. The tool was used to quantify PCI`s and pharmacist actions that were centered on implementing or enforcing clinical guideline standards. A database was developed to be used as an assessment tool and to standardize the documentation of achievement of outcomes. Feedback on the audit of the pharmaceutical care delivery and the database was received from the DCVR clinic pharmacist at a focus group meeting.
"Understanding the Carbon Cycle: Processes, Human Impacts, and Strategies for...MMariSelvam4
The carbon cycle is a critical component of Earth's environmental system, governing the movement and transformation of carbon through various reservoirs, including the atmosphere, oceans, soil, and living organisms. This complex cycle involves several key processes such as photosynthesis, respiration, decomposition, and carbon sequestration, each contributing to the regulation of carbon levels on the planet.
Human activities, particularly fossil fuel combustion and deforestation, have significantly altered the natural carbon cycle, leading to increased atmospheric carbon dioxide concentrations and driving climate change. Understanding the intricacies of the carbon cycle is essential for assessing the impacts of these changes and developing effective mitigation strategies.
By studying the carbon cycle, scientists can identify carbon sources and sinks, measure carbon fluxes, and predict future trends. This knowledge is crucial for crafting policies aimed at reducing carbon emissions, enhancing carbon storage, and promoting sustainable practices. The carbon cycle's interplay with climate systems, ecosystems, and human activities underscores its importance in maintaining a stable and healthy planet.
In-depth exploration of the carbon cycle reveals the delicate balance required to sustain life and the urgent need to address anthropogenic influences. Through research, education, and policy, we can work towards restoring equilibrium in the carbon cycle and ensuring a sustainable future for generations to come.
UNDERSTANDING WHAT GREEN WASHING IS!.pdfJulietMogola
Many companies today use green washing to lure the public into thinking they are conserving the environment but in real sense they are doing more harm. There have been such several cases from very big companies here in Kenya and also globally. This ranges from various sectors from manufacturing and goes to consumer products. Educating people on greenwashing will enable people to make better choices based on their analysis and not on what they see on marketing sites.
Natural farming @ Dr. Siddhartha S. Jena.pptxsidjena70
A brief about organic farming/ Natural farming/ Zero budget natural farming/ Subash Palekar Natural farming which keeps us and environment safe and healthy. Next gen Agricultural practices of chemical free farming.
Characterization and the Kinetics of drying at the drying oven and with micro...Open Access Research Paper
The objective of this work is to contribute to valorization de Nephelium lappaceum by the characterization of kinetics of drying of seeds of Nephelium lappaceum. The seeds were dehydrated until a constant mass respectively in a drying oven and a microwawe oven. The temperatures and the powers of drying are respectively: 50, 60 and 70°C and 140, 280 and 420 W. The results show that the curves of drying of seeds of Nephelium lappaceum do not present a phase of constant kinetics. The coefficients of diffusion vary between 2.09.10-8 to 2.98. 10-8m-2/s in the interval of 50°C at 70°C and between 4.83×10-07 at 9.04×10-07 m-8/s for the powers going of 140 W with 420 W the relation between Arrhenius and a value of energy of activation of 16.49 kJ. mol-1 expressed the effect of the temperature on effective diffusivity.
Artificial Reefs by Kuddle Life Foundation - May 2024punit537210
Situated in Pondicherry, India, Kuddle Life Foundation is a charitable, non-profit and non-governmental organization (NGO) dedicated to improving the living standards of coastal communities and simultaneously placing a strong emphasis on the protection of marine ecosystems.
One of the key areas we work in is Artificial Reefs. This presentation captures our journey so far and our learnings. We hope you get as excited about marine conservation and artificial reefs as we are.
Please visit our website: https://kuddlelife.org
Our Instagram channel:
@kuddlelifefoundation
Our Linkedin Page:
https://www.linkedin.com/company/kuddlelifefoundation/
and write to us if you have any questions:
info@kuddlelife.org
Siting and Safe Operation of Liquefied Natural Gas Facilities
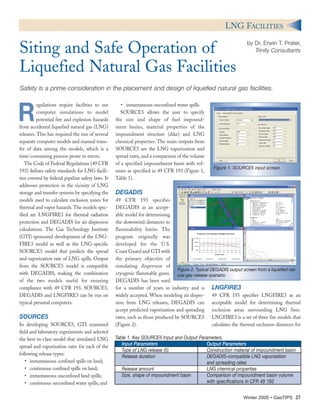
1. R
egulations require facilities to use
computer simulations to model
potential fire and explosion hazards
from accidental liquefied natural gas (LNG)
releases. This has required the run of several
separate computer models and manual trans-
fer of data among the models, which is a
time-consuming process prone to errors.
The Code of Federal Regulations (49 CFR
193) defines safety standards for LNG facili-
ties covered by federal pipeline safety laws. It
addresses protection in the vicinity of LNG
storage and transfer systems by specifying the
models used to calculate exclusion zones for
thermal and vapor hazards. The models spec-
ified are LNGFIRE3 for thermal radiation
protection and DEGADIS for air dispersion
calculations. The Gas Technology Institute
(GTI) sponsored development of the LNG-
FIRE3 model as well as the LNG-specific
SOURCE5 model that predicts the spread
and vaporization rate of LNG spills. Output
from the SOURCE5 model is compatible
with DEGADIS, making the combination
of the two models useful for ensuring
compliance with 49 CFR 193. SOURCE5,
DEGADIS and LNGFIRE3 can be run on
typical personal computers.
SOURCE5
In developing SOURCE5, GTI examined
field and laboratory experiments and selected
the best-in-class model that simulated LNG
spread and vaporization rates for each of the
following release types:
• instantaneous confined spills on land;
• continuous confined spills on land;
• instantaneous unconfined land spills;
• continuous unconfined water spills; and
• instantaneous unconfined water spills.
SOURCE5 allows the user to specify
the size and shape of fuel impound-
ment basins, material properties of the
impoundment structure (dike) and LNG
chemical properties. The main outputs from
SOURCE5 are the LNG vaporization and
spread rates, and a comparison of the volume
of a specified impoundment basin with vol-
umes as specified in 49 CFR 193 (Figure 1,
Table 1).
DEGADIS
49 CFR 193 specifies
DEGADIS as an accept-
able model for determining
the downwind distances to
flammability limits. The
program originally was
developed for the U.S.
Coast Guard and GTI with
the primary objective of
simulating dispersion of
cryogenic flammable gases.
DEGADIS has been used
for a number of years in industry and is
widely accepted. When modeling air disper-
sion from LNG releases, DEGADIS can
accept predicted vaporization and spreading
rates, such as those produced by SOURCE5
(Figure 2).
LNGFIRE3
49 CFR 193 specifies LNGFIRE3 as an
acceptable model for determining thermal
exclusion areas surrounding LNG fires.
LNGFIRE3 is a set of three fire models that
calculates the thermal exclusion distances for
Winter 2005 • GasTIPS 27
LNG FACILITIES
by Dr. Erwin T. Prater,
Trinity ConsultantsSiting and Safe Operation of
Liquefied Natural Gas Facilities
Safety is a prime consideration in the placement and design of liquefied natural gas facilities.
Figure 1. SOURCE5 input screen.
Figure 2. Typical DEGADIS output screen from a liquefied nat-
ural gas release scenario.
Table 1. Key SOURCE5 Input and Output Parameters.
Input Parameters Output Parameters
Type of LNG release (5) Construction material of impoundment basin
Release duration DEGADIS-compatible LNG vaporization
and spreading rates
Release amount LNG chemical properties
Size, shape of impoundment basin Comparison of impoundment basin volume
with specifications in CFR 49 193
2. unconfined pool fires, confined pool fires and
jet fires (Figure 3). It calculates radiant flux
levels at user-defined points downwind of
an LNG fire. Meteorological information,
including wind speed, wind direction and
humidity as well as parameters that describe
the LNG release are specified through a series
of input screens. The model for pool fires
simulates flame as a cylinder or a paral-
lelepiped, depending upon the geometry
of the impoundment areas. Wind-induced
flame drag and tilt also are accounted for in
the models.
An integrated approach
The commercial product BREEZE LFG
Fire/Risk from Trinity Consultants combines
SOURCE5, DEGADIS and LNGFIRE3
into one package, allowing the analyst to effi-
ciently simulate a broad set of potential haz-
ards associated with LNG process operations
(Table 2). The product also contains an addi-
tional U.S.Environmental Protection Agency-
approved model for simulating the exclusion
distance for boiling liquid expanding vapor
explosions. Input parameters are shared
among the programs, eliminating redundant
data entry while saving time and increasing
efficiency. Output is available in tabular and
graphical forms, giving the user several differ-
ent ways to display and analyze results.Output
also can be imported into other programs,
such as Microsoft Word, Excel and
PowerPoint, aiding preparation of reports and
presentations. For more information, visit
www.breeze-software.com
Scenario analysis
LFG Fire/Risk recently was used to deter-
mine exclusion distances for various acciden-
tal release scenarios for an LNG terminal.
These hazards included releases from tanker
grounding, LNG transfer, LNG off-loading,
re-gasification, and failure of tanks and pip-
ing. One scenario involved an LNG storage
tank dike fire that occurred when a tank was
damaged and its contents were released into
a circular containment structure. Figure 4
features a plot of thermal exclusion distances
and a graph of thermal flux as a function of
distance, which are useful for determining
the proper siting for an LNG facility.
Another scenario involved the release of
LNG from a 1.64-ft (0.5-m) diameter hole in
an LNG tanker resulting from its accidental
grounding. This is an unlikely scenario given
the procedures and technology used to guide
tankers during docking and unloading. Figure
5 shows the results from running SOURCE5
and DEGADIS from within LFG Fire/Risk.
The vapor exclusion distances were calculated
to 2.5% methane concentration.
As economic conditions continue to make
LNG import, processing and storage more
attractive, robust analytical capabilities associ-
ated with potential hazards are becoming more
important. Integrated, productivity-enhancing
software that facilitates these analyses will make
project planning for LNG operations easier.
For more information about hazardous
release analysis, contact Dr. Erwin Prater,
senior product specialist for Trinity
Consultants, at (972) 661-8881 or eprater@
trinityconsultants.com
Reference documents are GRI-92/0534 for
SOURCE5; GTI-04/0049 for DEGADIS
and GTI-04/0032 for LNGFIRE3; and
are available on GTI’s Web site at
www.gastechnology.org ✧
28 GasTIPS • Winter 2005
LNG FACILITIES
Table 2. Features in BREEZE LFG/Fire Risk.
LNG-specific SOURCE5 model Extensive database of industrial chemical properties
User-specified LNG containment basin Flexible and user-friendly MS-Windows interface
size, shape and composition material
Seamless integration of results from LNGFIRE3 fire models
SOURCE5 into DEGADIS dense-gas
air dispersion model
Choice of tabular and graphical Environmental Protection Agency boiling liquid
output expanding vapor explosions model
Output compatibility with common Ability to animate results from DEGADIS
MS-Office applications
Import map images in popular formats, Ability to overlay thermal and vapor exclusion areas
including DXF, BMP, and JPEG on maps, plots and drawings
Figure 3. LNGFIRE3 output screen. Figure 5. LFG Fire/Risk output screen.Figure 4. Results from LFG Fire/Risk featur-
ing a plot of thermal exclusion distances
and thermal flux.