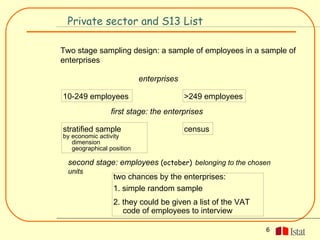
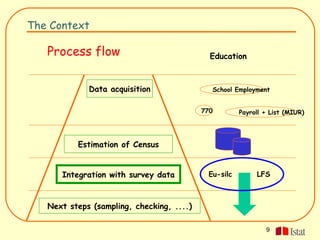
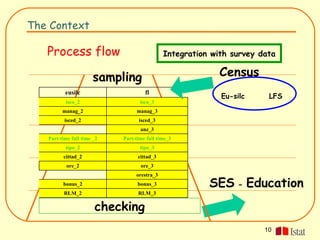
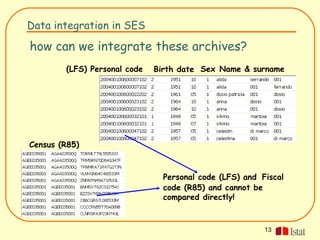
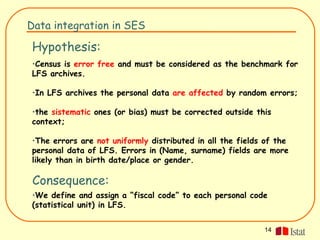
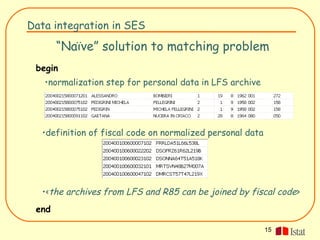
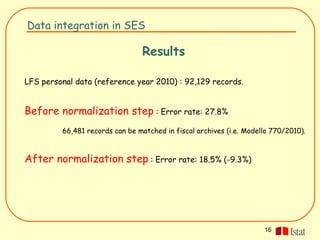
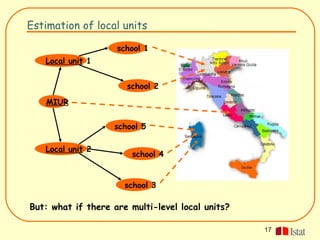
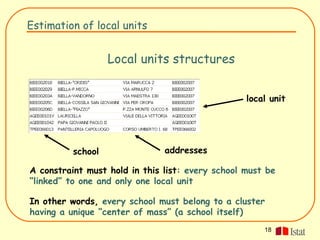
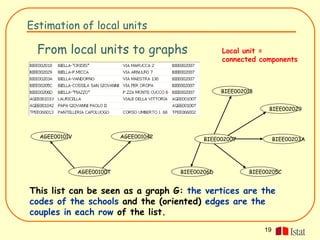
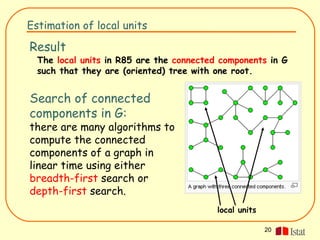
Archivi amministrativi per le statistiche
                             Eurostat


                    Stefania Cardinaleschi, Vincenzo Spinelli
                               Istat – Istituto Nazionale di Statistica


                                 SIS VSP 19-20 Aprile 2012


Sessione: Utilizzo statistico di archivi amministrativi
Outline


The context
    • Definition of Structural
    Earning Survey (SES)
               • Process flow for
Focus on         the Education public sector
    • Data integration by Record Linkage
    • Estimation of local units


                                           2
The Context

LAbour MArket Statistics (LAMAS)
the Council Regulation (EC) No 530/1999
“…needs information on the level and composition of labour costs and
on the structure and distribution of earnings in order to assess the
economic development in the Member States…”


Labour Cost Survey (LCS)                Structure of Earnings Survey(SES)
“The statistics on the level            “The statistics on the structure and
and composition of labour               distribution of earnings
costs

The objective of this legislation is to provide accurate and
harmonised data on earnings in EU Member States and other
countries for policy-making and research purposes (gender pay
gap, file MFR, ..

                                                                3
SES - outline


Objective
• to provide accurate and harmonised microdata on earnings for
  scientific purpose
• to monitor the structure and distribution of earnings, taking into
  account job-related factors
• to provide information on several individual characteristics of
  employees such as gender, age, occupation, education, length of
  stay in service and others

Coverage

• reporting units consisted of enterprises with 10+ employees; results
  related to local units
• C-K of Nace rev.1 plus M-O Nace rev.1 from 2006
• Private sector plus public sector from 2006


                                                                 4
Definition of SES by Eurostat

      Structure of the Survey
      SES 2010

Private sector                   Public sector
and S13 list (excluded P.A.      estimates through administrative
and Education)                   data on all institutions
direct survey through a          specifically
questionnaire
                                 • Education
Firms chosen from the official
                                 they cover the 11% of the total
list of firms (ASIA 2009)
                                 employment


                                                             5
Private sector and S13 List

Two stage sampling design: a sample of employees in a sample of
enterprises

                           enterprises

10-249 employees                         >249 employees
                first stage: the enterprises

stratified sample                        census
by economic activity
   dimension
   geographical position

  second stage: employees (october) belonging to the chosen
  units
                 two chances by the enterprises:
                 1. simple random sample
                 2. they could be given a list of the VAT
                    code of employees to interview

                                                            6
SES sample design – private sector
Sample design Second stage of sampling

Number of employees interviewed by dimension of enterprise to which
they belong

                Enterprises Dimension   Number of employees
                        10-19                   all
                        20-49                   20
                        50-99                   25
                       100-249                  35
                       250-499                  40
                       500-999                  50
                     1000-1999                  60
                     2000-3999                  65
                     4000-7499                  75
                     7500-9999                 100
                       >10000                  200


                                                          7
SES Education - public sector

Education - Public sector: Estimates based on data derived from
 integration among administrative, fiscal and statistic sources
Administrative and fiscal data:
• 770 Form Tax Register by MEF (2010)
• Payroll dataset by MEF/Service Personale Tesoro List employement
  teaching and not teaching by Ministero dell’Istruzione, dell’Università e
  della Ricerca (2010-2011)


Statistical surveys (2010):

• Eu-Silc Panel Survey Statistics on Income and Living Conditions
• Labour force survey


                                                                      8
The Context

   Process flow                              Education


             Data acquisition                    School Employment


                                           770          Payroll + List (MIUR)


          Estimation of Census


      Integration with survey data          Eu-silc           LFS


   Next steps (sampling, checking, ....)

                                                                9
The Context

   Process flow                              Integration with survey data


                      sampling                             Census
          eusilc                     fl
                                                           Eu-silc     LFS
          isco_2                   isco_3
         manag_2                 manag_3
          isced_2                 isced_3
                                   anz_3
   Part-time full time _2   Part-time full time_3
          tipo_2                   tipo_3
         cittad_2                 cittad_3
           ore_2                   ore_3
                                 orestra_3
         bonus_2                  bonus_3               SES - Education
          RLM_2                   RLM_3

                       checking
                                                                      10
Data integration in SES


The context:
   Archives coming from heterogeneous sources.

Objective:
   Assignment to the statistical units (employees)
   in Census R85 of some features available in LFS
   data.

Problem:
   The two sources (SES and LFS) do not use the
   same key fields to identify their statistical units.


                                                 11
Data integration in SES

Warning:
   Eu-silc can be considered as a “special case” of
   LFS for the integration problem, and, for this
   reason, it is not further mentioned in this
   presentation.
Choice:
   The key field in LFS is “personal code”, valid
   only in this context. While census R85 is based
   on “fiscal code” a well-defined key for physical
   persons in administrative and fiscal archives.
   This is why we want to define a mapping from
   “personal code” to fiscal code and not vice versa.

                                                12
Data integration in SES

how can we integrate these archives?
        (LFS) Personal code   Birth date Sex Name & surname


Census (R85)


                                Personal code (LFS) and Fiscal
                                code (R85) and cannot be
                                compared directly!


                                                         13
Data integration in SES

Hypothesis:
•Census is error free and must be considered as the benchmark for
LFS archives.

•In LFS archives the personal data are affected by random errors;

•the sistematic ones (or bias) must be corrected outside this
context;

•The errors are not uniformly distributed in all the fields of the
personal data of LFS. Errors in (Name, surname) fields are more
likely than in birth date/place or gender.

 Consequence:
•We define and assign a “fiscal code” to each personal code
(statistical unit) in LFS.


                                                           14
Data integration in SES

       “Naïve” solution to matching problem
 begin
   •normalization step for personal data in LFS archive


  •definition of fiscal code on normalized personal data


  •<the archives from LFS and R85 can be joined by fiscal code>
 end

                                                           15
Data integration in SES

                                 Results

LFS personal data (reference year 2010) : 92,129 records.


Before normalization step : Error rate: 27.8%
         66,481 records can be matched in fiscal archives (i.e. Modello 770/2010).


After normalization step : Error rate: 18.5% (-9.3%)


                                                                     16
Estimation of local units

                    school 1
   Local unit 1


                      school 2
   MIUR


                   school 5

   Local unit 2
                        school 4


                      school 3

But: what if there are multi-level local units?

                                                  17
Estimation of local units


                   Local units structures


                                                  local unit


          school               addresses

A constraint must hold in this list: every school must be
“linked” to one and only one local unit

In other words, every school must belong to a cluster
having a unique “center of mass” (a school itself)
                                                      18
Estimation of local units

  From local units to graphs                          Local unit =
                                                      connected components


                                                      BIEE002018


                                                                    BIEE002029


  AGEE00101V                AGEE001042          BIEE002007              BIEE00203A


               AGEE00100T                BIEE00206D           BIEE00205C


This list can be seen as a graph G: the vertices are the
codes of the schools and the (oriented) edges are the
couples in each row of the list.
                                                                   19
Estimation of local units

Result
  The local units in R85 are the connected components in G
  such that they are (oriented) tree with one root.


Search of connected
components in G:
there are many algorithms to
compute the connected
components of a graph in
linear time using either
breadth-first search or
depth-first search.
                                          local units

                                                        20
Estimation of local units

                           Inputs
There are 36,923 schools (reference year 2010), i.e., vertices in G.
There are 24,031 (oriented) edges in G.


      Before the clustering Algorithm….
We get 11,892 connected components, such that 3,126 are singletons.

The average size of these components is 3, while the largest
components has 21 vertices.
There are 512 components having less than 10 employees.

                        Results
We considered 11,380 local units (i.e. 35,152 schools) in SES 2010.


                                                                 21

sisvsp2012_ sessione14_ cardinaleschi_spinelli

  • 1.
    Archivi amministrativi perle statistiche Eurostat Stefania Cardinaleschi, Vincenzo Spinelli Istat – Istituto Nazionale di Statistica SIS VSP 19-20 Aprile 2012 Sessione: Utilizzo statistico di archivi amministrativi
  • 2.
    Outline The context • Definition of Structural Earning Survey (SES) • Process flow for Focus on the Education public sector • Data integration by Record Linkage • Estimation of local units 2
  • 3.
    The Context LAbour MArketStatistics (LAMAS) the Council Regulation (EC) No 530/1999 “…needs information on the level and composition of labour costs and on the structure and distribution of earnings in order to assess the economic development in the Member States…” Labour Cost Survey (LCS) Structure of Earnings Survey(SES) “The statistics on the level “The statistics on the structure and and composition of labour distribution of earnings costs The objective of this legislation is to provide accurate and harmonised data on earnings in EU Member States and other countries for policy-making and research purposes (gender pay gap, file MFR, .. 3
  • 4.
    SES - outline Objective •to provide accurate and harmonised microdata on earnings for scientific purpose • to monitor the structure and distribution of earnings, taking into account job-related factors • to provide information on several individual characteristics of employees such as gender, age, occupation, education, length of stay in service and others Coverage • reporting units consisted of enterprises with 10+ employees; results related to local units • C-K of Nace rev.1 plus M-O Nace rev.1 from 2006 • Private sector plus public sector from 2006 4
  • 5.
    Definition of SESby Eurostat Structure of the Survey SES 2010 Private sector Public sector and S13 list (excluded P.A. estimates through administrative and Education) data on all institutions direct survey through a specifically questionnaire • Education Firms chosen from the official they cover the 11% of the total list of firms (ASIA 2009) employment 5
  • 6.
    Private sector andS13 List Two stage sampling design: a sample of employees in a sample of enterprises enterprises 10-249 employees >249 employees first stage: the enterprises stratified sample census by economic activity dimension geographical position second stage: employees (october) belonging to the chosen units two chances by the enterprises: 1. simple random sample 2. they could be given a list of the VAT code of employees to interview 6
  • 7.
    SES sample design– private sector Sample design Second stage of sampling Number of employees interviewed by dimension of enterprise to which they belong Enterprises Dimension Number of employees 10-19 all 20-49 20 50-99 25 100-249 35 250-499 40 500-999 50 1000-1999 60 2000-3999 65 4000-7499 75 7500-9999 100 >10000 200 7
  • 8.
    SES Education -public sector Education - Public sector: Estimates based on data derived from integration among administrative, fiscal and statistic sources Administrative and fiscal data: • 770 Form Tax Register by MEF (2010) • Payroll dataset by MEF/Service Personale Tesoro List employement teaching and not teaching by Ministero dell’Istruzione, dell’Università e della Ricerca (2010-2011) Statistical surveys (2010): • Eu-Silc Panel Survey Statistics on Income and Living Conditions • Labour force survey 8
  • 9.
    The Context Process flow Education Data acquisition School Employment 770 Payroll + List (MIUR) Estimation of Census Integration with survey data Eu-silc LFS Next steps (sampling, checking, ....) 9
  • 10.
    The Context Process flow Integration with survey data sampling Census eusilc fl Eu-silc LFS isco_2 isco_3 manag_2 manag_3 isced_2 isced_3   anz_3 Part-time full time _2 Part-time full time_3 tipo_2 tipo_3 cittad_2 cittad_3 ore_2 ore_3   orestra_3 bonus_2 bonus_3 SES - Education RLM_2 RLM_3 checking 10
  • 11.
    Data integration inSES The context: Archives coming from heterogeneous sources. Objective: Assignment to the statistical units (employees) in Census R85 of some features available in LFS data. Problem: The two sources (SES and LFS) do not use the same key fields to identify their statistical units. 11
  • 12.
    Data integration inSES Warning: Eu-silc can be considered as a “special case” of LFS for the integration problem, and, for this reason, it is not further mentioned in this presentation. Choice: The key field in LFS is “personal code”, valid only in this context. While census R85 is based on “fiscal code” a well-defined key for physical persons in administrative and fiscal archives. This is why we want to define a mapping from “personal code” to fiscal code and not vice versa. 12
  • 13.
    Data integration inSES how can we integrate these archives? (LFS) Personal code Birth date Sex Name & surname Census (R85) Personal code (LFS) and Fiscal code (R85) and cannot be compared directly! 13
  • 14.
    Data integration inSES Hypothesis: •Census is error free and must be considered as the benchmark for LFS archives. •In LFS archives the personal data are affected by random errors; •the sistematic ones (or bias) must be corrected outside this context; •The errors are not uniformly distributed in all the fields of the personal data of LFS. Errors in (Name, surname) fields are more likely than in birth date/place or gender. Consequence: •We define and assign a “fiscal code” to each personal code (statistical unit) in LFS. 14
  • 15.
    Data integration inSES “Naïve” solution to matching problem begin •normalization step for personal data in LFS archive •definition of fiscal code on normalized personal data •<the archives from LFS and R85 can be joined by fiscal code> end 15
  • 16.
    Data integration inSES Results LFS personal data (reference year 2010) : 92,129 records. Before normalization step : Error rate: 27.8% 66,481 records can be matched in fiscal archives (i.e. Modello 770/2010). After normalization step : Error rate: 18.5% (-9.3%) 16
  • 17.
    Estimation of localunits school 1 Local unit 1 school 2 MIUR school 5 Local unit 2 school 4 school 3 But: what if there are multi-level local units? 17
  • 18.
    Estimation of localunits Local units structures local unit school addresses A constraint must hold in this list: every school must be “linked” to one and only one local unit In other words, every school must belong to a cluster having a unique “center of mass” (a school itself) 18
  • 19.
    Estimation of localunits From local units to graphs Local unit = connected components BIEE002018 BIEE002029 AGEE00101V AGEE001042 BIEE002007 BIEE00203A AGEE00100T BIEE00206D BIEE00205C This list can be seen as a graph G: the vertices are the codes of the schools and the (oriented) edges are the couples in each row of the list. 19
  • 20.
    Estimation of localunits Result The local units in R85 are the connected components in G such that they are (oriented) tree with one root. Search of connected components in G: there are many algorithms to compute the connected components of a graph in linear time using either breadth-first search or depth-first search. local units 20
  • 21.
    Estimation of localunits Inputs There are 36,923 schools (reference year 2010), i.e., vertices in G. There are 24,031 (oriented) edges in G. Before the clustering Algorithm…. We get 11,892 connected components, such that 3,126 are singletons. The average size of these components is 3, while the largest components has 21 vertices. There are 512 components having less than 10 employees. Results We considered 11,380 local units (i.e. 35,152 schools) in SES 2010. 21

Editor's Notes