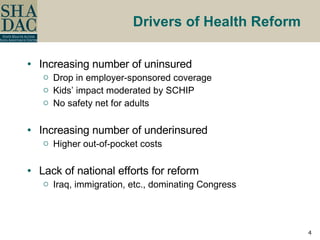
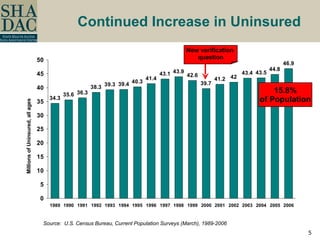
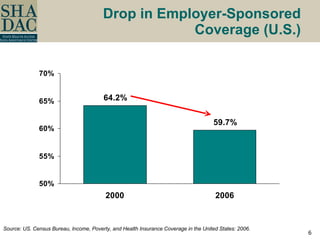
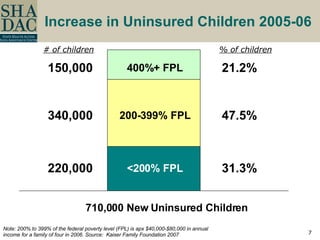
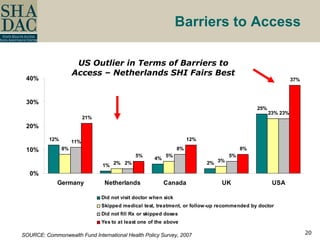
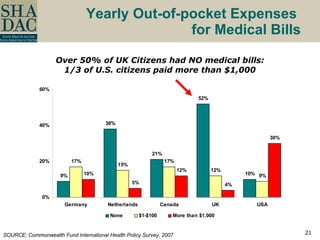
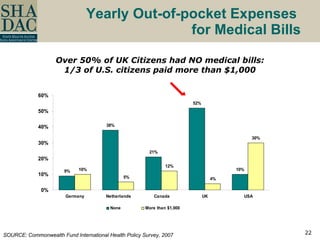
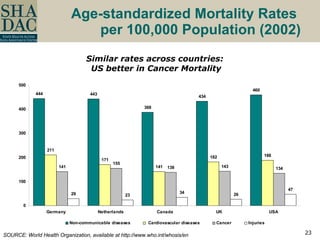
Lynn A. Blewett University of Minnesota, School of Public Health “ The True Workings of Single Payer Systems: Lessons or Warnings for U.S. Reform”  Journal of Health Politics Policy and Law The Hubert H. Humphrey Institute of Public Affairs University of Minnesota, Minneapolis MN May 10, 2008 Funded by a grant from the Robert Wood Johnson Foundation   Single Payer Systems:   Equity in Access to Care
Overview of Presentation Trends in coverage and access International comparisons Thoughts on equity Concluding comments
Recent Trends
Drivers of Health Reform Increasing number of uninsured Drop in employer-sponsored coverage Kids’ impact moderated by SCHIP No safety net for adults Increasing number of underinsured Higher out-of-pocket costs Lack of national efforts for reform Iraq, immigration, etc., dominating Congress
Continued Increase in Uninsured Source:  U.S. Census Bureau, Current Population Surveys (March), 1989-2006 New verification  question Millions of Uninsured, all ages 15.8% of Population
Drop in Employer-Sponsored Coverage (U.S.) Source: US. Census Bureau, Income, Poverty, and Health Insurance Coverage in the United States: 2006.
Increase in Uninsured Children 2005-06 710,000 New Uninsured Children <200% FPL 200-399% FPL 400%+ FPL 220,000 340,000 150,000 31.3% 47.5% 21.2% Note: 200% to 399% of the federal poverty level (FPL) is apx $40,000-$80,000 in annual income for a family of four in 2006. Source:  Kaiser Family Foundation 2007 # of children % of children
Country Classifications of Health Systems
Comparing Five Country Systems Social Health Insurance Models Germany  Netherlands Single Payer Systems United Kingdom Canada Private Multi-Payer US
 
Germany: Social Health Insurance Public insurance mandatory for citizens < €48,000 Covers preventive services, inpatient and outpatient hospital care, and physician services Administered by over 200 non-profit Sickness Funds (SFs) Financed by compulsory contributions to the SFs from employees and employers based on wages Private health insurance: civil servants, self-employed, those earning > €48,000; Financed by risk-related premiums and co-payments Private expenditures on health = 23.1% of total HC $
Netherlands: Social Health Insurance Each person is required to purchase individual private health (community rated premiums with risk adjustment) from competing plans Mandated national benefit set including dental and drugs Financed by income-related contribution that are compensated by employer compensation – employer-based financing About 2/3 of all citizens receive a government subsidy to help pay for coverage in the private market Private expenditure = 37.6% of HC $
Canada: Single Payer Model Universal mandatory coverage Standard benefits for medically necessary hospital, physician, and surgical-dental services (no dental or prescription drugs) Federal funding to each province and territory to administer their own public programs Most providers private (i.e. not government employees) Financed from general income tax and social security contributions Private expenditures = 30% of total HC $
United Kingdom: Single Payer National Health Service (NHS) is universal mandatory coverage Comprehensive benefits includes preventive services, physician services, inpatient and outpatient hospital services Cost-sharing limited to prescription drugs and dental services Most providers are public and salaried Financed through general income tax  Private expenditure on health = 13.7% of HC $
Private Voluntary - US Private voluntary health insurance with supplemental public coverage for select populations (elderly/disabled, low-income children and families No standard benefit package  Most private insurance is employer-based – with employers paying on average 74% of premium cost/employee 26% Financed by tax subsidy to employers who offer; Public insurance is financed by the federal and state governments and through tax revenue schemes Private expenditure on health = 55.3% of HC $
US Health Care Financing and Coverage Total Health Care Spending, 2006: $2.1 Trillion SOURCE: Centers for Medicare & Medicaid Services, Office of the Actuary, National Health Statistics Group. Non-elderly Health Insurance  Coverage, 2006 SOURCE: SHADAC Analysis of the 2007 Annual Social and Economic Supplement to the Current Population Survey
Total expenditure on health:  % of GDP (2005) SOURCE: World Health Organization, available at http://www.who.int/whosis/en U.S. Health Care Spending Outpaces Other Countries
Total Per Capita Spending (2005) SOURCE: World Health Organization, available at http://www.who.int/whosis/en US Per Capita Government Spending  is Similar to other Countries
Distribution of Private and Public Spending SOURCE: World Health Organization, available at http://www.who.int/whosis/en US has greatest share of private spending But Canada private spending greater than UK and Germany
Barriers to Access US Outlier in Terms of Barriers to Access – Netherlands SHI Fairs Best SOURCE: Commonwealth Fund International Health Policy Survey, 2007
Yearly Out-of-pocket Expenses  for Medical Bills SOURCE: Commonwealth Fund International Health Policy Survey, 2007 Over 50% of UK Citizens had NO medical bills: 1/3 of U.S. citizens paid more than $1,000
Age-standardized Mortality Rates  per 100,000 Population (2002) SOURCE: World Health Organization, available at http://www.who.int/whosis/en Similar rates across countries:  US better in Cancer Mortality
Satisfaction with Health System SOURCE: Commonwealth Fund International Health Policy Survey, 2007. More than half of each country’s  Citizens believe fundamental change or complete overall is needed
Summary of Country Comparisons US is outlier on health care spending and on barriers to access to care Health outcomes are similar across countries with US fairing best on cancer outcomes, worst on injury outcomes Other country system rank high on some indicators, low on others – no clear “best” system
Health Care Goals and Equity
WHO Health Care Goals Equity  in access to health care service, including financial access to essential public and private services Financial protection : prevention of individuals from falling into poverty as a result of contributions to health care or a catastrophic expenses, and  Health Status:  protect and improve the health status of individuals and populations by ensuring  financial access  to essential health services.
Equity in Financing Move toward equalization in the ratio of health to non-food spending is identical regardless of their income or health status 5-10 % of income? Tax incidence:  those with greater incomes should contribute more to finance the system Single payer systems with income tax system more able to achieve equitable financing Protection against catastrophic loss Pooling risks and maximizing prepayment
Equity in Access All citizens should have the same access to care regardless of income, health status, race/ethnicity, age, geographic location, employment status  Equal access to core benefits Uniform benefit set Equal access to best treatment protocols and unbiased care How care is provided at the site of care
Risk Pooling and Equity
Concerns with Single Payer in US US Aversion to taxes Persistent Health Disparities Political Process in US System
1.  U.S. Aversion to taxes Concern that we would not accept the tax levels required to fully fund a comprehensive benefits and access for all We seem to better accept hidden taxes (employer subsidy) and cross subsidies (cost shifting) – we still pay but it’s not a TAX Possible outcome is two-tier system of care Inequity in benefit Inequity in access to certain providers Income inequity
2.  Insurance Does Not Equal   Access Potential to  Receive High-Quality Health Care Receive  High-Quality Health Care 1.  Insurance Available 2.   Enrolled in Insurance 3. Providers/Services Covered 4.  Informed Choice Available 5. Consistent Source of Primary Care Available 7. High-Quality Care Delivered 6. Referral Services Accessible JAMA 284 (16). October 25, 2000. :2100-2107 Eisenberg’s Voltage Drops
Persistent Inequities in US System … .that won’t be solved by Universal Coverage Disparities in physician access   Urban vs. Rural Inner City vs Suburbs State vs State Disparities in physician practice patterns Wenberg Race and ethnic disparities in access and treatment
Medicare as Single Payer Example Non-whites less likely to be screened for colorectal cancer (Ananthakrishnan 2007) Hispanics diagnoses with depression were less likely to receive treatment and those who were treated were less likely to receive psychotherapy (Crystal 2003) Blacks and Hispanics less likely to receive pneumococcal and flu vaccinations than whites (Winston 2006) Universal coverage is one  component needed to  achieve EQUITY
3.  Politicization of Decision Making No consensus in US on role of government in health care Concern with current state of politics, stakeholders, lobbyists, and money Medicare prescription drug bill Donut hole Law prohibiting federal government from negotiating drug prices SCHIP Reauthorization delayed and funding put in jeopardy
Concluding Thoughts (1)   The US must join other countries to achieve universal coverage NOW Universal coverage can be achieved independent of financing mechanism US must find its own unique model of reform to achieve universal coverage
Concluding Thoughts (2) Citizens of almost every HC system think fundamental reform is needed No system is superior in all aspects of comparisons Single payer may not be the right vehicle for Universal Coverage in the US Concern about the taxes required to support it Concern that other social inequities will persist with limited resources to address them Politics of health care could dominate the future design and process
Concluding Thoughts (3)  A hybrid social insurance with private sickness funds or private regulated insurance may be a more appropriate model Maintains some elements of a market and competition Maintains the role of employers in financing health care  Moves toward universal coverage  Could retains role of state in “buying” coverage for low-income populations Reform toward Universal Coverage is complicated but needed and achievable!
Contact Information State Health Access Data Assistance Center (SHADAC) University of Minnesota School of Public Health Division of Health Policy and Management 2221 University Avenue, Suite 345  Minneapolis Minnesota 55414  612-624-4802 www.shadac.org www.statereformevaluation.org Principal Investigator: Lynn A. Blewett, Ph.D. (blewe001@umn.edu)

Single Payer Systems: Equity in Access to Care

  • 1.
    Lynn A. BlewettUniversity of Minnesota, School of Public Health “ The True Workings of Single Payer Systems: Lessons or Warnings for U.S. Reform” Journal of Health Politics Policy and Law The Hubert H. Humphrey Institute of Public Affairs University of Minnesota, Minneapolis MN May 10, 2008 Funded by a grant from the Robert Wood Johnson Foundation Single Payer Systems: Equity in Access to Care
  • 2.
    Overview of PresentationTrends in coverage and access International comparisons Thoughts on equity Concluding comments
  • 3.
  • 4.
    Drivers of HealthReform Increasing number of uninsured Drop in employer-sponsored coverage Kids’ impact moderated by SCHIP No safety net for adults Increasing number of underinsured Higher out-of-pocket costs Lack of national efforts for reform Iraq, immigration, etc., dominating Congress
  • 5.
    Continued Increase inUninsured Source: U.S. Census Bureau, Current Population Surveys (March), 1989-2006 New verification question Millions of Uninsured, all ages 15.8% of Population
  • 6.
    Drop in Employer-SponsoredCoverage (U.S.) Source: US. Census Bureau, Income, Poverty, and Health Insurance Coverage in the United States: 2006.
  • 7.
    Increase in UninsuredChildren 2005-06 710,000 New Uninsured Children <200% FPL 200-399% FPL 400%+ FPL 220,000 340,000 150,000 31.3% 47.5% 21.2% Note: 200% to 399% of the federal poverty level (FPL) is apx $40,000-$80,000 in annual income for a family of four in 2006. Source: Kaiser Family Foundation 2007 # of children % of children
  • 8.
  • 9.
    Comparing Five CountrySystems Social Health Insurance Models Germany Netherlands Single Payer Systems United Kingdom Canada Private Multi-Payer US
  • 10.
  • 11.
    Germany: Social HealthInsurance Public insurance mandatory for citizens < €48,000 Covers preventive services, inpatient and outpatient hospital care, and physician services Administered by over 200 non-profit Sickness Funds (SFs) Financed by compulsory contributions to the SFs from employees and employers based on wages Private health insurance: civil servants, self-employed, those earning > €48,000; Financed by risk-related premiums and co-payments Private expenditures on health = 23.1% of total HC $
  • 12.
    Netherlands: Social HealthInsurance Each person is required to purchase individual private health (community rated premiums with risk adjustment) from competing plans Mandated national benefit set including dental and drugs Financed by income-related contribution that are compensated by employer compensation – employer-based financing About 2/3 of all citizens receive a government subsidy to help pay for coverage in the private market Private expenditure = 37.6% of HC $
  • 13.
    Canada: Single PayerModel Universal mandatory coverage Standard benefits for medically necessary hospital, physician, and surgical-dental services (no dental or prescription drugs) Federal funding to each province and territory to administer their own public programs Most providers private (i.e. not government employees) Financed from general income tax and social security contributions Private expenditures = 30% of total HC $
  • 14.
    United Kingdom: SinglePayer National Health Service (NHS) is universal mandatory coverage Comprehensive benefits includes preventive services, physician services, inpatient and outpatient hospital services Cost-sharing limited to prescription drugs and dental services Most providers are public and salaried Financed through general income tax Private expenditure on health = 13.7% of HC $
  • 15.
    Private Voluntary -US Private voluntary health insurance with supplemental public coverage for select populations (elderly/disabled, low-income children and families No standard benefit package Most private insurance is employer-based – with employers paying on average 74% of premium cost/employee 26% Financed by tax subsidy to employers who offer; Public insurance is financed by the federal and state governments and through tax revenue schemes Private expenditure on health = 55.3% of HC $
  • 16.
    US Health CareFinancing and Coverage Total Health Care Spending, 2006: $2.1 Trillion SOURCE: Centers for Medicare & Medicaid Services, Office of the Actuary, National Health Statistics Group. Non-elderly Health Insurance Coverage, 2006 SOURCE: SHADAC Analysis of the 2007 Annual Social and Economic Supplement to the Current Population Survey
  • 17.
    Total expenditure onhealth: % of GDP (2005) SOURCE: World Health Organization, available at http://www.who.int/whosis/en U.S. Health Care Spending Outpaces Other Countries
  • 18.
    Total Per CapitaSpending (2005) SOURCE: World Health Organization, available at http://www.who.int/whosis/en US Per Capita Government Spending is Similar to other Countries
  • 19.
    Distribution of Privateand Public Spending SOURCE: World Health Organization, available at http://www.who.int/whosis/en US has greatest share of private spending But Canada private spending greater than UK and Germany
  • 20.
    Barriers to AccessUS Outlier in Terms of Barriers to Access – Netherlands SHI Fairs Best SOURCE: Commonwealth Fund International Health Policy Survey, 2007
  • 21.
    Yearly Out-of-pocket Expenses for Medical Bills SOURCE: Commonwealth Fund International Health Policy Survey, 2007 Over 50% of UK Citizens had NO medical bills: 1/3 of U.S. citizens paid more than $1,000
  • 22.
    Yearly Out-of-pocket Expenses for Medical Bills SOURCE: Commonwealth Fund International Health Policy Survey, 2007 Over 50% of UK Citizens had NO medical bills: 1/3 of U.S. citizens paid more than $1,000
  • 23.
    Age-standardized Mortality Rates per 100,000 Population (2002) SOURCE: World Health Organization, available at http://www.who.int/whosis/en Similar rates across countries: US better in Cancer Mortality
  • 24.
    Satisfaction with HealthSystem SOURCE: Commonwealth Fund International Health Policy Survey, 2007. More than half of each country’s Citizens believe fundamental change or complete overall is needed
  • 25.
    Summary of CountryComparisons US is outlier on health care spending and on barriers to access to care Health outcomes are similar across countries with US fairing best on cancer outcomes, worst on injury outcomes Other country system rank high on some indicators, low on others – no clear “best” system
  • 26.
  • 27.
    WHO Health CareGoals Equity in access to health care service, including financial access to essential public and private services Financial protection : prevention of individuals from falling into poverty as a result of contributions to health care or a catastrophic expenses, and Health Status: protect and improve the health status of individuals and populations by ensuring financial access to essential health services.
  • 28.
    Equity in FinancingMove toward equalization in the ratio of health to non-food spending is identical regardless of their income or health status 5-10 % of income? Tax incidence: those with greater incomes should contribute more to finance the system Single payer systems with income tax system more able to achieve equitable financing Protection against catastrophic loss Pooling risks and maximizing prepayment
  • 29.
    Equity in AccessAll citizens should have the same access to care regardless of income, health status, race/ethnicity, age, geographic location, employment status Equal access to core benefits Uniform benefit set Equal access to best treatment protocols and unbiased care How care is provided at the site of care
  • 30.
  • 31.
    Concerns with SinglePayer in US US Aversion to taxes Persistent Health Disparities Political Process in US System
  • 32.
    1. U.S.Aversion to taxes Concern that we would not accept the tax levels required to fully fund a comprehensive benefits and access for all We seem to better accept hidden taxes (employer subsidy) and cross subsidies (cost shifting) – we still pay but it’s not a TAX Possible outcome is two-tier system of care Inequity in benefit Inequity in access to certain providers Income inequity
  • 33.
    2. InsuranceDoes Not Equal Access Potential to Receive High-Quality Health Care Receive High-Quality Health Care 1. Insurance Available 2. Enrolled in Insurance 3. Providers/Services Covered 4. Informed Choice Available 5. Consistent Source of Primary Care Available 7. High-Quality Care Delivered 6. Referral Services Accessible JAMA 284 (16). October 25, 2000. :2100-2107 Eisenberg’s Voltage Drops
  • 34.
    Persistent Inequities inUS System … .that won’t be solved by Universal Coverage Disparities in physician access Urban vs. Rural Inner City vs Suburbs State vs State Disparities in physician practice patterns Wenberg Race and ethnic disparities in access and treatment
  • 35.
    Medicare as SinglePayer Example Non-whites less likely to be screened for colorectal cancer (Ananthakrishnan 2007) Hispanics diagnoses with depression were less likely to receive treatment and those who were treated were less likely to receive psychotherapy (Crystal 2003) Blacks and Hispanics less likely to receive pneumococcal and flu vaccinations than whites (Winston 2006) Universal coverage is one component needed to achieve EQUITY
  • 36.
    3. Politicizationof Decision Making No consensus in US on role of government in health care Concern with current state of politics, stakeholders, lobbyists, and money Medicare prescription drug bill Donut hole Law prohibiting federal government from negotiating drug prices SCHIP Reauthorization delayed and funding put in jeopardy
  • 37.
    Concluding Thoughts (1) The US must join other countries to achieve universal coverage NOW Universal coverage can be achieved independent of financing mechanism US must find its own unique model of reform to achieve universal coverage
  • 38.
    Concluding Thoughts (2)Citizens of almost every HC system think fundamental reform is needed No system is superior in all aspects of comparisons Single payer may not be the right vehicle for Universal Coverage in the US Concern about the taxes required to support it Concern that other social inequities will persist with limited resources to address them Politics of health care could dominate the future design and process
  • 39.
    Concluding Thoughts (3) A hybrid social insurance with private sickness funds or private regulated insurance may be a more appropriate model Maintains some elements of a market and competition Maintains the role of employers in financing health care Moves toward universal coverage Could retains role of state in “buying” coverage for low-income populations Reform toward Universal Coverage is complicated but needed and achievable!
  • 40.
    Contact Information StateHealth Access Data Assistance Center (SHADAC) University of Minnesota School of Public Health Division of Health Policy and Management 2221 University Avenue, Suite 345 Minneapolis Minnesota 55414 612-624-4802 www.shadac.org www.statereformevaluation.org Principal Investigator: Lynn A. Blewett, Ph.D. (blewe001@umn.edu)