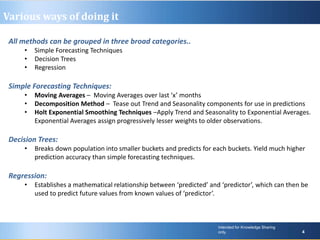
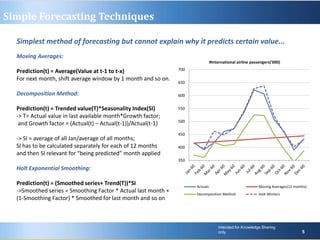
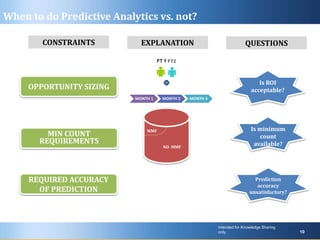
Simplified Analytics
Predictive Analytics: Primer
Sep 27, 2011
What is Predictive Analytics?
Various way of doing it
Forecasting Techniques
Decision Trees
Regression
How to find out if a method works?
How to deploy them in real world?
When to do Predictive Analytics vs. not?
REFERENCES
Intended for Knowledge Sharing
only.
2
Intended for Knowledge Sharing
only. 2
CONTENTS
Intended for Knowledge Sharing
only.
3
Intended for Knowledge Sharing
only. 3
What is Predictive Analytics?
Prediction of future value of variable of interest(predicted) from past values of either
itself or other explanatory variables(predictor)…
eg. Stock price movements, credit card default rates, inventory management, etc.
Concepts of Time Windows..
Other time components..
• Trend – long term organic growth
• Seasonality – specific fluctuations repeating for certain time points(months, days) every year
• Development window (Jan’08 – Jun’10)
• Observe the predicted variable (stock price,
default rate, etc.) and /or get the relationship with
predictor variables
• Validation window (Jul’10 – Dec’10)
• Check if prediction accuracy within acceptable
limits
• If not, improve the prediction framework
• Prediction window (Jan’11 – May’11)
• Use the predictive method to get the projections
• Strategize business actions based on projections
0.00
0.02
0.04
0.06
0.08
0.10
0.12
Rev($Bn)
Development Window Validation
Window
Prediction
Window
Intended for Knowledge Sharing
only.
4
Intended for Knowledge Sharing
only. 4
Various ways of doing it
All methods can be grouped in three broad categories..
• Simple Forecasting Techniques
• Decision Trees
• Regression
Simple Forecasting Techniques:
• Moving Averages – Moving Averages over last ‘x’ months
• Decomposition Method – Tease out Trend and Seasonality components for use in predictions
• Holt Exponential Smoothing Techniques –Apply Trend and Seasonality to Exponential Averages.
Exponential Averages assign progressively lesser weights to older observations.
Decision Trees:
• Breaks down population into smaller buckets and predicts for each buckets. Yield much higher
prediction accuracy than simple forecasting techniques.
Regression:
• Establishes a mathematical relationship between ‘predicted’ and ‘predictor’, which can then be
used to predict future values from known values of ‘predictor’.
Intended for Knowledge Sharing
only.
5
Intended for Knowledge Sharing
only. 5
Simple Forecasting Techniques
Simplest method of forecasting but cannot explain why it predicts certain value...
Moving Averages:
Prediction(t) = Average(Value at t-1 to t-x)
For next month, shift average window by 1 month and so on.
Decomposition Method:
Prediction(t) = Trended value(T)*Seasonality Index(SI)
-> T= Actual value in last available month*Growth factor;
and Growth factor = (Actual(t) – Actual(t-1))/Actual(t-1)
-> SI = average of all Jan/average of all months;
SI has to be calculated separately for each of 12 months
and then SI relevant for “being predicted” month applied
Holt Exponential Smoothing:
Prediction(t) = (Smoothed series+ Trend(T))*SI
->Smoothed series = Smoothing Factor * Actual last month +
(1-Smoothing Factor) * Smoothed for last month and so on
350
400
450
500
550
600
650
700
#International airline passengers('000)
Actuals Moving Averages(12 months)
Decomposition Method Holt-Winters
• Begins with entire population and splits on ‘predicted’ variable(e.g., default rate) by a predictor variable,
e.g. Customer type – Subprime or Premium
• Checks if the difference in ‘predicted’(default rate) is statistically significant using Chi-square or t-test
• If the difference is significant, then it splits the nodes* by other variables,
• If not, it goes back and tries to ‘significantly’ split the population by another variable
How long does it keep splitting?
• Until it finds significant splits based on the Chi-square or t-tests
• Until it hits max number of nodes* (manageable number for business actions)
• When the counts in lower most nodes becomes less than 5%
*Each subgroup resulting from split is called a node
Intended for Knowledge Sharing
only.
6
Intended for Knowledge Sharing
only. 6
Decision Trees
Higher prediction accuracy and explain ability, since prediction is done at member sub-
groups level…
All Credit Card holders
Default rate: 2%
Sub-prime
Default rate: 5%
Premium
Default rate: 1%
FICO <250
Default rate: 8%
FICO: 250 to 400
Default rate: 6%
FICO>400
Default rate: 4%
Monthly spend <$500
Default rate: 0.5%
Monthly spend >$500
Default rate: 1.5%
nodes
• Estimates degree of relationship between the “predicted” variable and the “predictor” variables
e.g. Credit Card default = intercept + b1*bankruptcy +b2*payment to income ratio
->intercept – unexplained factor
->b1,b2– strength of relationship- how much “predicted”((default probability) changes with unit
changes in “predictor” values(bankruptcy or payment to income ratio)
What are the various types of regression?
Intended for Knowledge Sharing
only.
7
Intended for Knowledge Sharing
only. 7
Regression
Highest prediction accuracy and explain ability, since prediction is done at individual
member level…
Regression Methods
Linear Logistic ARIMA
When they should be used?
To predict value of a variable,
e.g., Credit Card spend, inventory
quantity
To predict probability of certain event
happening, e.g., credit card default, inventory
shortage
To predict future values from historical
figures, e.g., future stock price from
past figures
Inherent assumptions in the
technique
Predicted variable follows "normal
distribution" meaning population
has most members having about
average values and lesser counts
towards extremes
Probability of event happening follows
"binomial distribution" meaning probability
of observing 'x' defaulters by picking 'N'
members is highest if the proportion of
defaulters in population is (x/N)
‘Stationary time series’, i.e., the
structure of time series doesn’t change
significantly, i.e., increase in volatility
or change in growth rate itself
Intended for Knowledge Sharing
only.
8
Intended for Knowledge Sharing
only. 8
How to find if a method works?
Various measurement diagnostics can be used to check prediction accuracy…
• Root Mean Square Error (RMSE): Average difference between actual and predicted values.
RMSE = average of square(actual – predicted)
• Error rate(%): Tells what is the error relative to actual values of predicted variable.
Error rate (%) = RMSE/average of actuals
Decision Trees and Regression models have more sophisticated diagnostics…
• R-square: Tells how much of the variance in “predicted” variable is captured by the model.
• Rank Order: Checks if the predicted values correlate with actual values.
Steps:
• Sort the population by predicted values
• Split into groups with equal number of obs, generally ten groups or deciles
• Get the average of both actual and predicted values for each group
• Check if both averages are gradually decreasing from the top group to bottom
• Gains Chart: Useful mostly in logistic regression models. Tells if most of the defaulters are being captured in
top groups itself. If not, models aren’t giving highest probability to actual defaulters and so models needs to
be revisited.
• Akaike Information Criteria(AIC): Helps in selecting the most “parsimonious” regression models- maximum
information capture with least number of predictors.
Intended for Knowledge Sharing
only.
9
Intended for Knowledge Sharing
only. 9
How to deploy them in real world?
Simple Forecasting Techniques are used to predict at portfolio level only, e.g., predictions for
Auto-Lease portfolio’s loss rates
but both Decision Trees and Regression Models require separate infrastructure to get deployed
for real time/non-real time predictions…
Decision Trees is used as a “rule engine”. Every customer will fall into one of the nodes and the
prediction for that node is used to act on this customer’s request, e.g., Sub-prime customer with
FICO<250 will be targeted even when he is just 1 payment due, vs. a premium customer in high
customer will be given leverage to 4 payments due.
Regression Model gives “account level” estimates which are then used to act on customer’s
request, e.g., Fraud models, etc. Models have to run every time a customer transacts.
OPPORTUNITY SIZING
MONTH 1 MONTH 2 MONTH 3
FT 1 FT2
Is ROI
acceptable?
MIN COUNT
REQUIREMENTS
MMF
NO MMF
Is minimum
count
available?
REQUIRED ACCURACY
OF PREDICTION
Prediction
accuracy
unsatisfactory?
CONSTRAINTS EXPLANATION QUESTIONS
Intended for Knowledge Sharing
only. 10
When to do Predictive Analytics vs. not?
Intended for Knowledge Sharing
only. 11
REFERENCES
Simple Forecasting Techniques
http://itl.nist.gov/div898/handbook/pmc/section4/pmc4.htm
Binomial Distributions
http://www.itl.nist.gov/div898/handbook/eda/section3/eda366i.htm
Exponential Smoothing
http://forecasters.org/pdfs/foresight/free/Issue19_goodwin.pdf
Decision Trees
http://www.salford-systems.com/resources/whitepapers/index.html
Linear Regression
http://faculty.chass.ncsu.edu/garson/PA765/regress.htm
Logistic Regression
http://faculty.chass.ncsu.edu/garson/PA765/logistic.htm
ARIMA Regression(also called as Box-Jenkins methodology)
http://www.itl.nist.gov/div898/handbook/pmc/section4/pmc445.htm

A high level overview of all that is Analytics

  • 1.
  • 2.
    What is PredictiveAnalytics? Various way of doing it Forecasting Techniques Decision Trees Regression How to find out if a method works? How to deploy them in real world? When to do Predictive Analytics vs. not? REFERENCES Intended for Knowledge Sharing only. 2 Intended for Knowledge Sharing only. 2 CONTENTS
  • 3.
    Intended for KnowledgeSharing only. 3 Intended for Knowledge Sharing only. 3 What is Predictive Analytics? Prediction of future value of variable of interest(predicted) from past values of either itself or other explanatory variables(predictor)… eg. Stock price movements, credit card default rates, inventory management, etc. Concepts of Time Windows.. Other time components.. • Trend – long term organic growth • Seasonality – specific fluctuations repeating for certain time points(months, days) every year • Development window (Jan’08 – Jun’10) • Observe the predicted variable (stock price, default rate, etc.) and /or get the relationship with predictor variables • Validation window (Jul’10 – Dec’10) • Check if prediction accuracy within acceptable limits • If not, improve the prediction framework • Prediction window (Jan’11 – May’11) • Use the predictive method to get the projections • Strategize business actions based on projections 0.00 0.02 0.04 0.06 0.08 0.10 0.12 Rev($Bn) Development Window Validation Window Prediction Window
  • 4.
    Intended for KnowledgeSharing only. 4 Intended for Knowledge Sharing only. 4 Various ways of doing it All methods can be grouped in three broad categories.. • Simple Forecasting Techniques • Decision Trees • Regression Simple Forecasting Techniques: • Moving Averages – Moving Averages over last ‘x’ months • Decomposition Method – Tease out Trend and Seasonality components for use in predictions • Holt Exponential Smoothing Techniques –Apply Trend and Seasonality to Exponential Averages. Exponential Averages assign progressively lesser weights to older observations. Decision Trees: • Breaks down population into smaller buckets and predicts for each buckets. Yield much higher prediction accuracy than simple forecasting techniques. Regression: • Establishes a mathematical relationship between ‘predicted’ and ‘predictor’, which can then be used to predict future values from known values of ‘predictor’.
  • 5.
    Intended for KnowledgeSharing only. 5 Intended for Knowledge Sharing only. 5 Simple Forecasting Techniques Simplest method of forecasting but cannot explain why it predicts certain value... Moving Averages: Prediction(t) = Average(Value at t-1 to t-x) For next month, shift average window by 1 month and so on. Decomposition Method: Prediction(t) = Trended value(T)*Seasonality Index(SI) -> T= Actual value in last available month*Growth factor; and Growth factor = (Actual(t) – Actual(t-1))/Actual(t-1) -> SI = average of all Jan/average of all months; SI has to be calculated separately for each of 12 months and then SI relevant for “being predicted” month applied Holt Exponential Smoothing: Prediction(t) = (Smoothed series+ Trend(T))*SI ->Smoothed series = Smoothing Factor * Actual last month + (1-Smoothing Factor) * Smoothed for last month and so on 350 400 450 500 550 600 650 700 #International airline passengers('000) Actuals Moving Averages(12 months) Decomposition Method Holt-Winters
  • 6.
    • Begins withentire population and splits on ‘predicted’ variable(e.g., default rate) by a predictor variable, e.g. Customer type – Subprime or Premium • Checks if the difference in ‘predicted’(default rate) is statistically significant using Chi-square or t-test • If the difference is significant, then it splits the nodes* by other variables, • If not, it goes back and tries to ‘significantly’ split the population by another variable How long does it keep splitting? • Until it finds significant splits based on the Chi-square or t-tests • Until it hits max number of nodes* (manageable number for business actions) • When the counts in lower most nodes becomes less than 5% *Each subgroup resulting from split is called a node Intended for Knowledge Sharing only. 6 Intended for Knowledge Sharing only. 6 Decision Trees Higher prediction accuracy and explain ability, since prediction is done at member sub- groups level… All Credit Card holders Default rate: 2% Sub-prime Default rate: 5% Premium Default rate: 1% FICO <250 Default rate: 8% FICO: 250 to 400 Default rate: 6% FICO>400 Default rate: 4% Monthly spend <$500 Default rate: 0.5% Monthly spend >$500 Default rate: 1.5% nodes
  • 7.
    • Estimates degreeof relationship between the “predicted” variable and the “predictor” variables e.g. Credit Card default = intercept + b1*bankruptcy +b2*payment to income ratio ->intercept – unexplained factor ->b1,b2– strength of relationship- how much “predicted”((default probability) changes with unit changes in “predictor” values(bankruptcy or payment to income ratio) What are the various types of regression? Intended for Knowledge Sharing only. 7 Intended for Knowledge Sharing only. 7 Regression Highest prediction accuracy and explain ability, since prediction is done at individual member level… Regression Methods Linear Logistic ARIMA When they should be used? To predict value of a variable, e.g., Credit Card spend, inventory quantity To predict probability of certain event happening, e.g., credit card default, inventory shortage To predict future values from historical figures, e.g., future stock price from past figures Inherent assumptions in the technique Predicted variable follows "normal distribution" meaning population has most members having about average values and lesser counts towards extremes Probability of event happening follows "binomial distribution" meaning probability of observing 'x' defaulters by picking 'N' members is highest if the proportion of defaulters in population is (x/N) ‘Stationary time series’, i.e., the structure of time series doesn’t change significantly, i.e., increase in volatility or change in growth rate itself
  • 8.
    Intended for KnowledgeSharing only. 8 Intended for Knowledge Sharing only. 8 How to find if a method works? Various measurement diagnostics can be used to check prediction accuracy… • Root Mean Square Error (RMSE): Average difference between actual and predicted values. RMSE = average of square(actual – predicted) • Error rate(%): Tells what is the error relative to actual values of predicted variable. Error rate (%) = RMSE/average of actuals Decision Trees and Regression models have more sophisticated diagnostics… • R-square: Tells how much of the variance in “predicted” variable is captured by the model. • Rank Order: Checks if the predicted values correlate with actual values. Steps: • Sort the population by predicted values • Split into groups with equal number of obs, generally ten groups or deciles • Get the average of both actual and predicted values for each group • Check if both averages are gradually decreasing from the top group to bottom • Gains Chart: Useful mostly in logistic regression models. Tells if most of the defaulters are being captured in top groups itself. If not, models aren’t giving highest probability to actual defaulters and so models needs to be revisited. • Akaike Information Criteria(AIC): Helps in selecting the most “parsimonious” regression models- maximum information capture with least number of predictors.
  • 9.
    Intended for KnowledgeSharing only. 9 Intended for Knowledge Sharing only. 9 How to deploy them in real world? Simple Forecasting Techniques are used to predict at portfolio level only, e.g., predictions for Auto-Lease portfolio’s loss rates but both Decision Trees and Regression Models require separate infrastructure to get deployed for real time/non-real time predictions… Decision Trees is used as a “rule engine”. Every customer will fall into one of the nodes and the prediction for that node is used to act on this customer’s request, e.g., Sub-prime customer with FICO<250 will be targeted even when he is just 1 payment due, vs. a premium customer in high customer will be given leverage to 4 payments due. Regression Model gives “account level” estimates which are then used to act on customer’s request, e.g., Fraud models, etc. Models have to run every time a customer transacts.
  • 10.
    OPPORTUNITY SIZING MONTH 1MONTH 2 MONTH 3 FT 1 FT2 Is ROI acceptable? MIN COUNT REQUIREMENTS MMF NO MMF Is minimum count available? REQUIRED ACCURACY OF PREDICTION Prediction accuracy unsatisfactory? CONSTRAINTS EXPLANATION QUESTIONS Intended for Knowledge Sharing only. 10 When to do Predictive Analytics vs. not?
  • 11.
    Intended for KnowledgeSharing only. 11 REFERENCES Simple Forecasting Techniques http://itl.nist.gov/div898/handbook/pmc/section4/pmc4.htm Binomial Distributions http://www.itl.nist.gov/div898/handbook/eda/section3/eda366i.htm Exponential Smoothing http://forecasters.org/pdfs/foresight/free/Issue19_goodwin.pdf Decision Trees http://www.salford-systems.com/resources/whitepapers/index.html Linear Regression http://faculty.chass.ncsu.edu/garson/PA765/regress.htm Logistic Regression http://faculty.chass.ncsu.edu/garson/PA765/logistic.htm ARIMA Regression(also called as Box-Jenkins methodology) http://www.itl.nist.gov/div898/handbook/pmc/section4/pmc445.htm