Download as PDF, PPTX


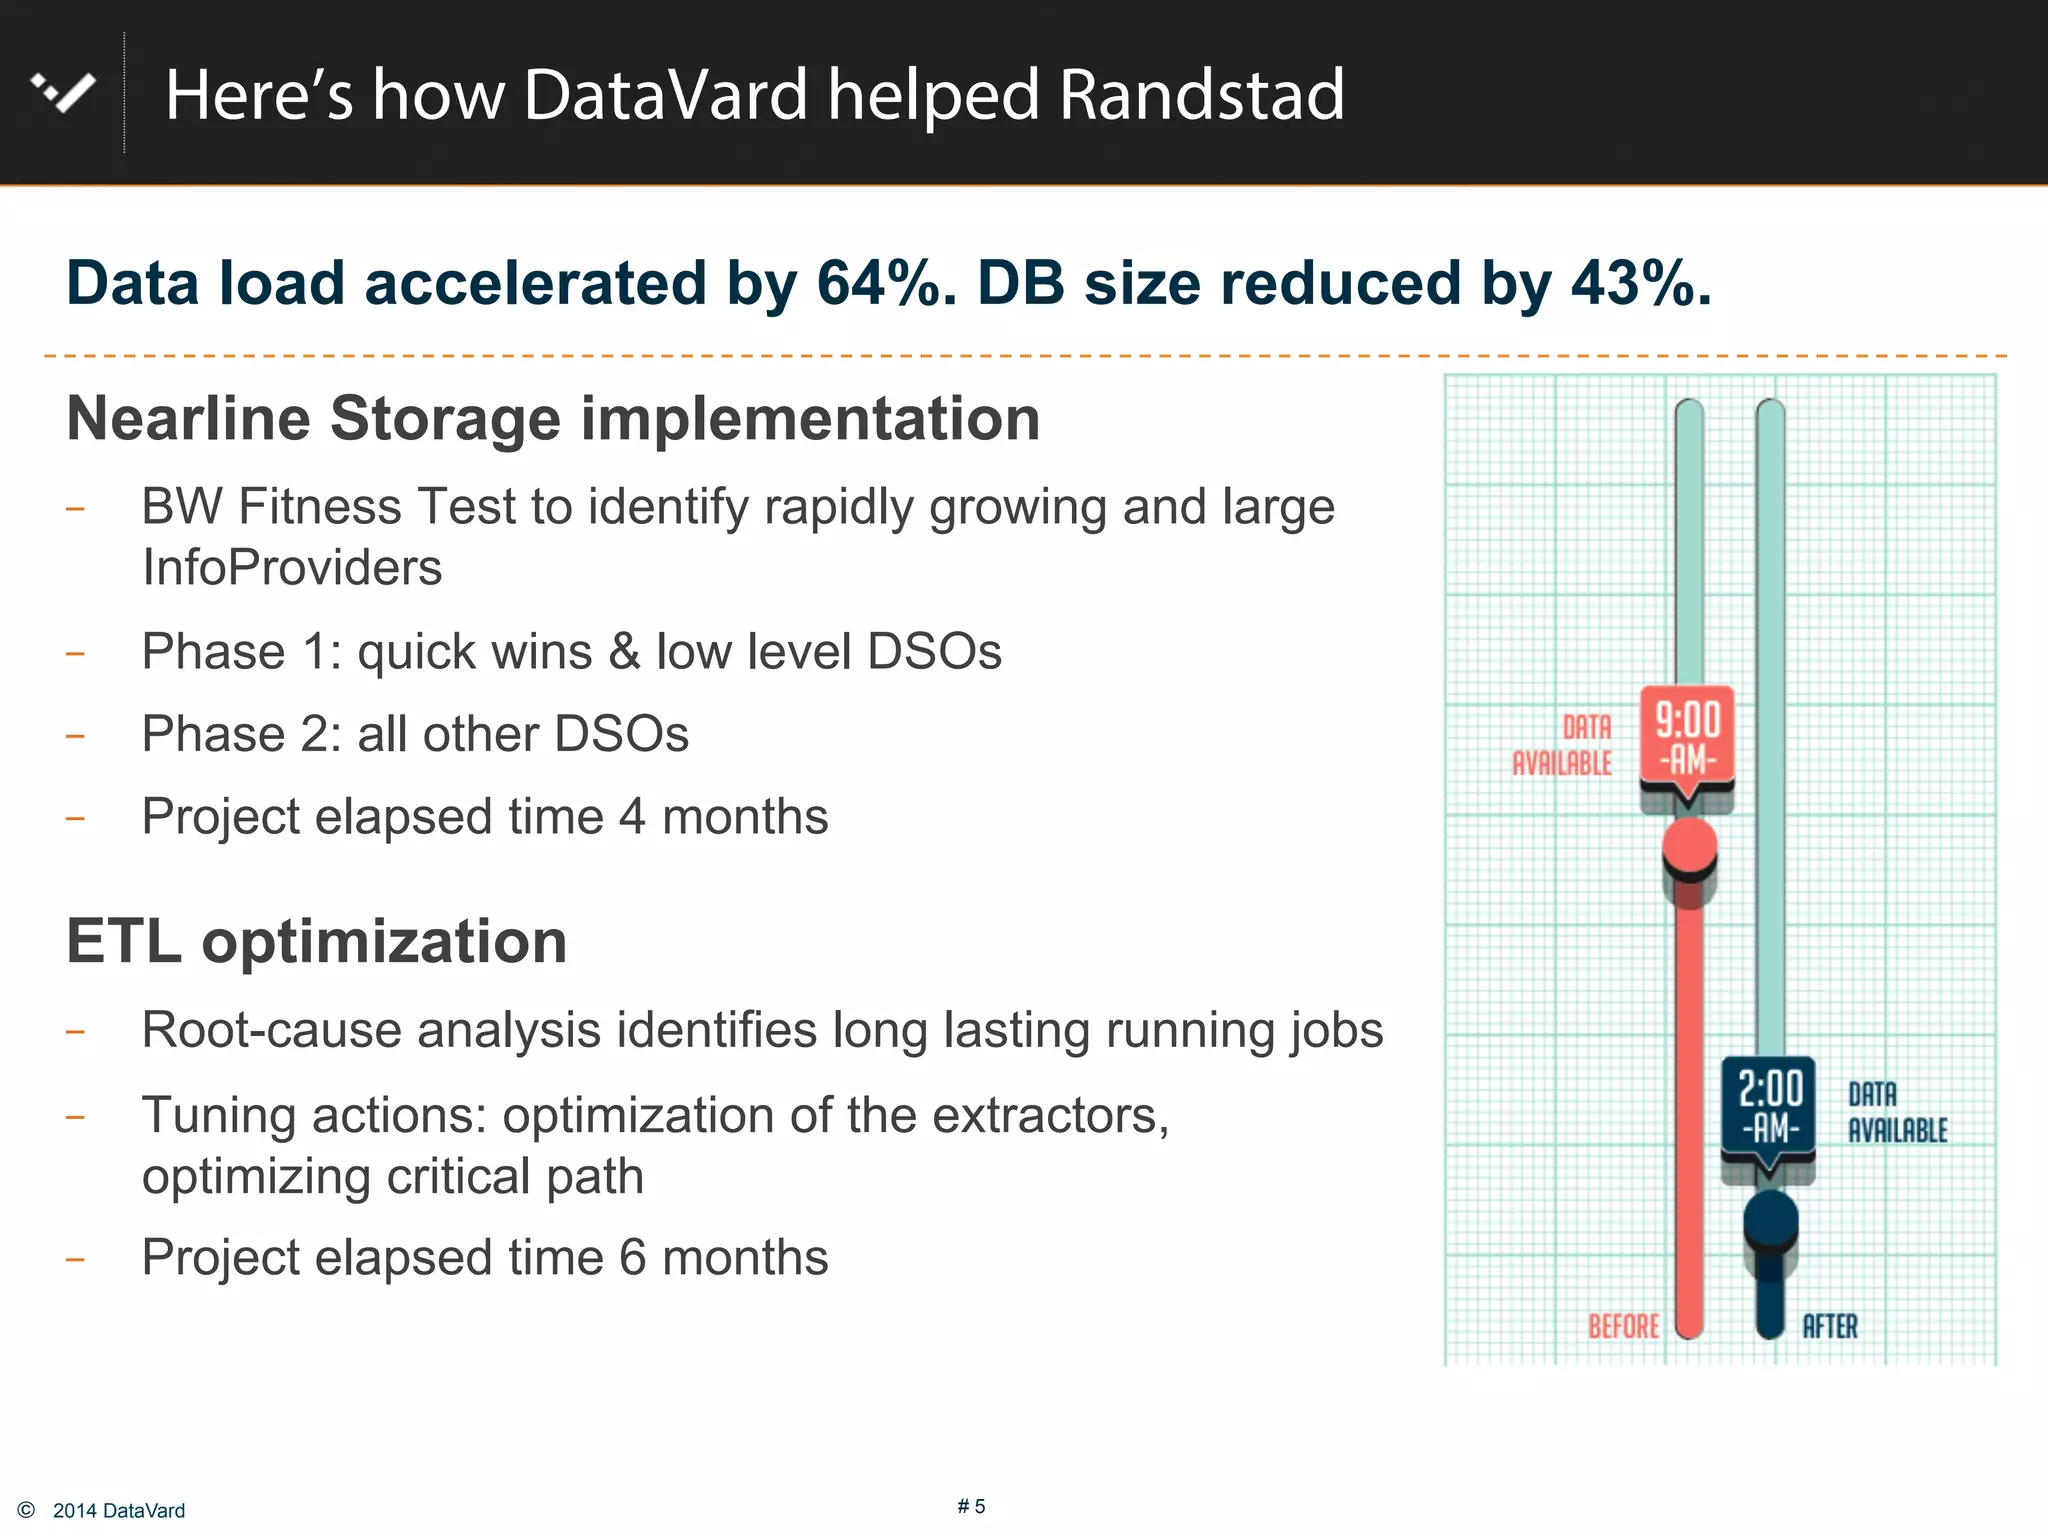
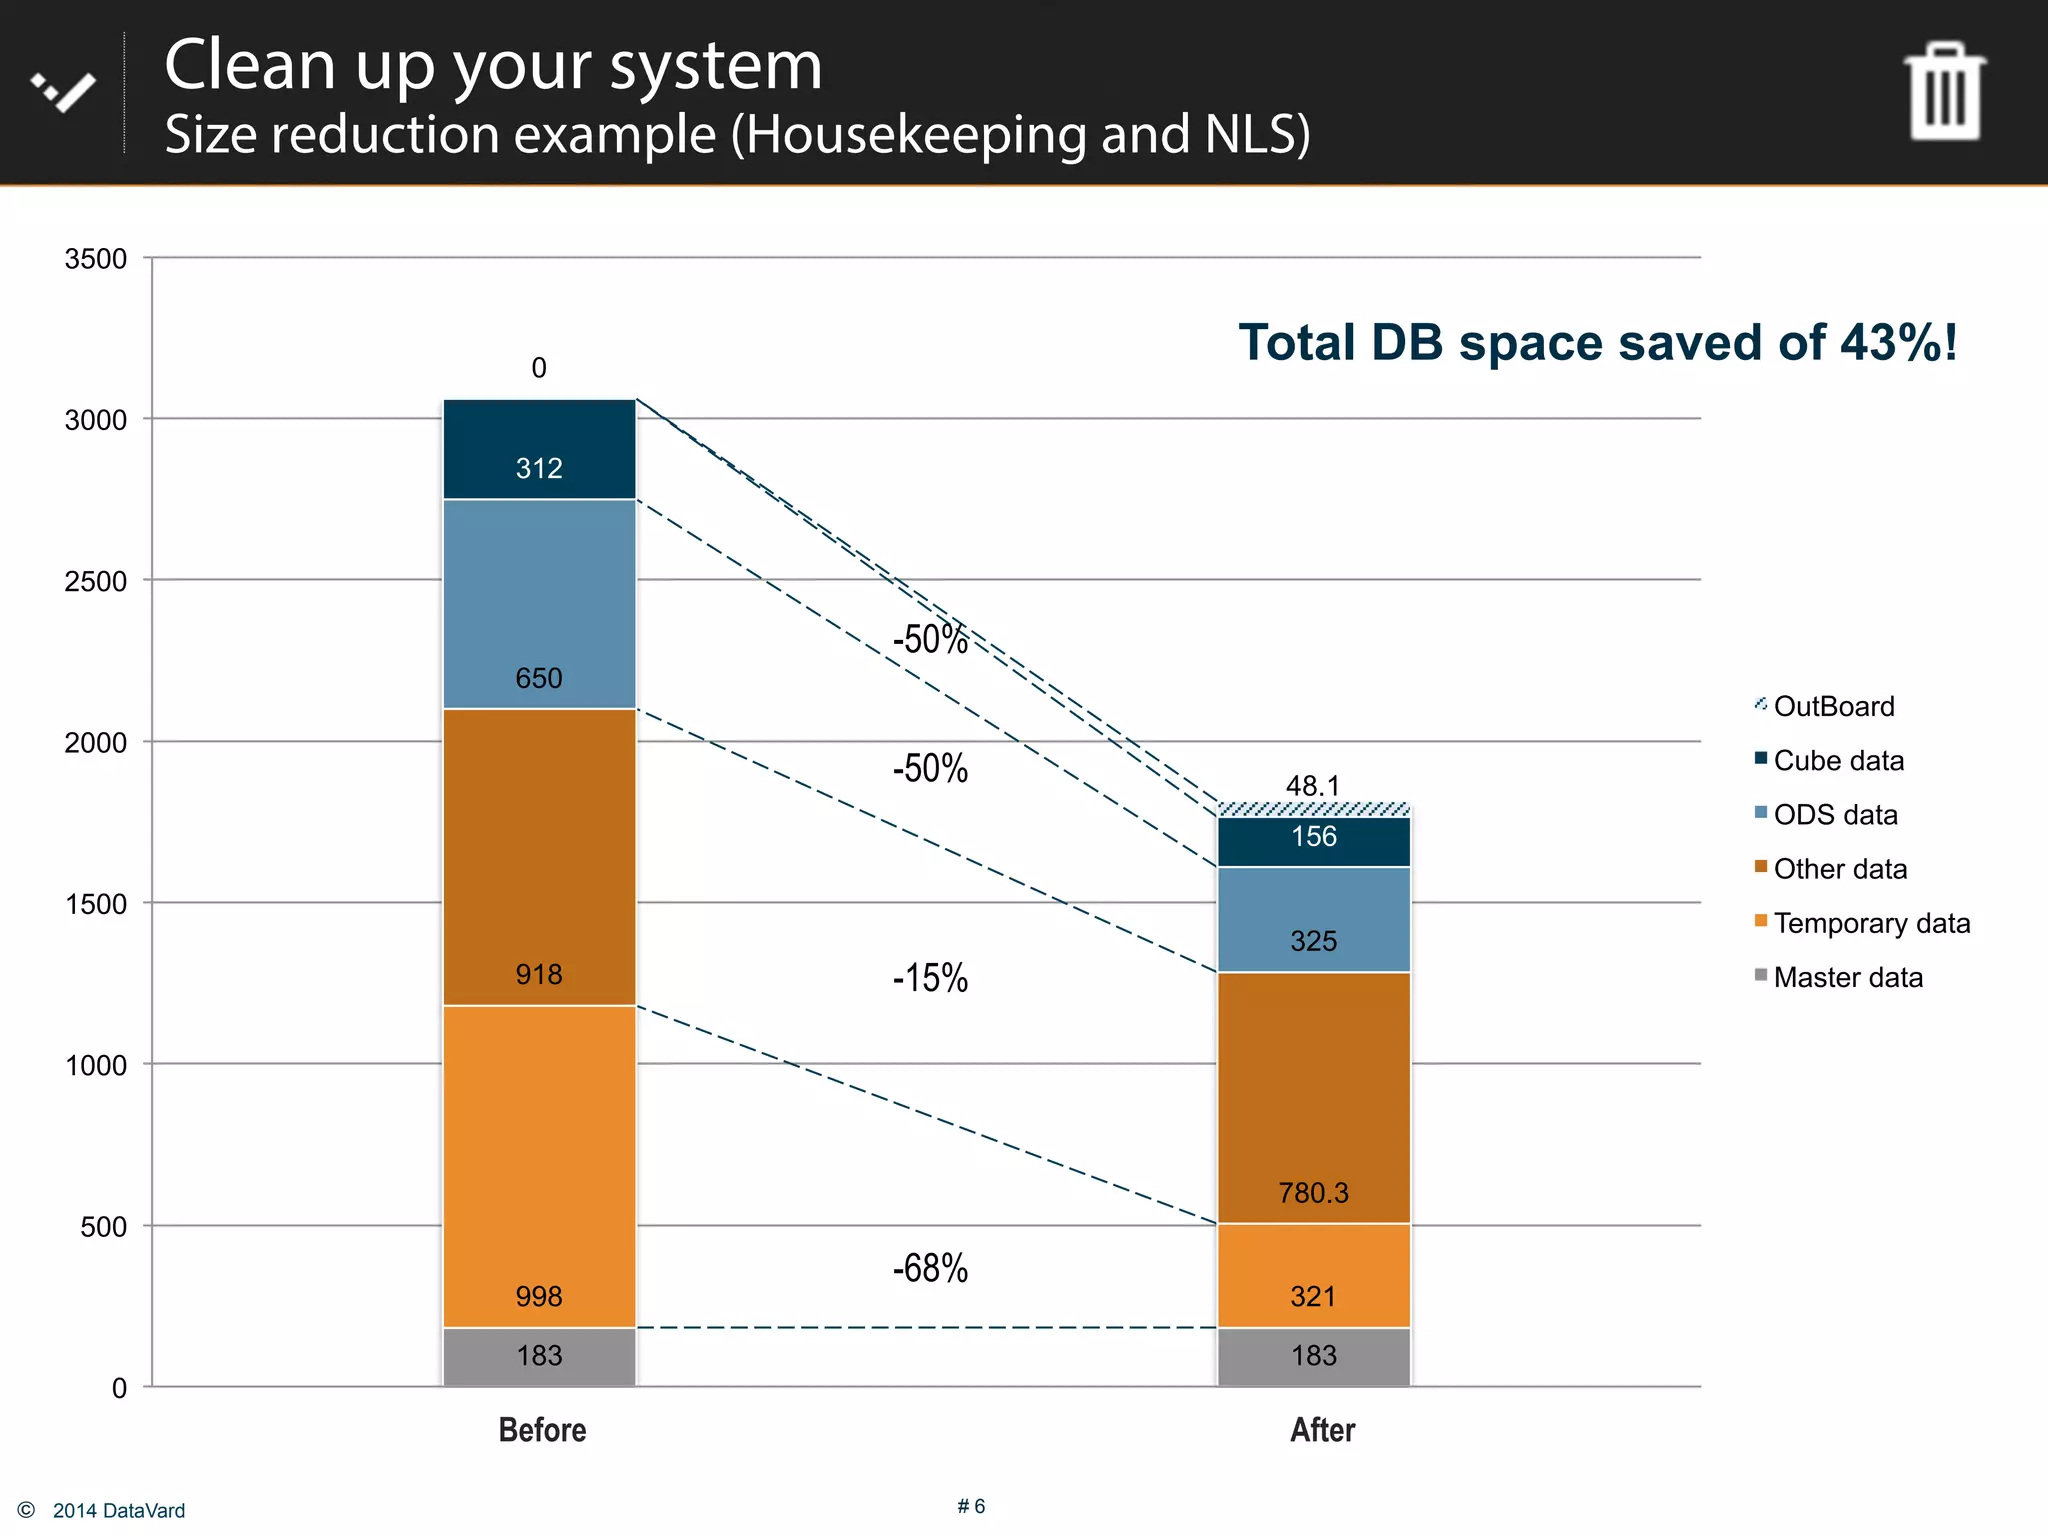
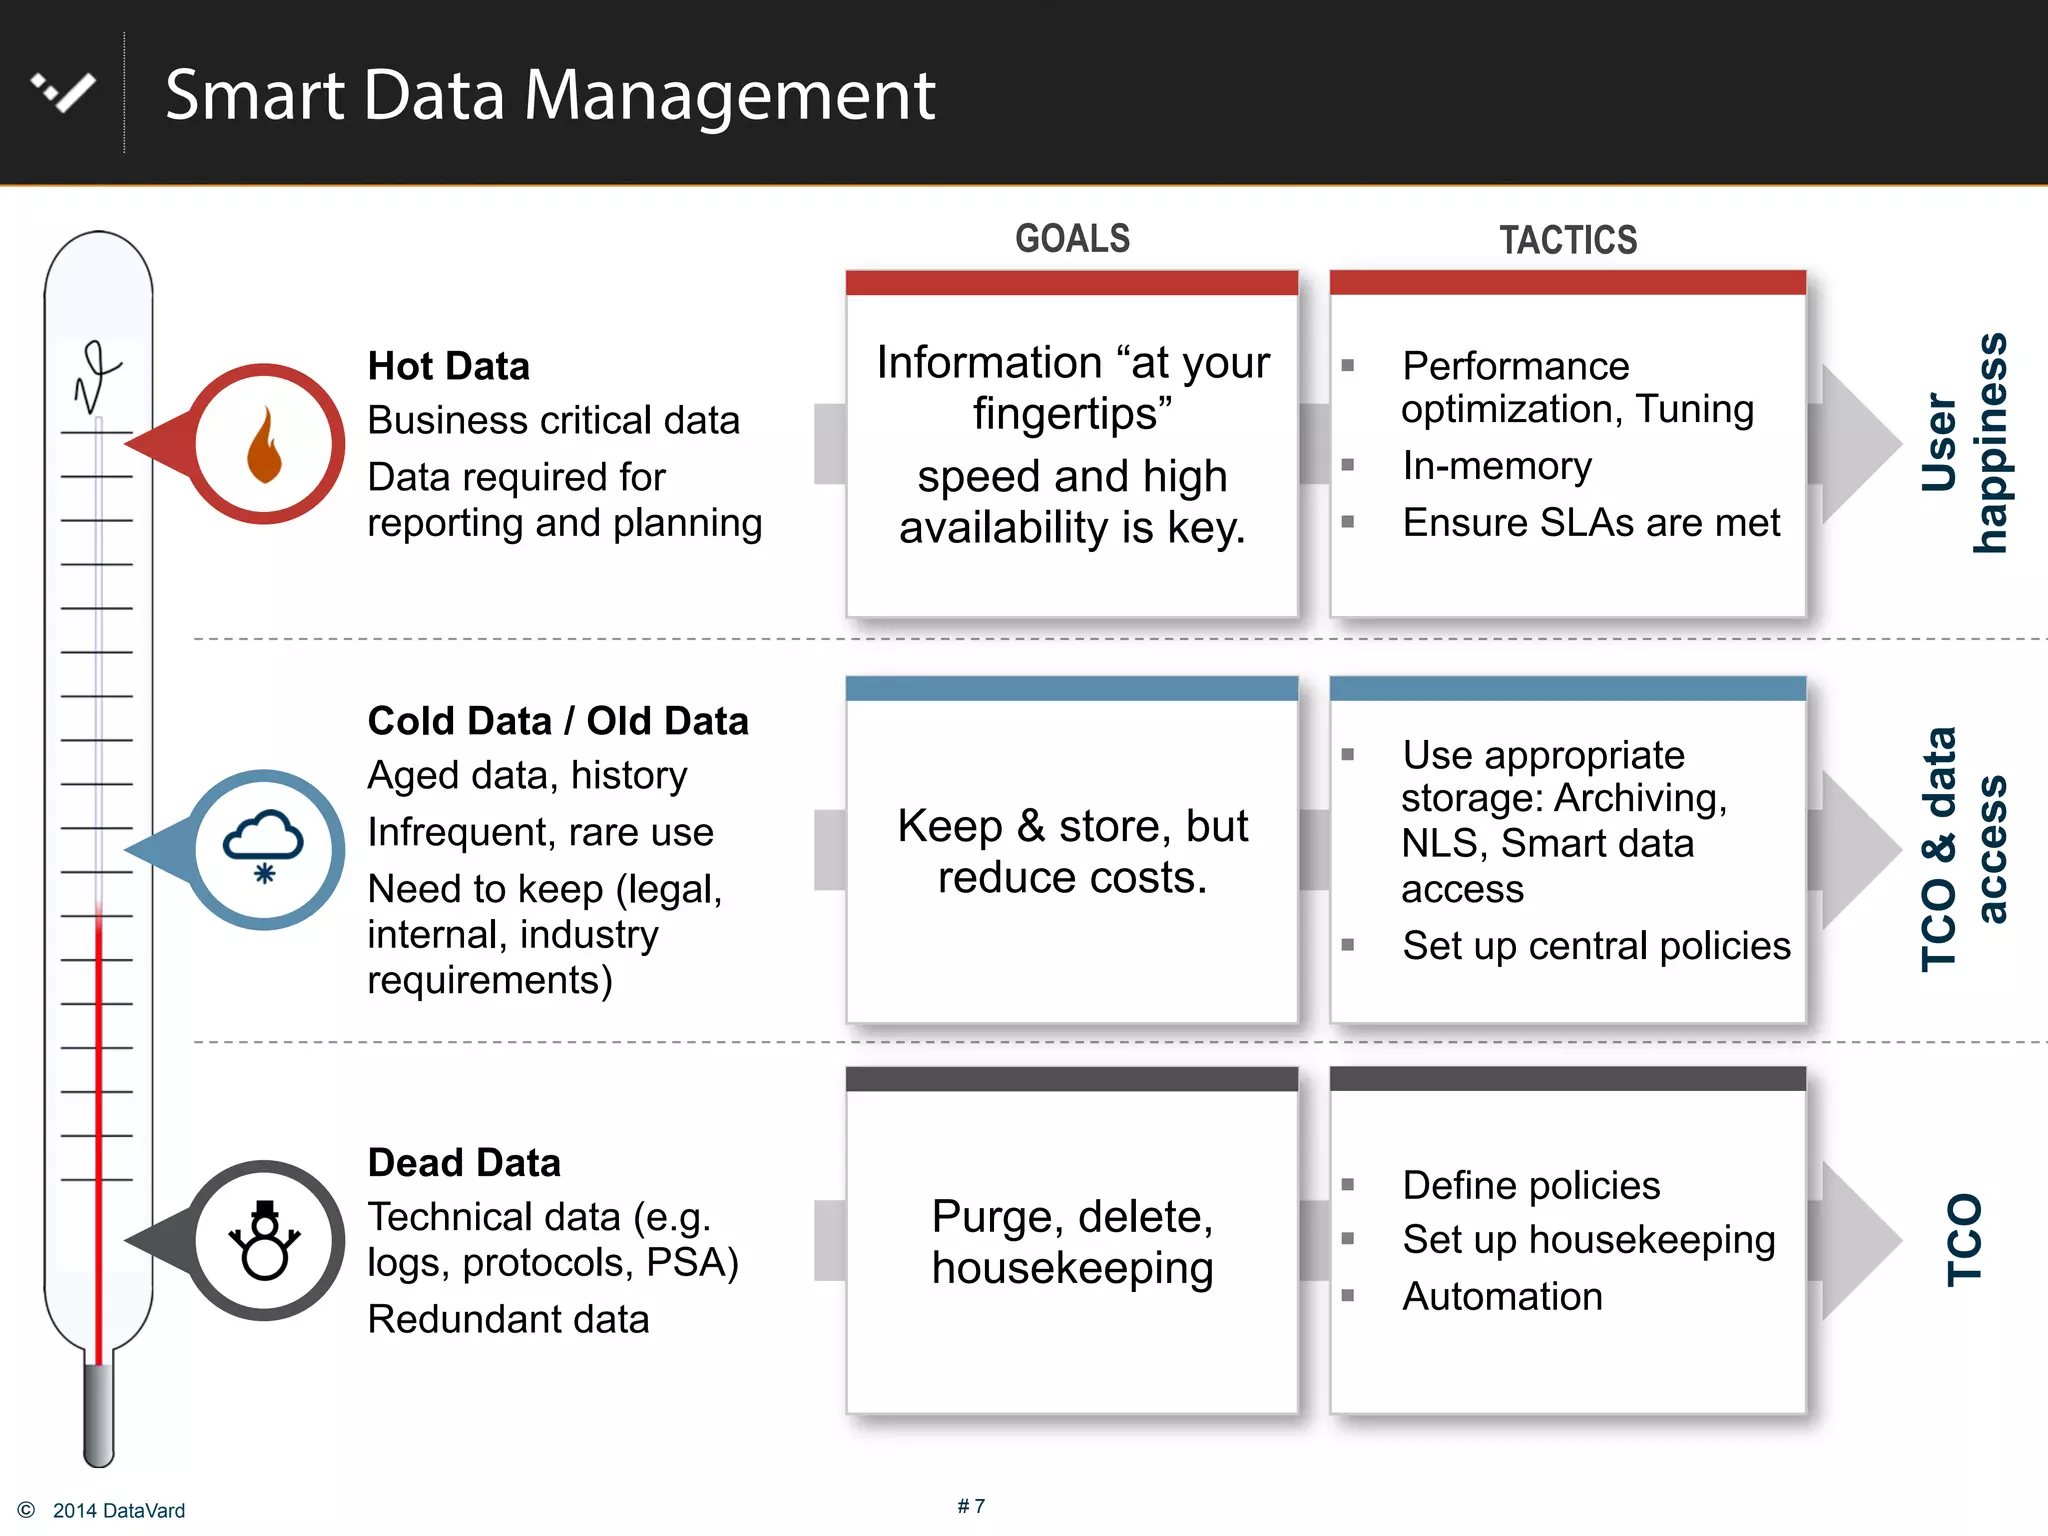
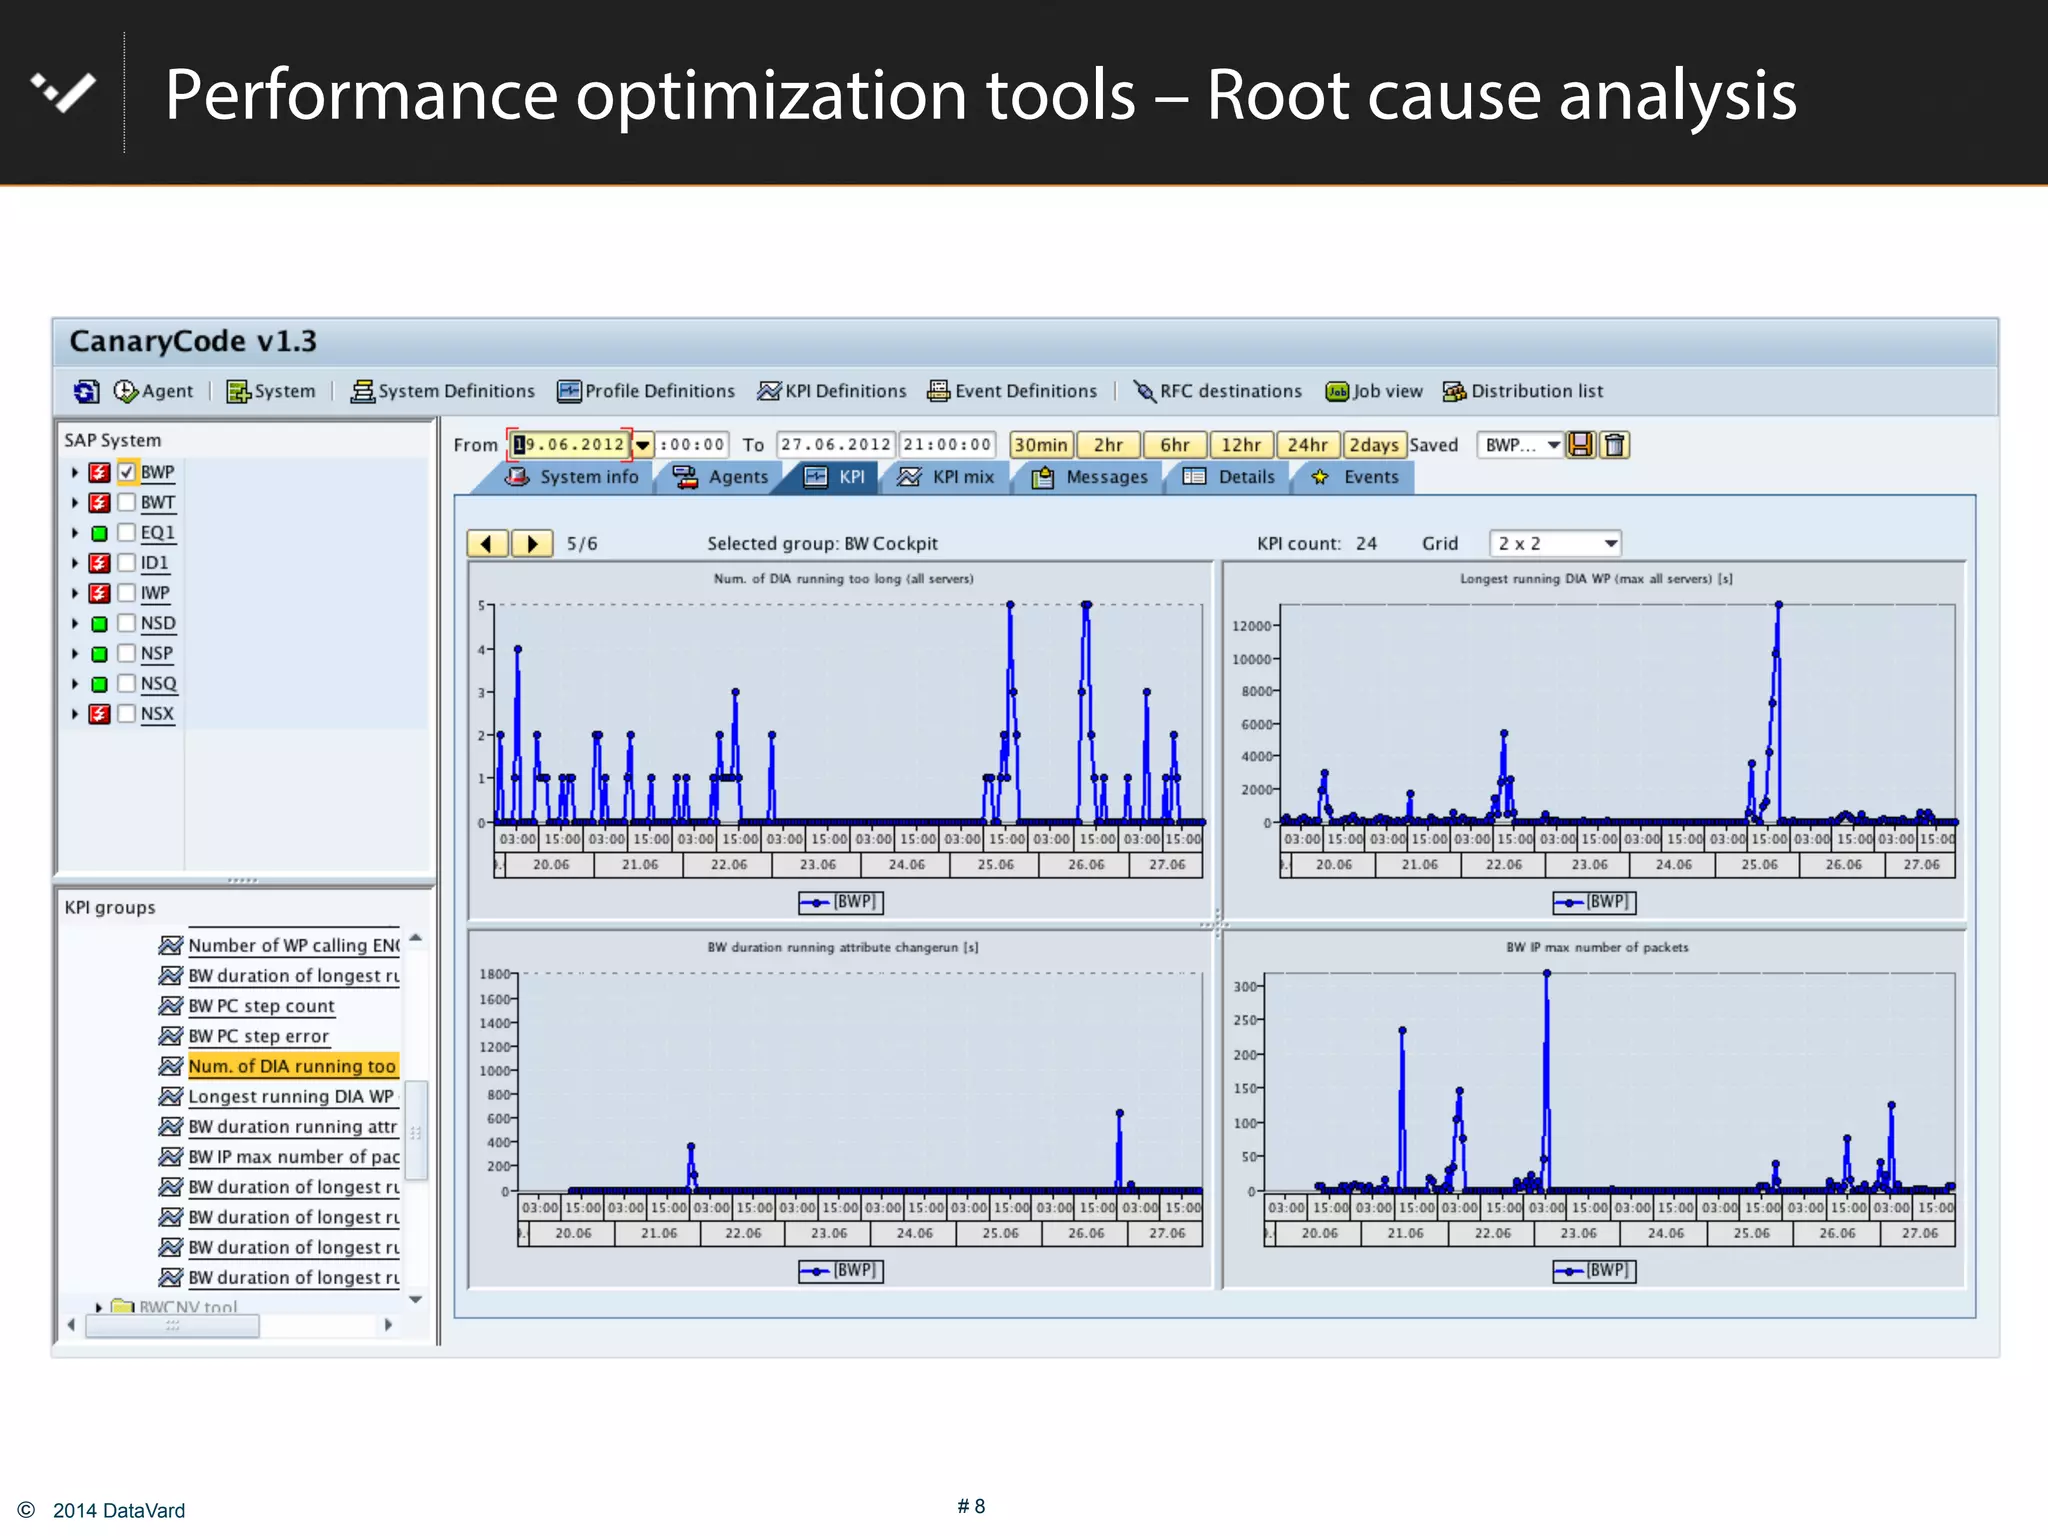
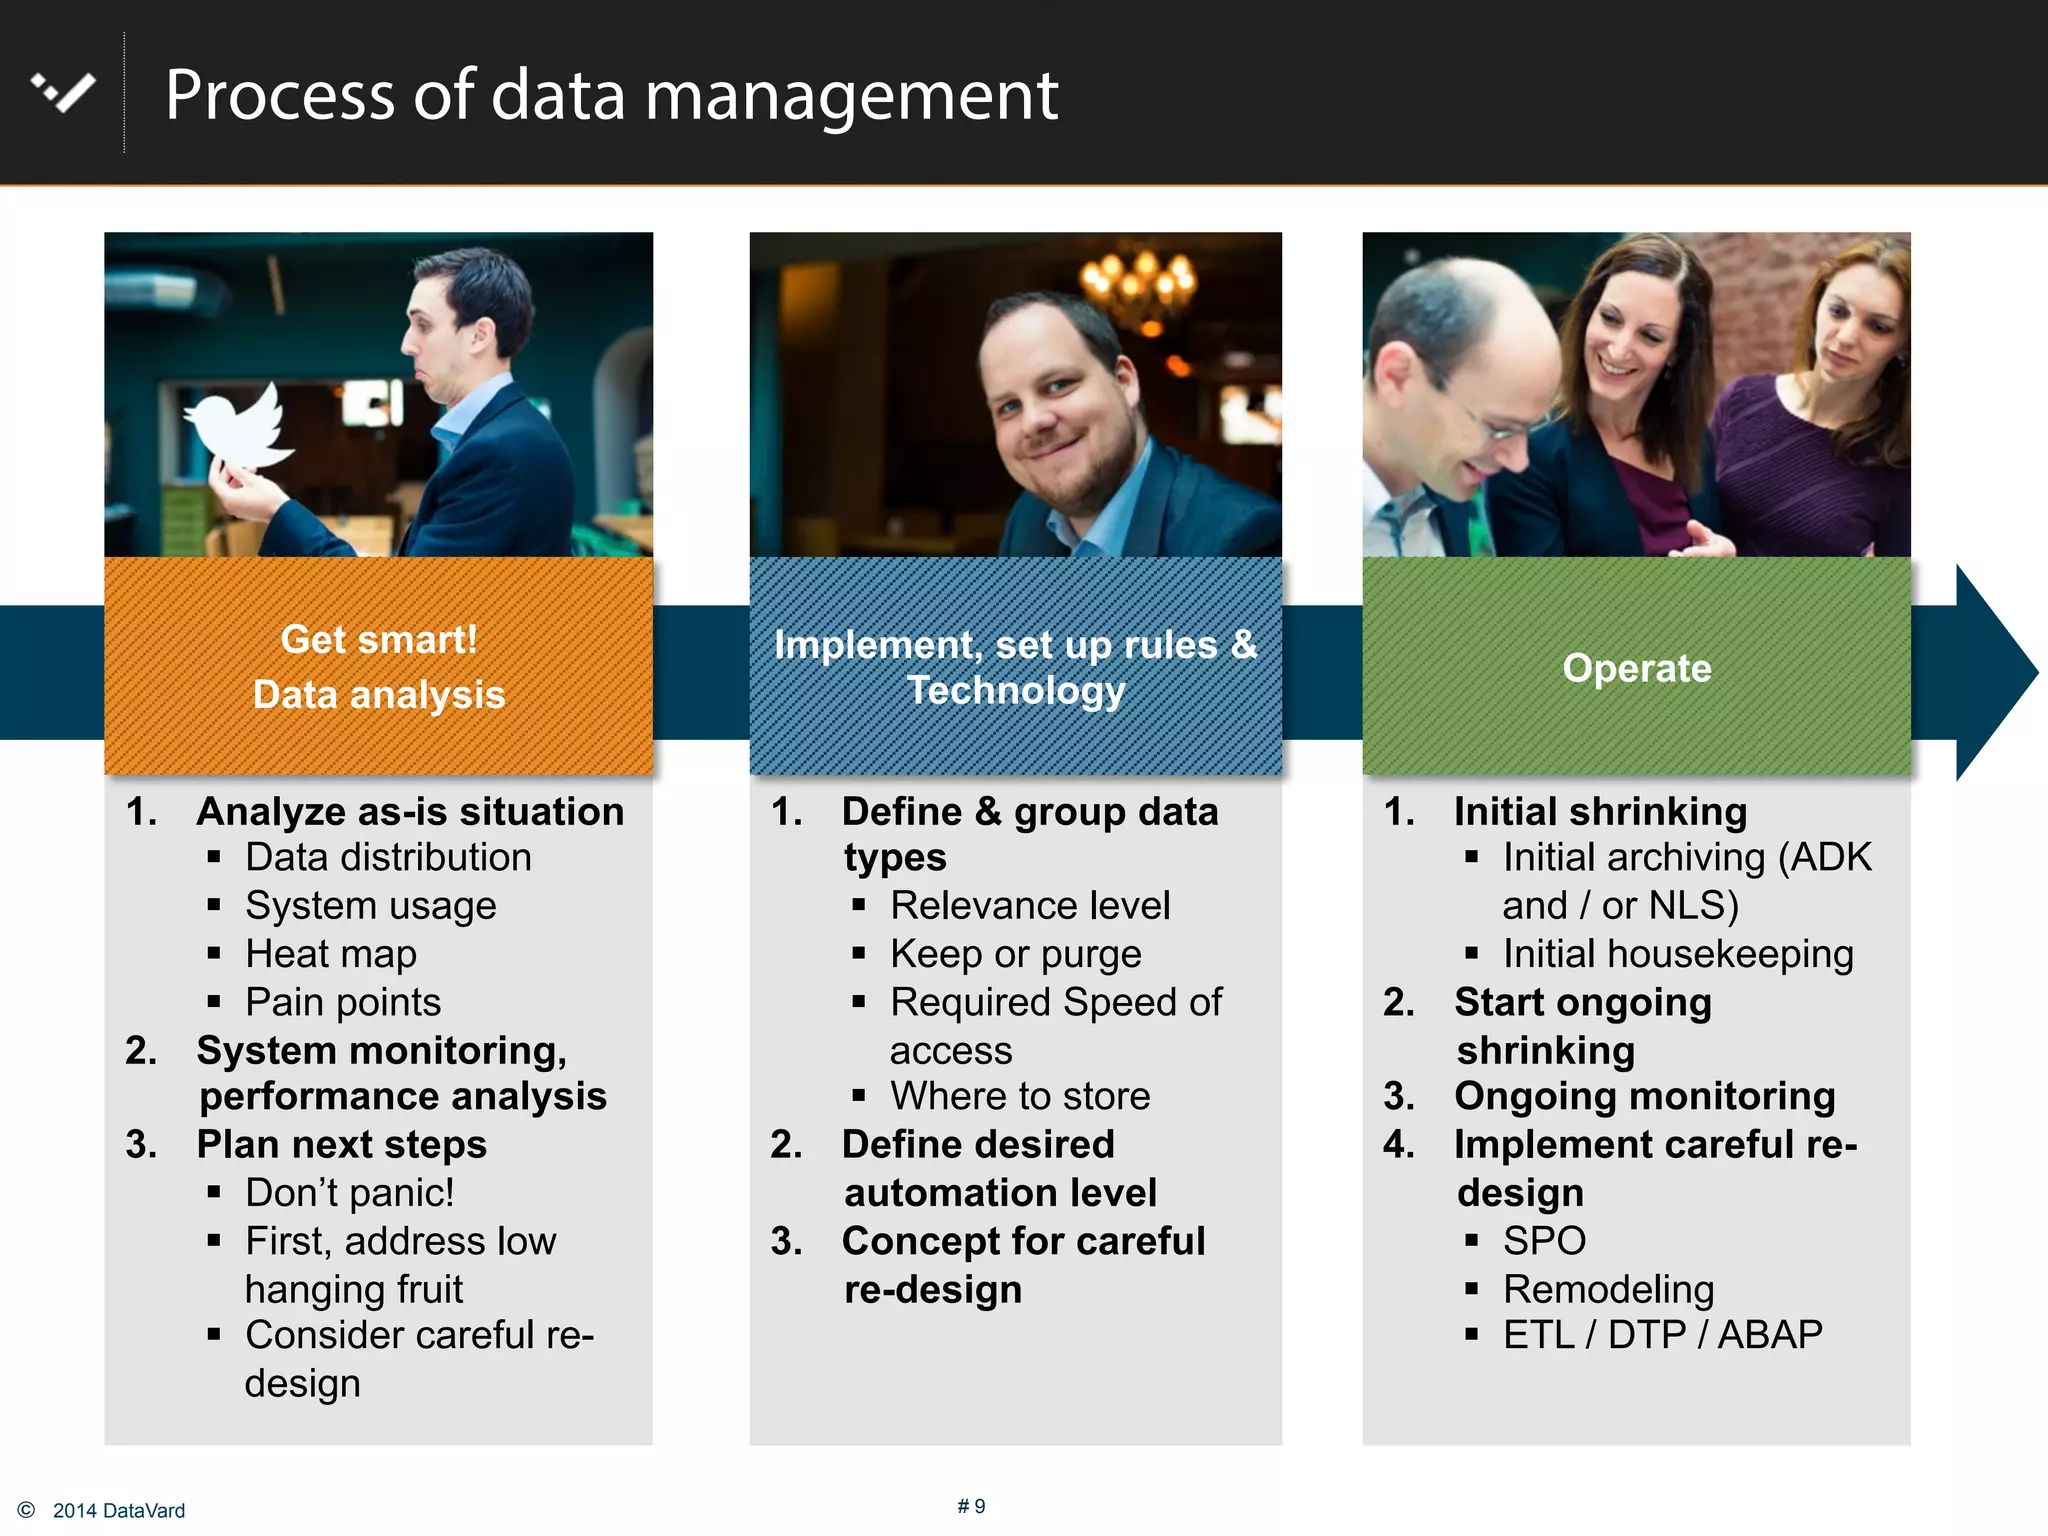
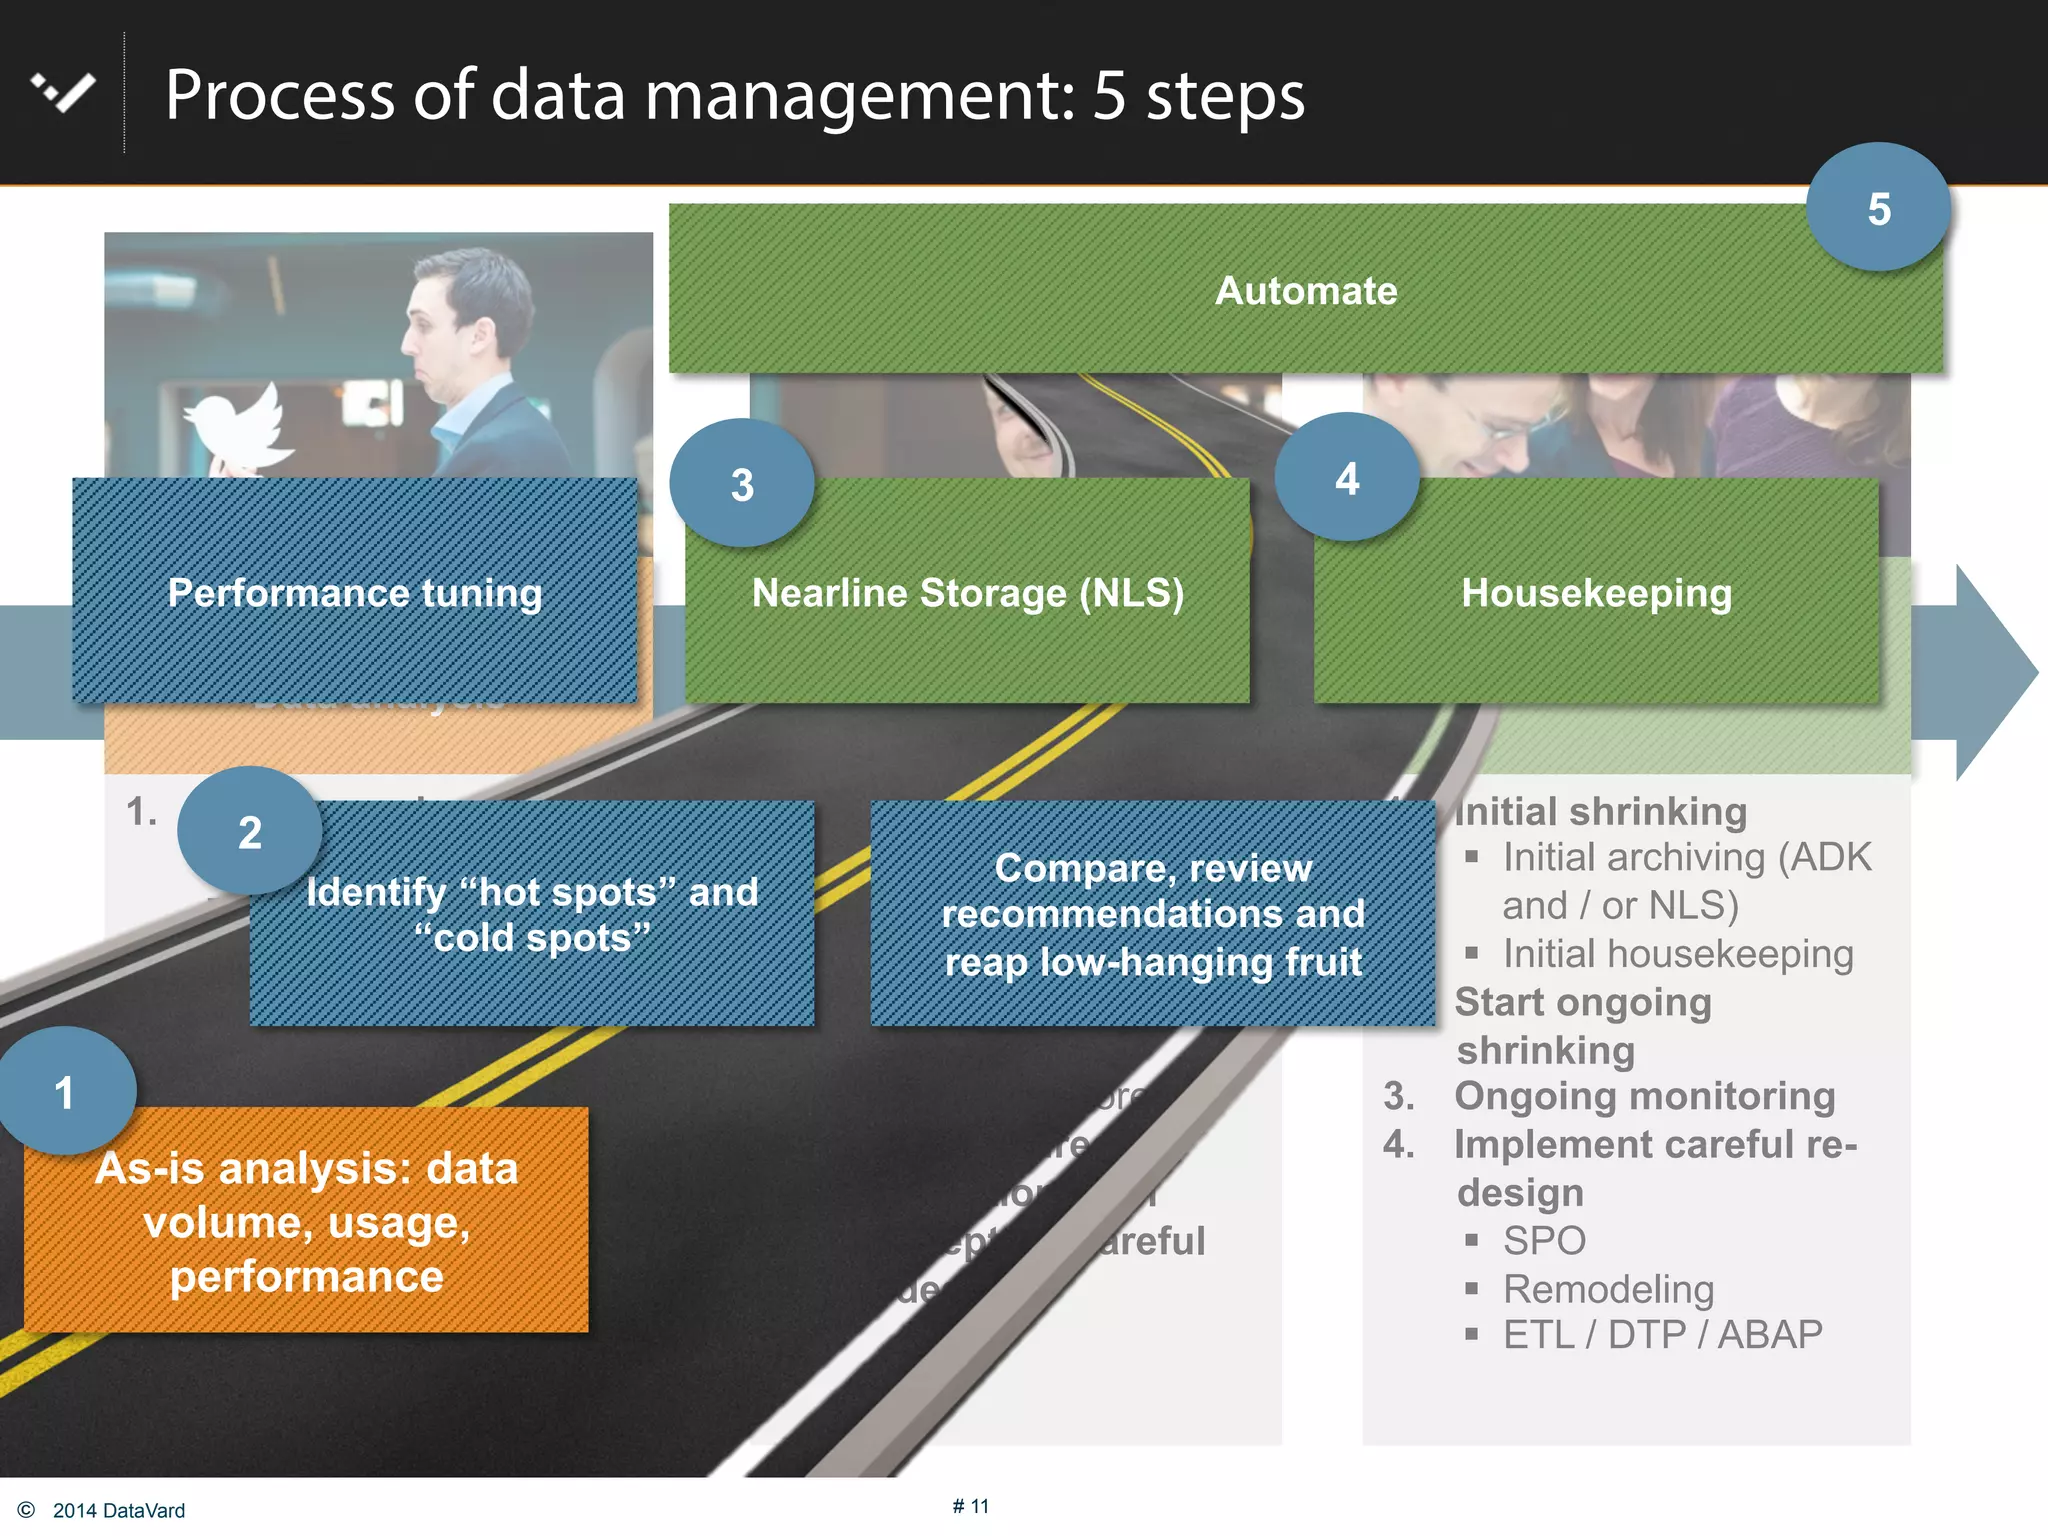
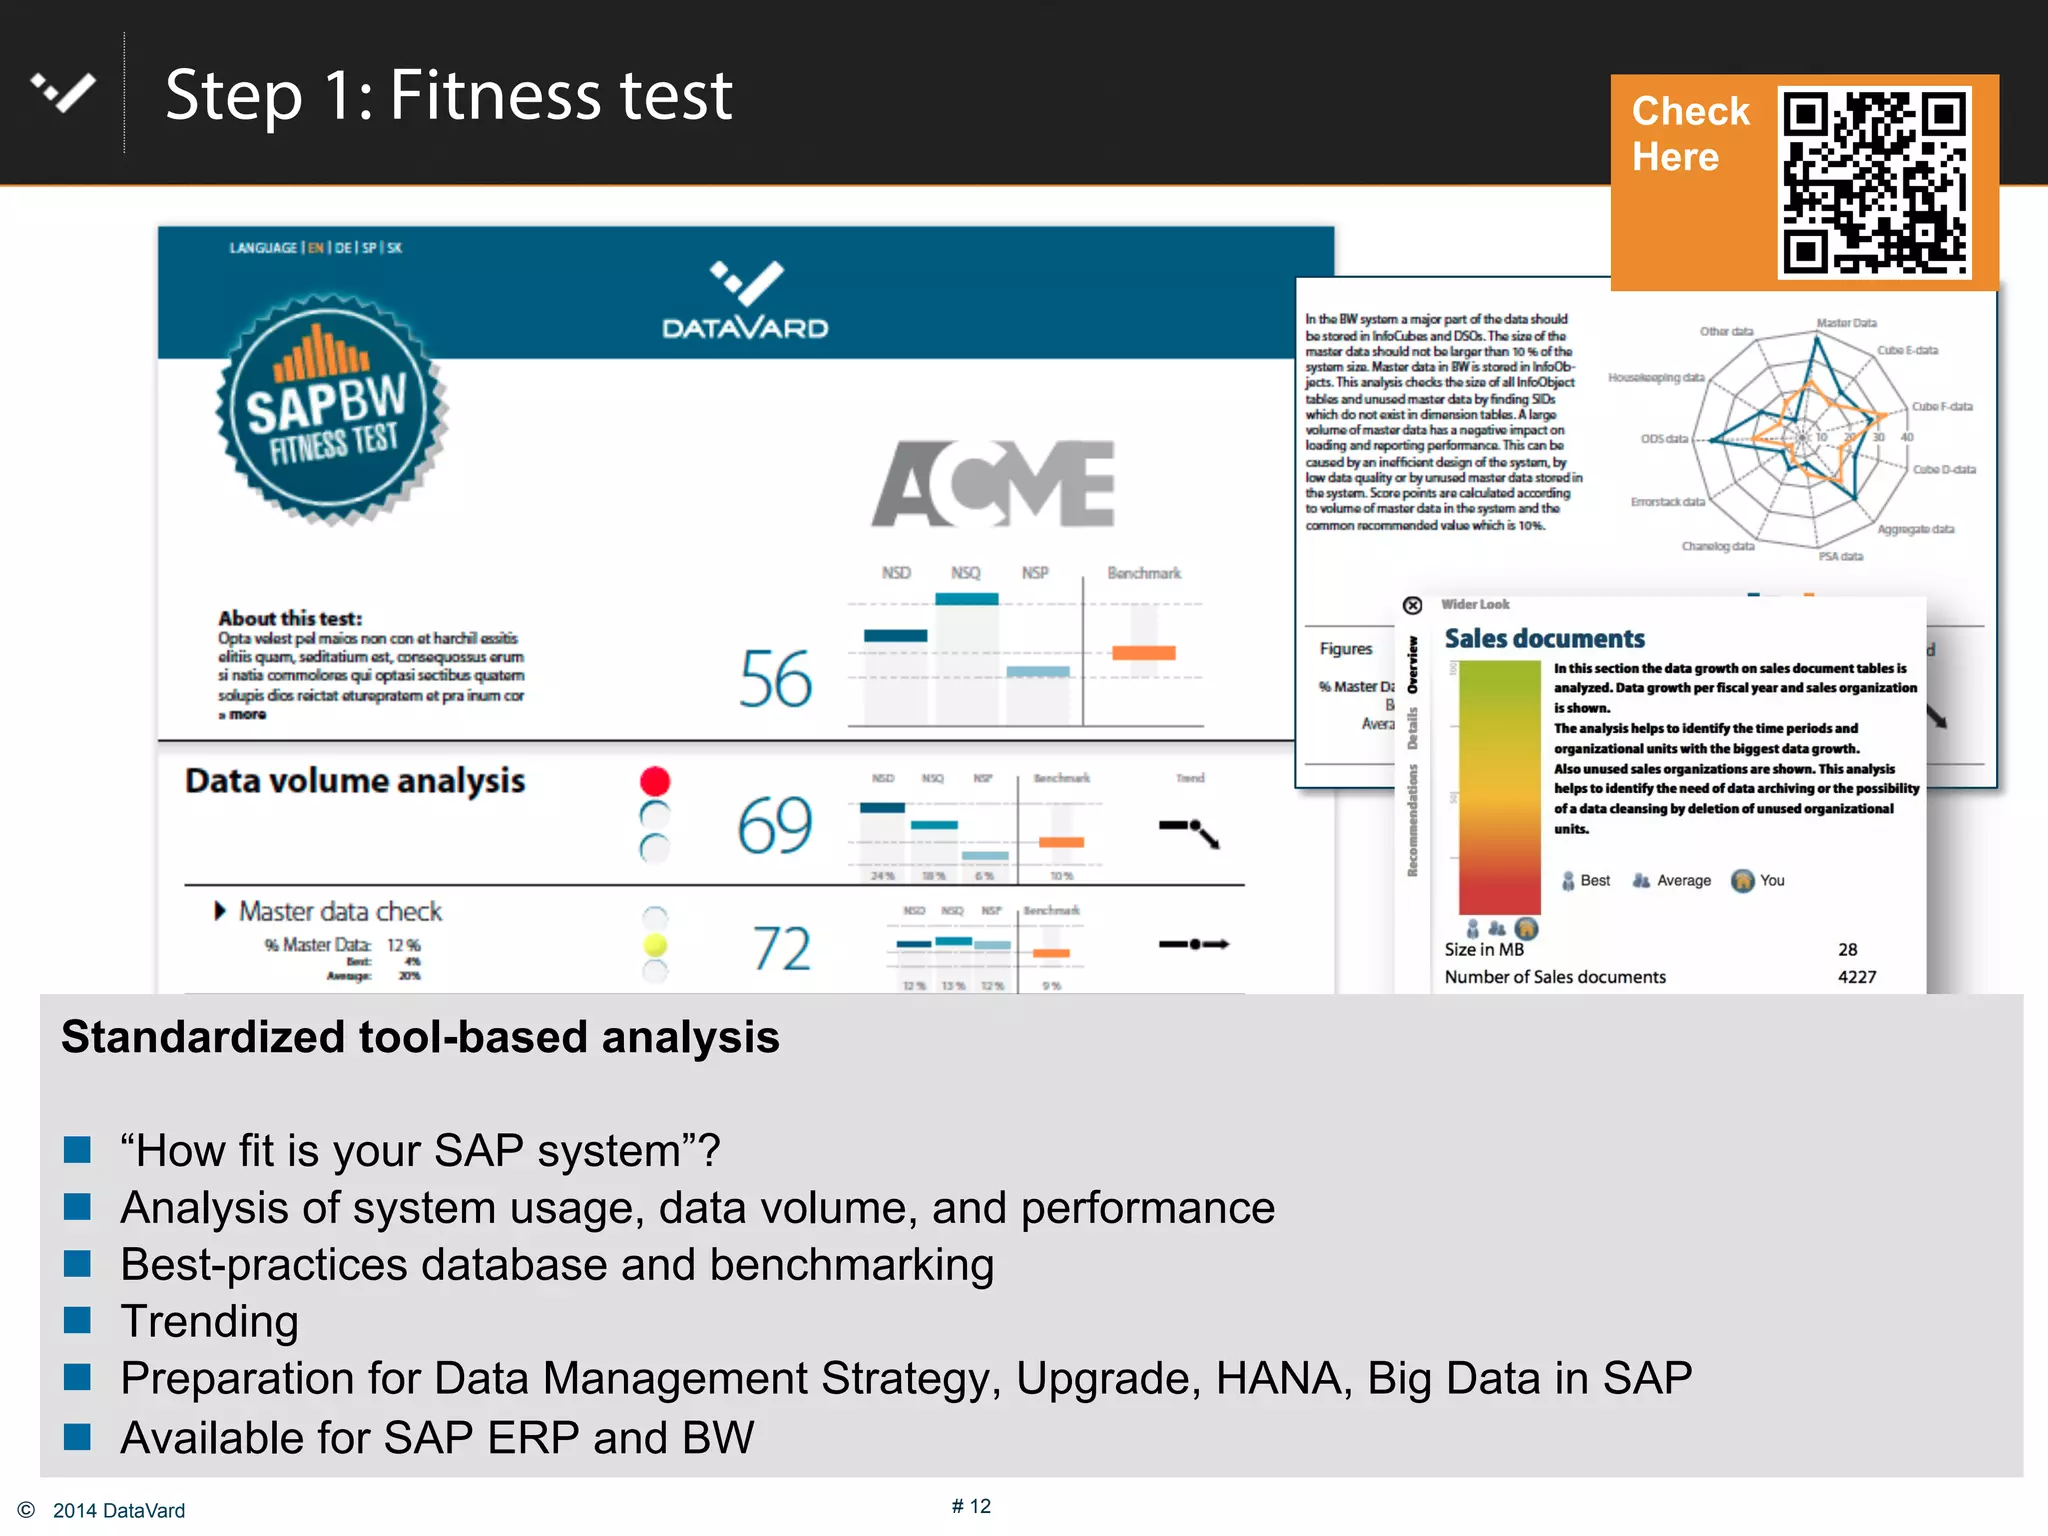
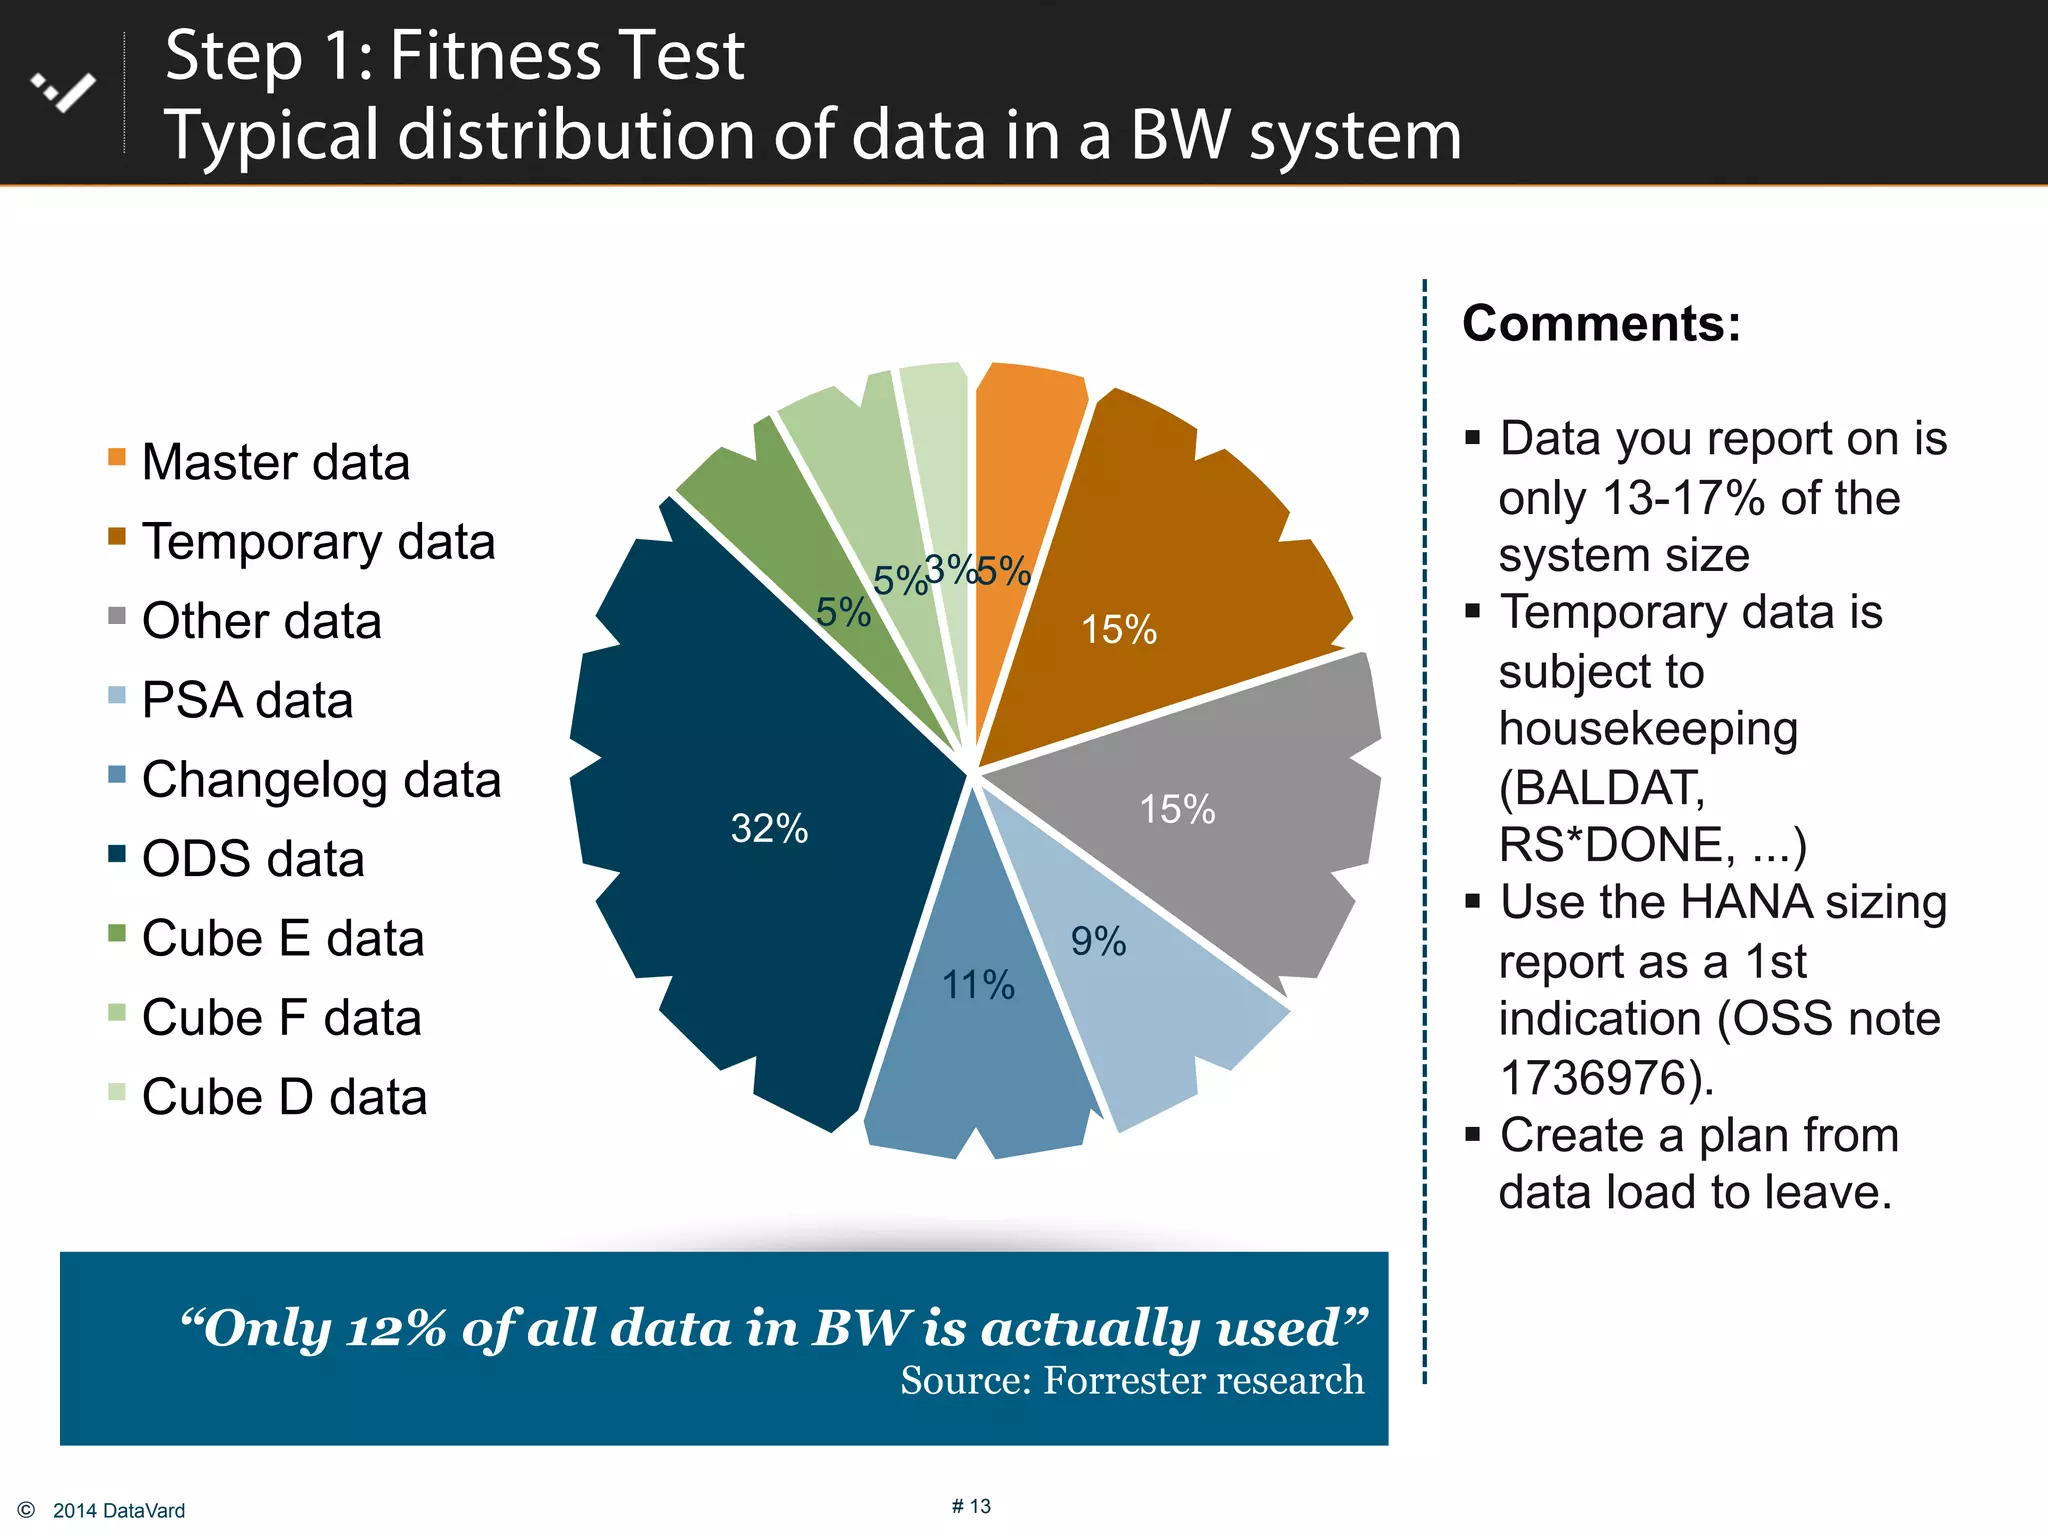
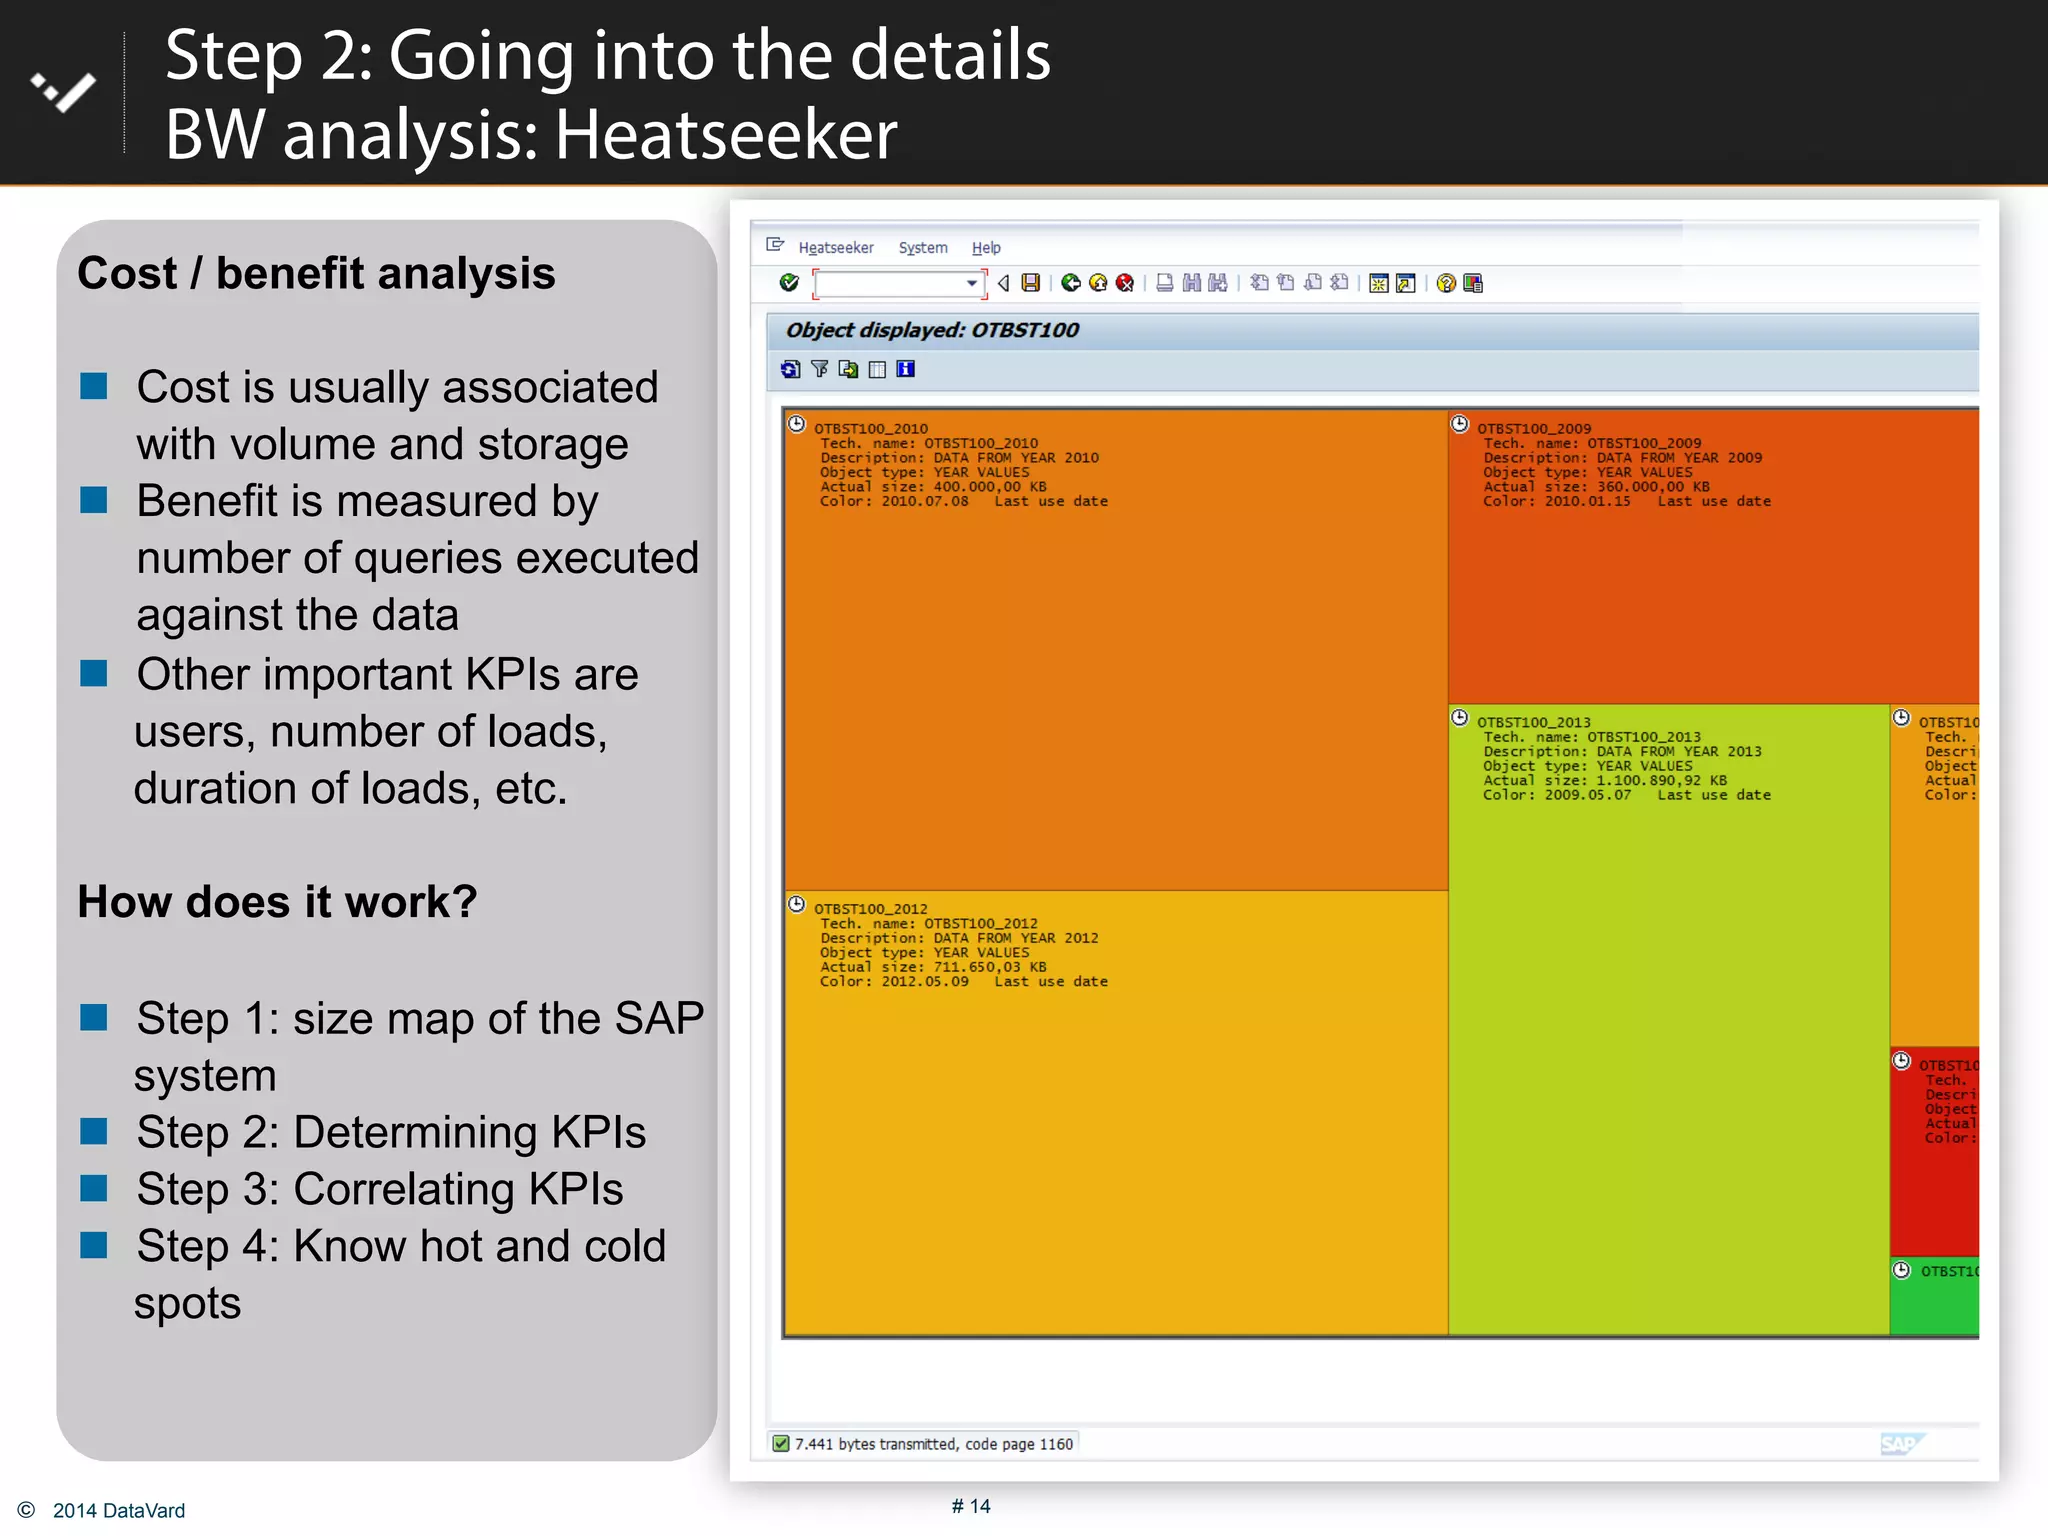
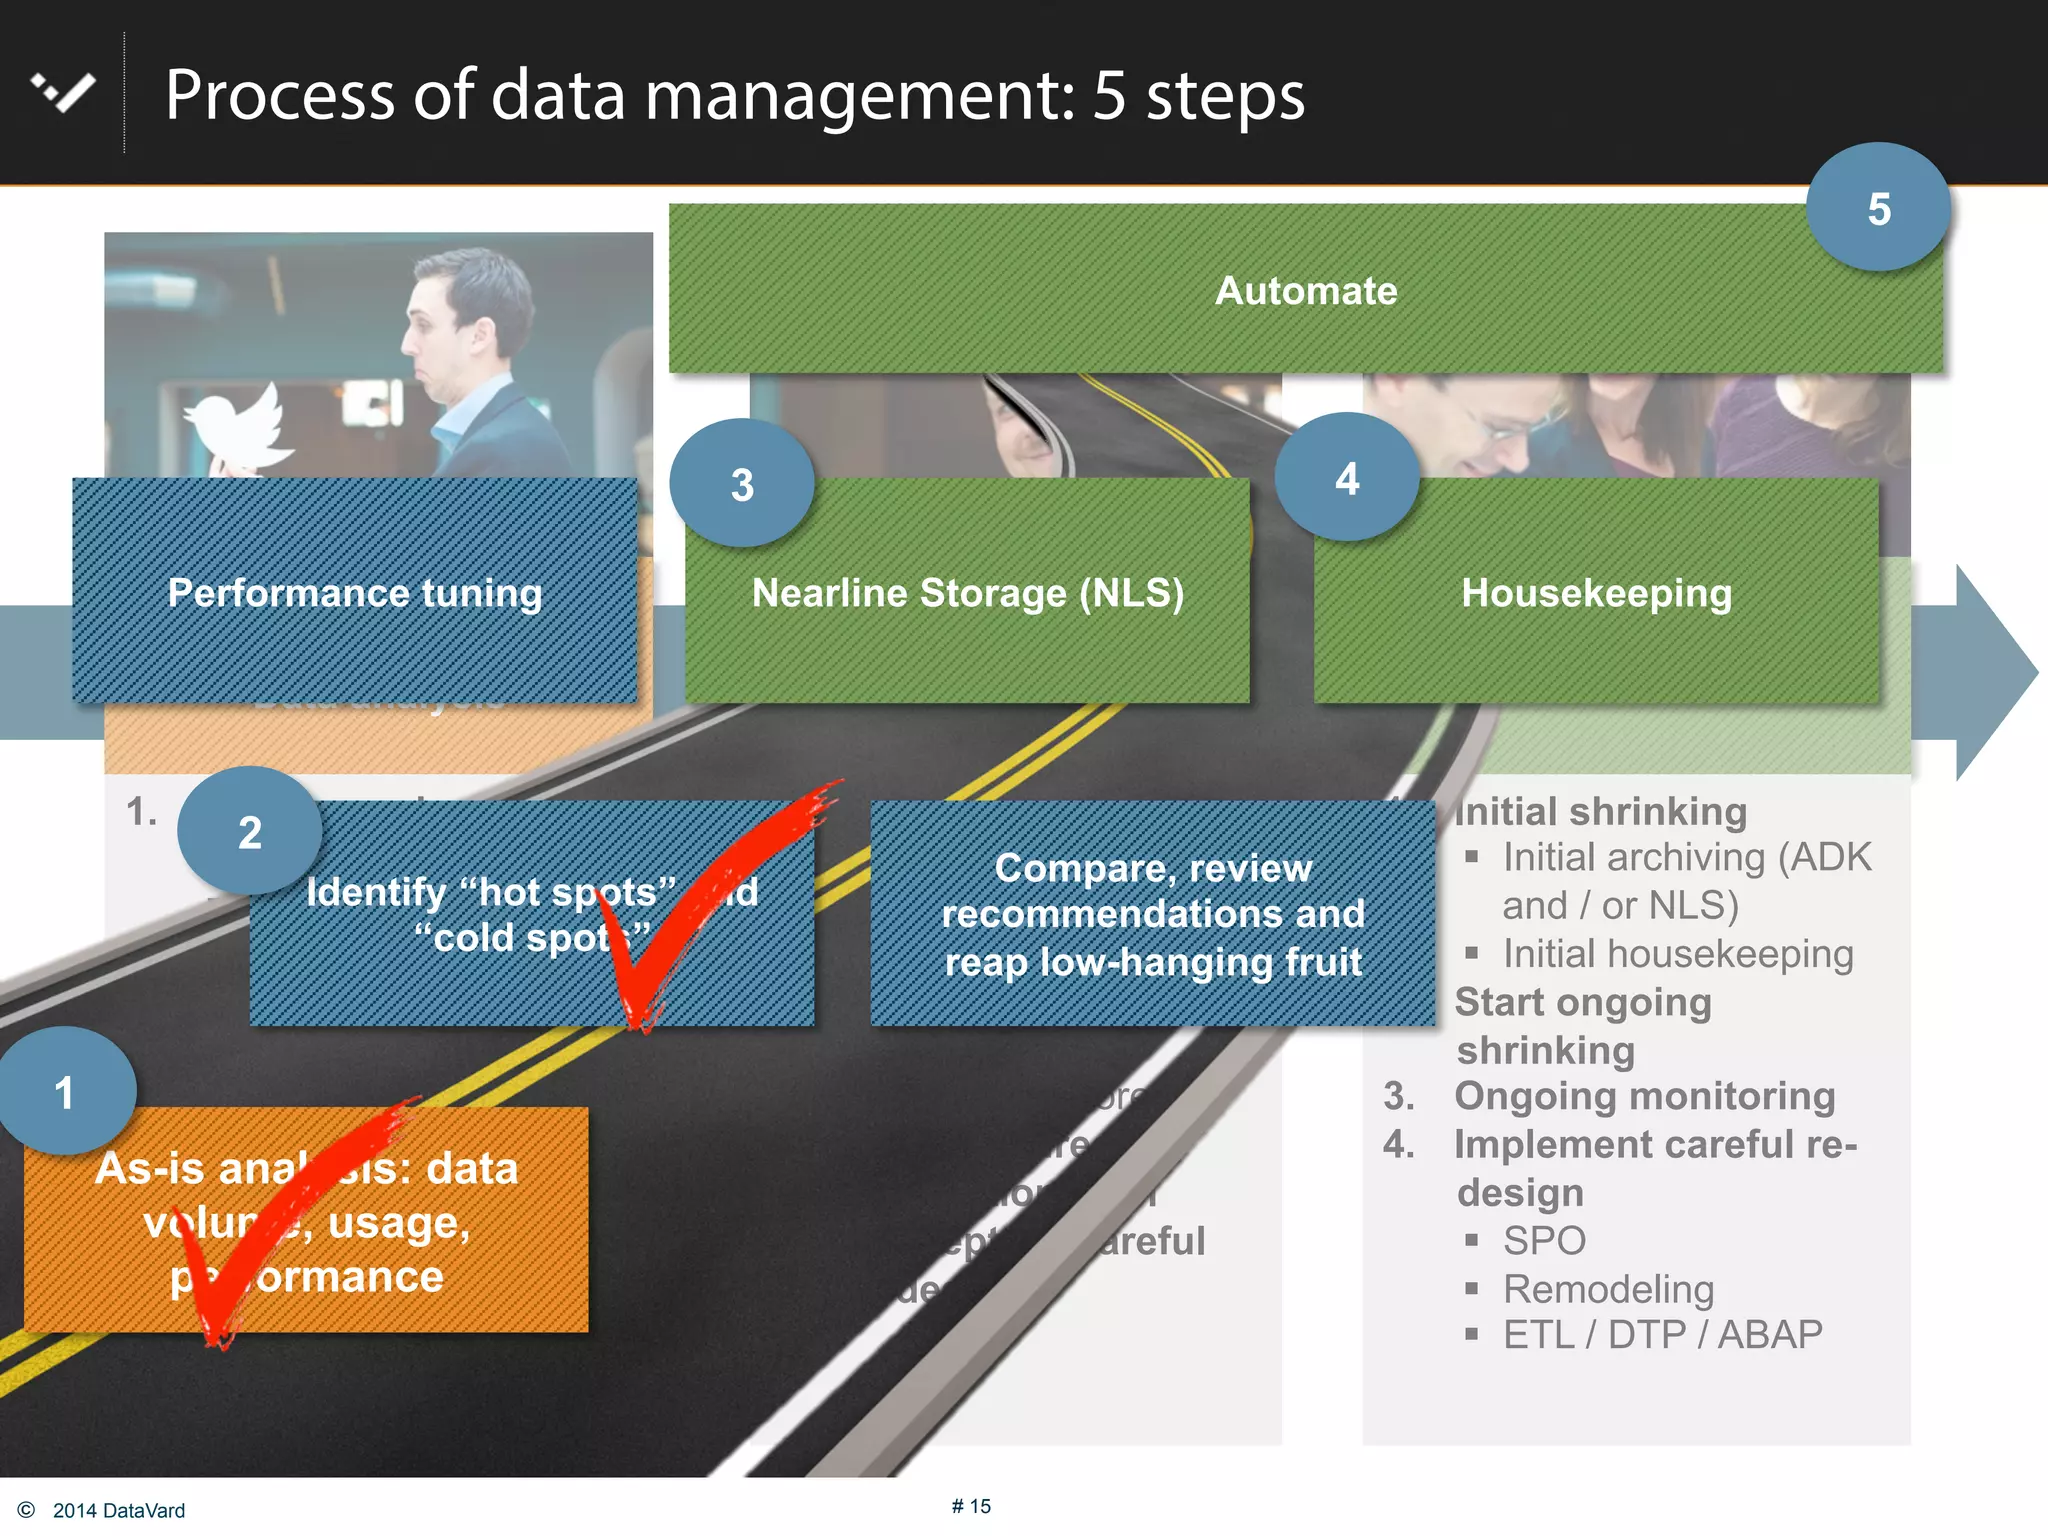
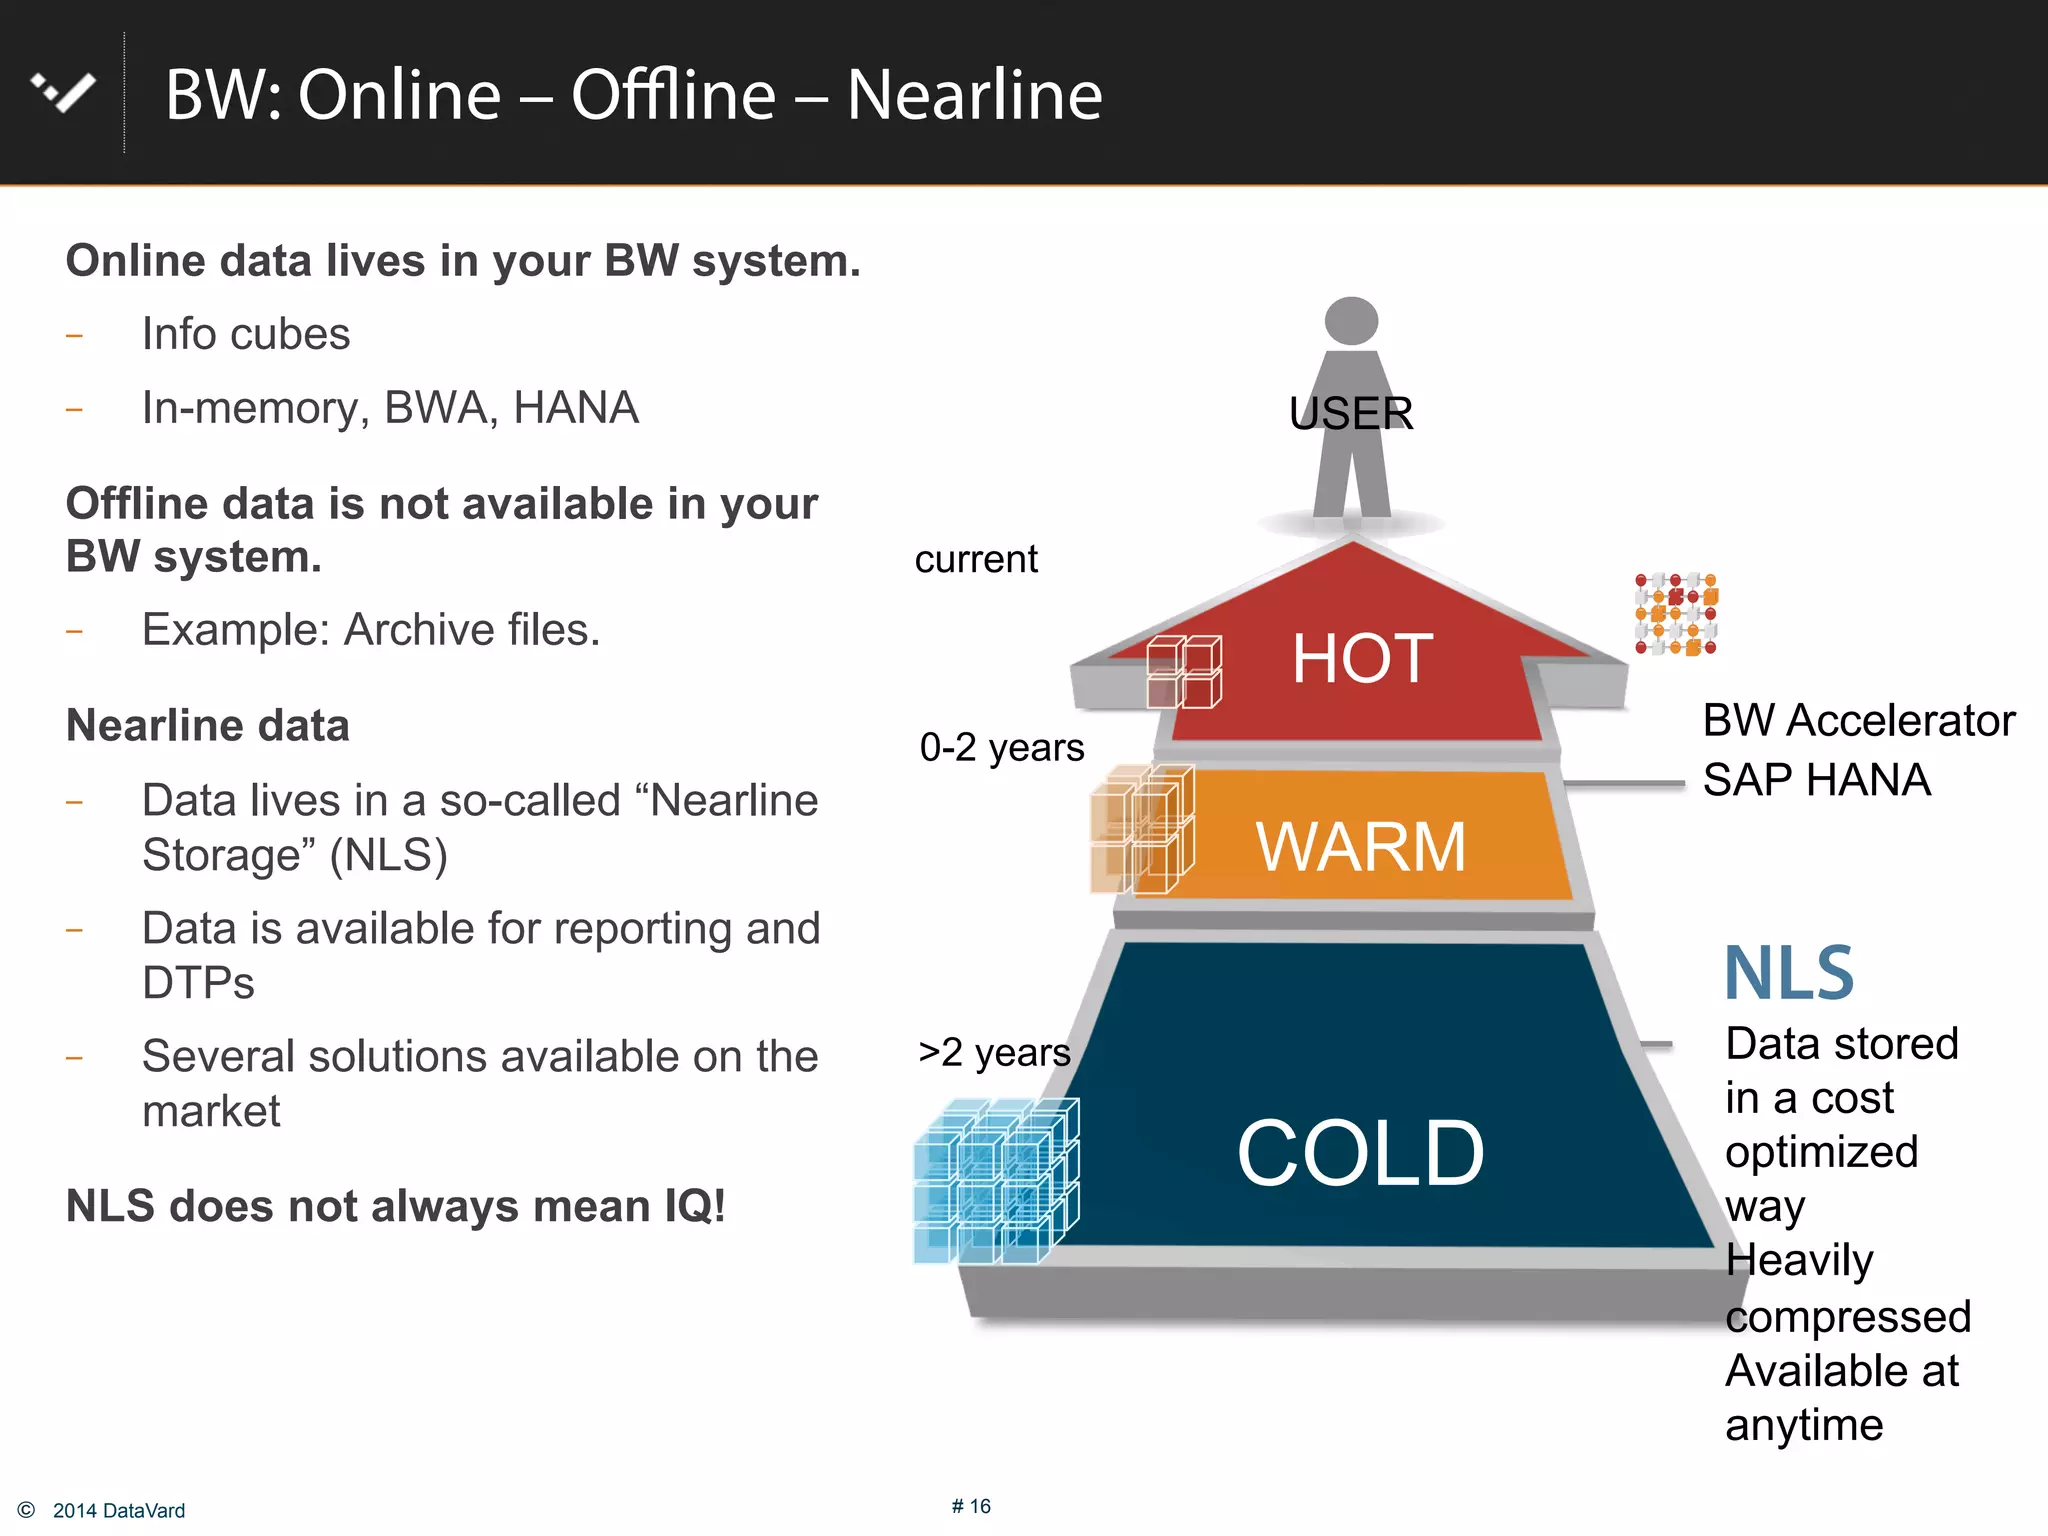
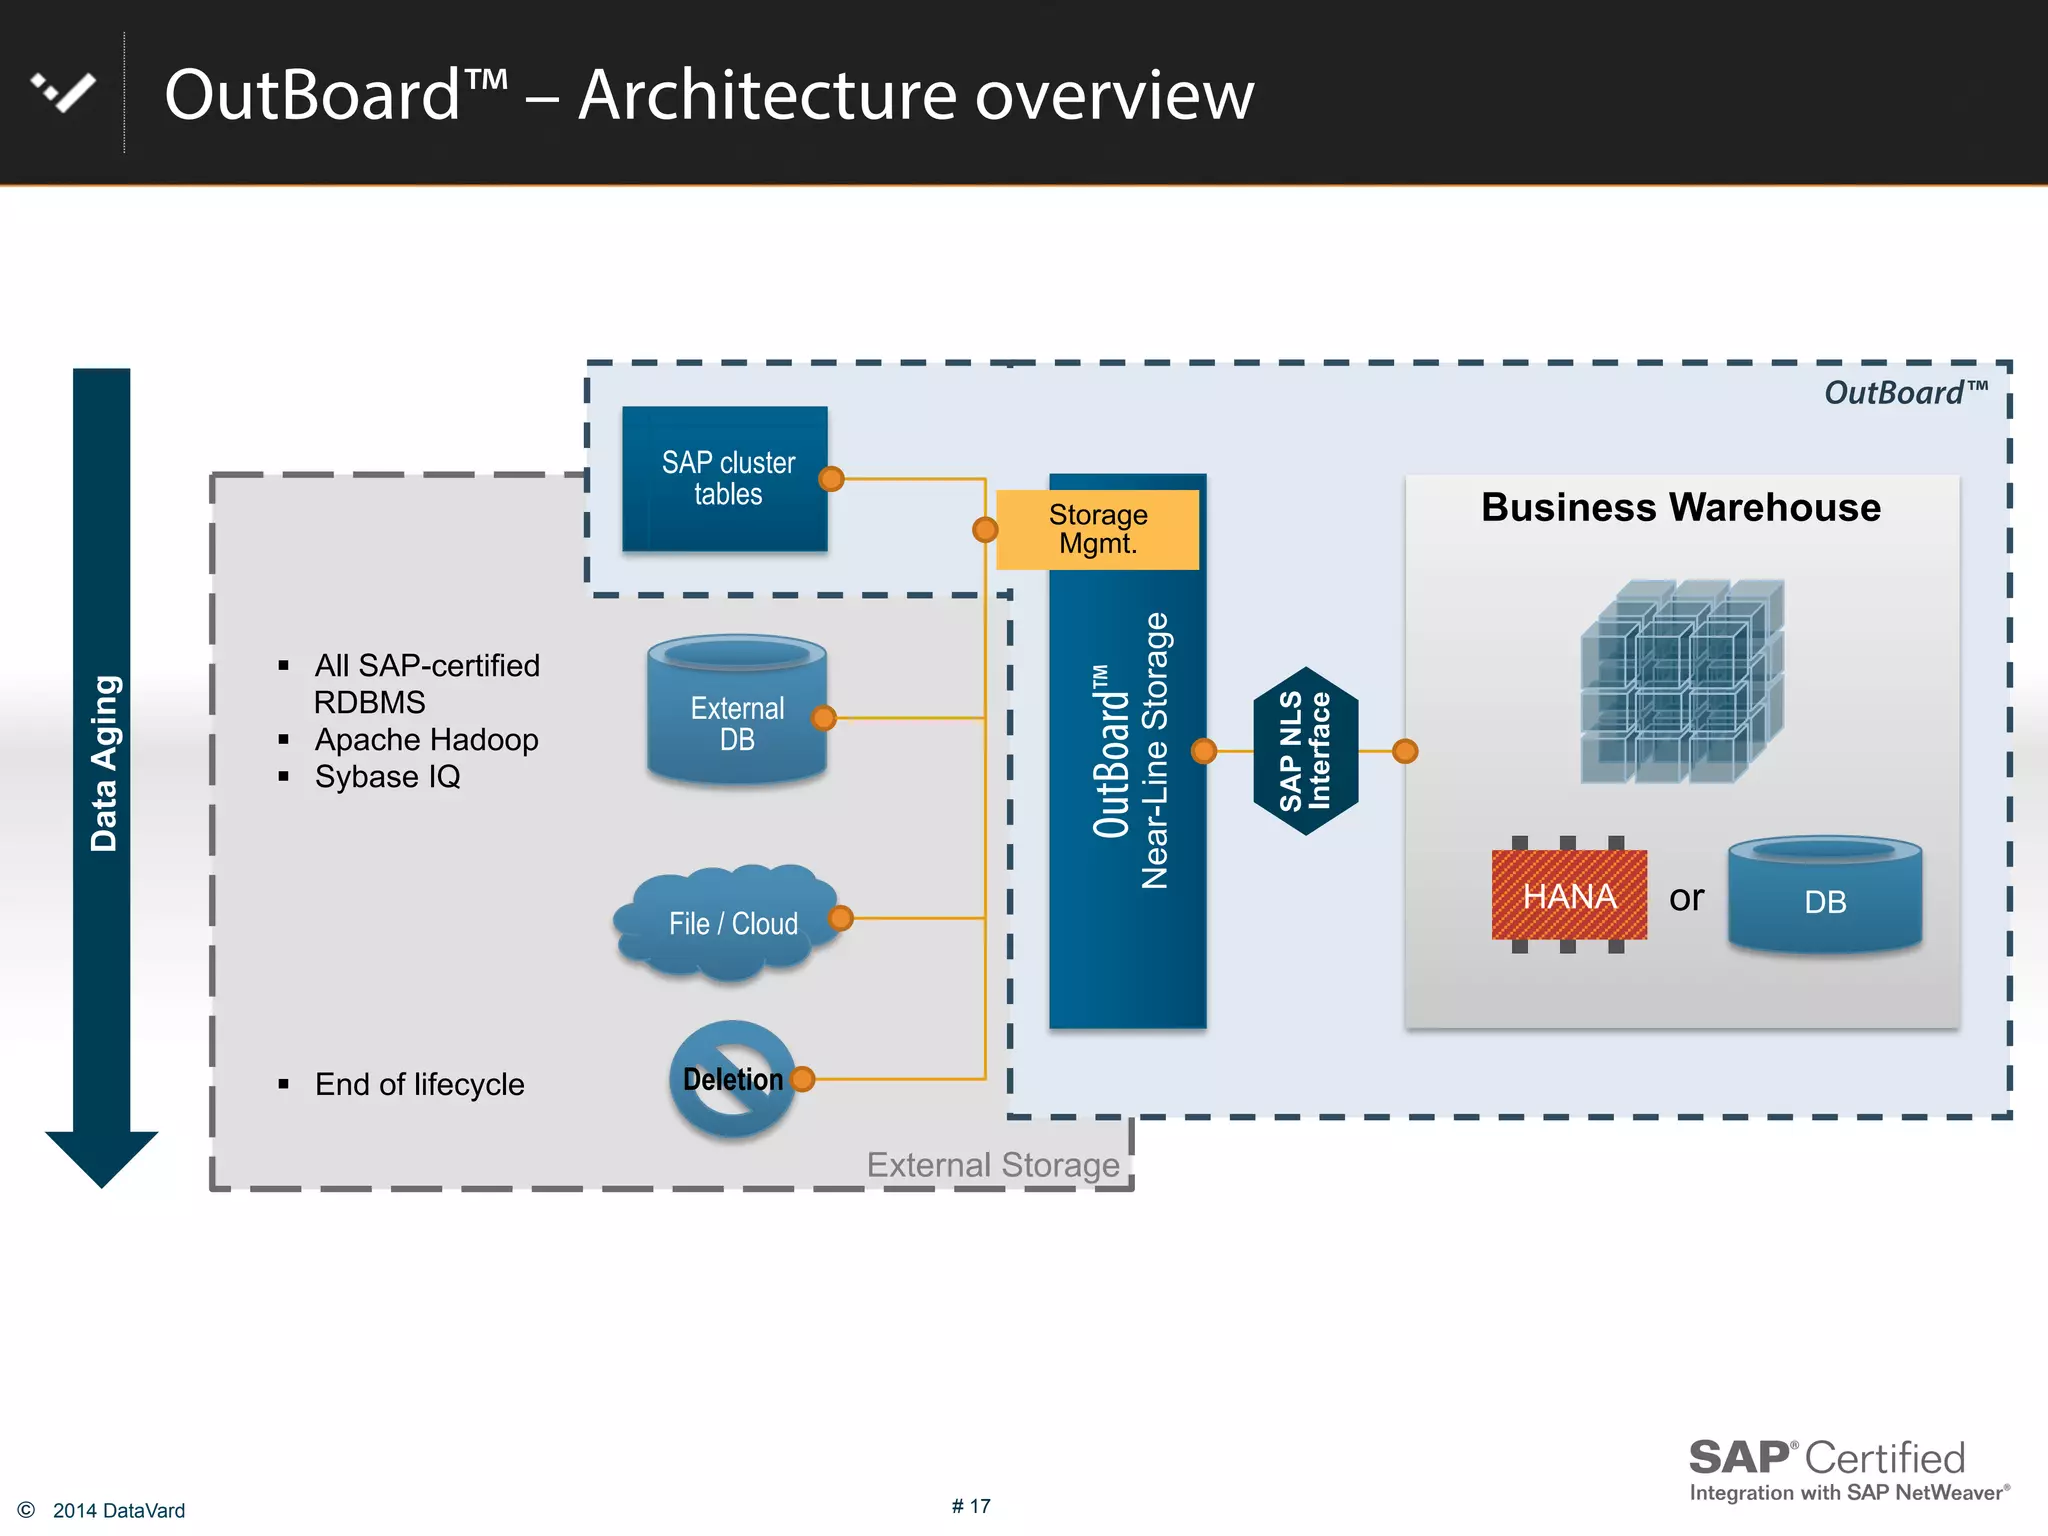
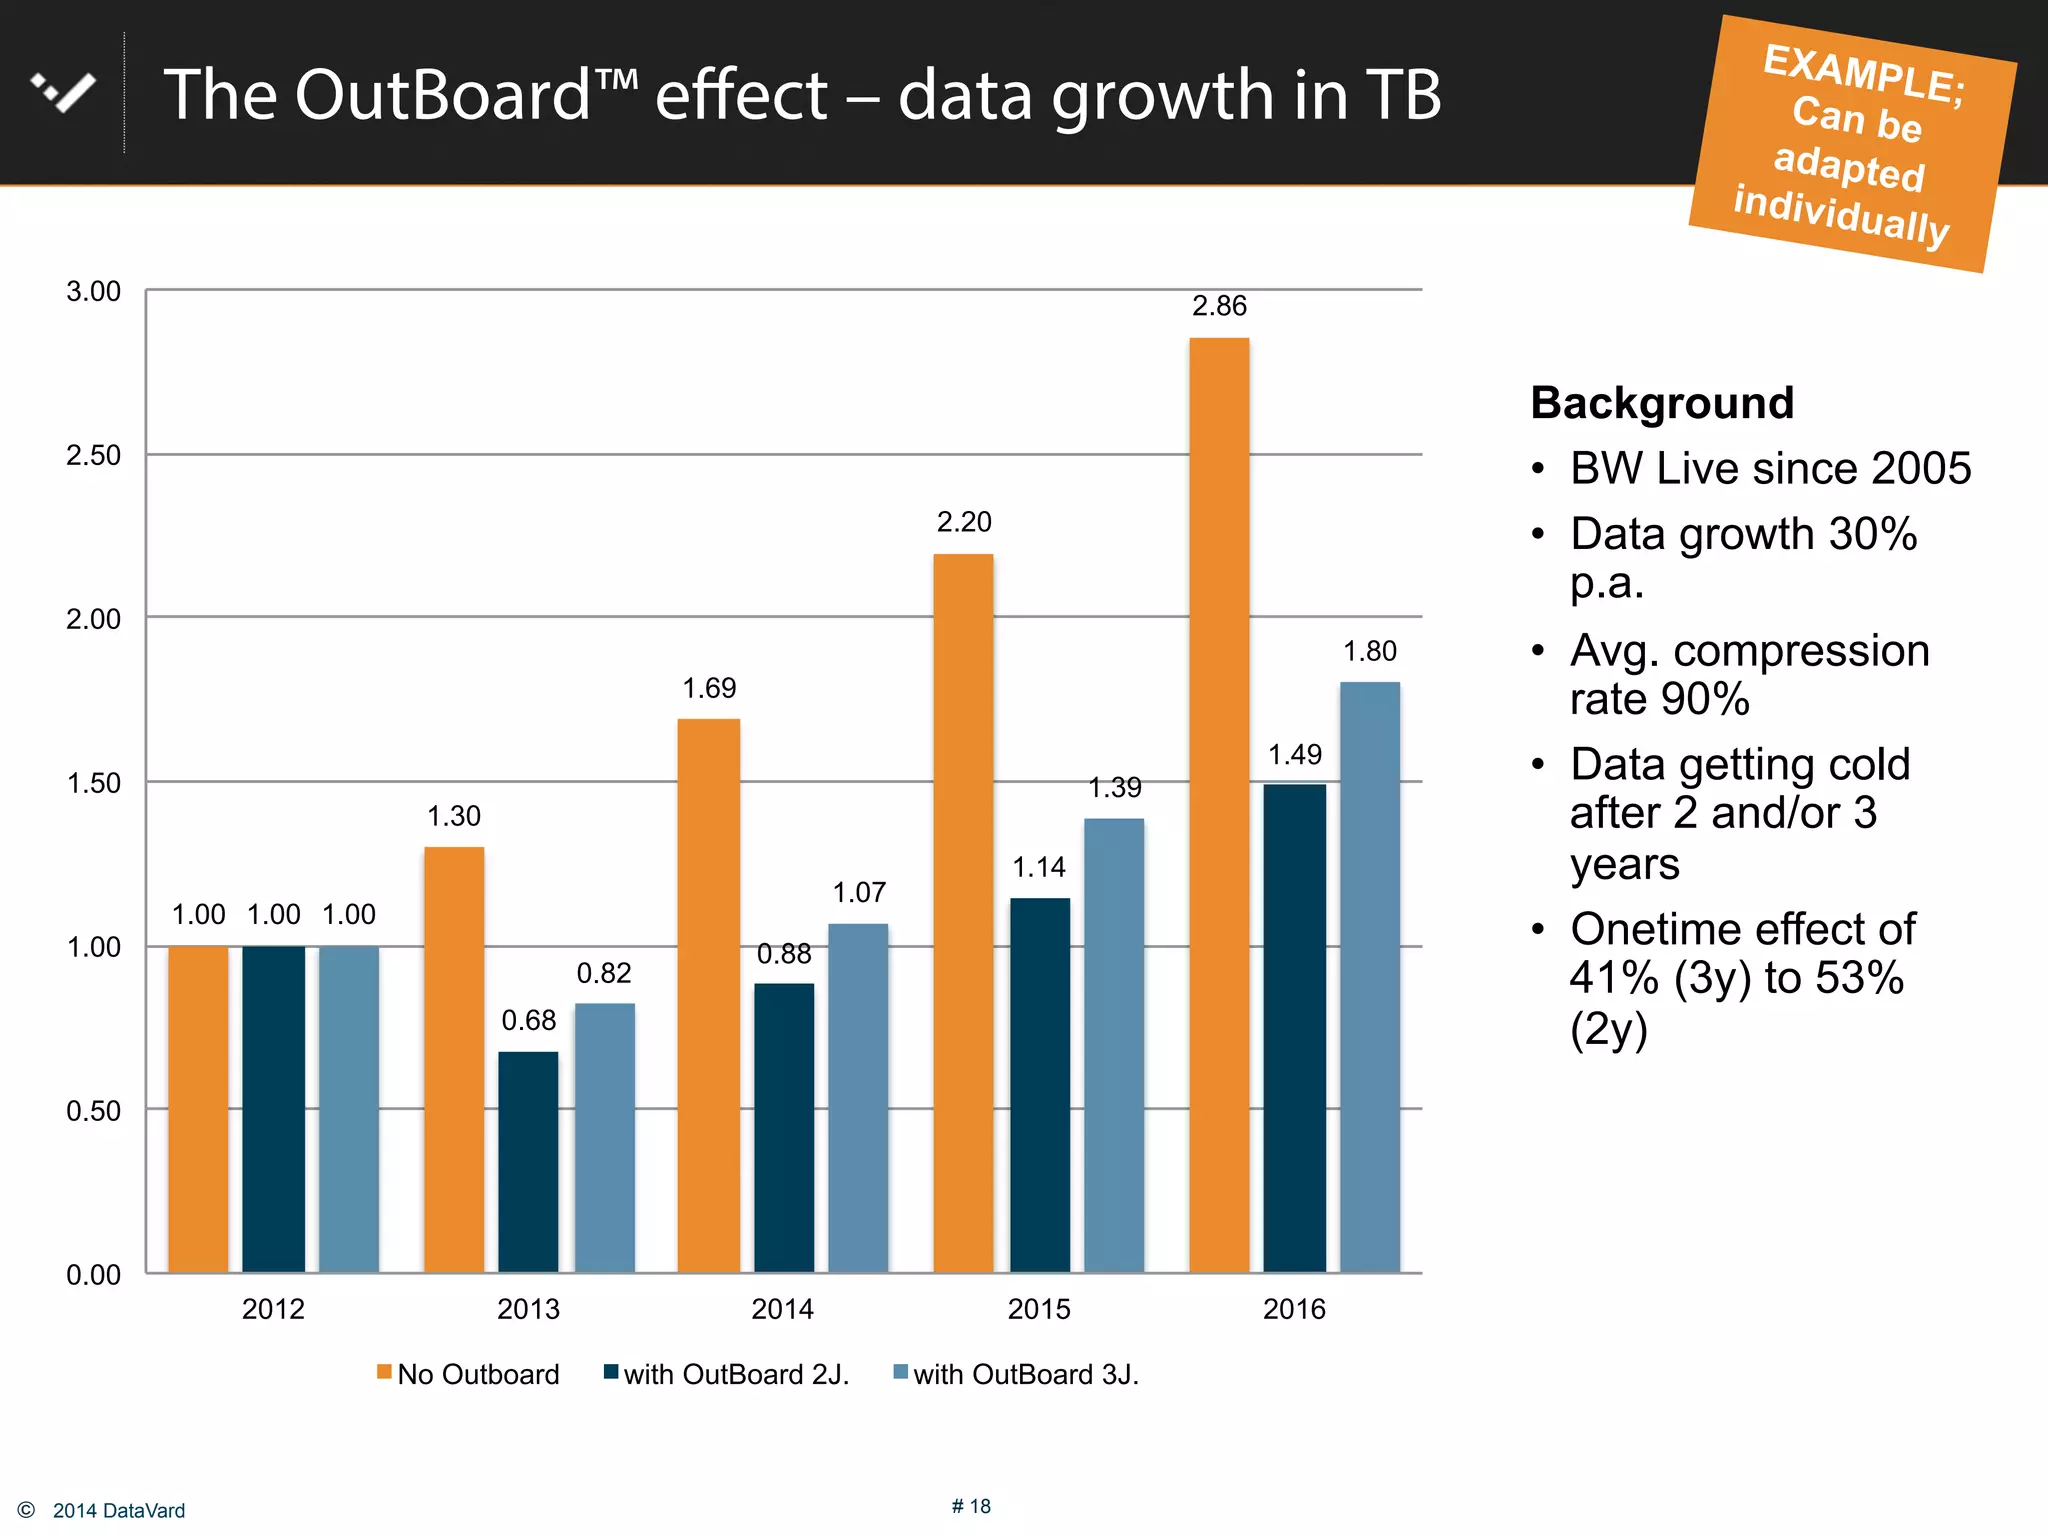
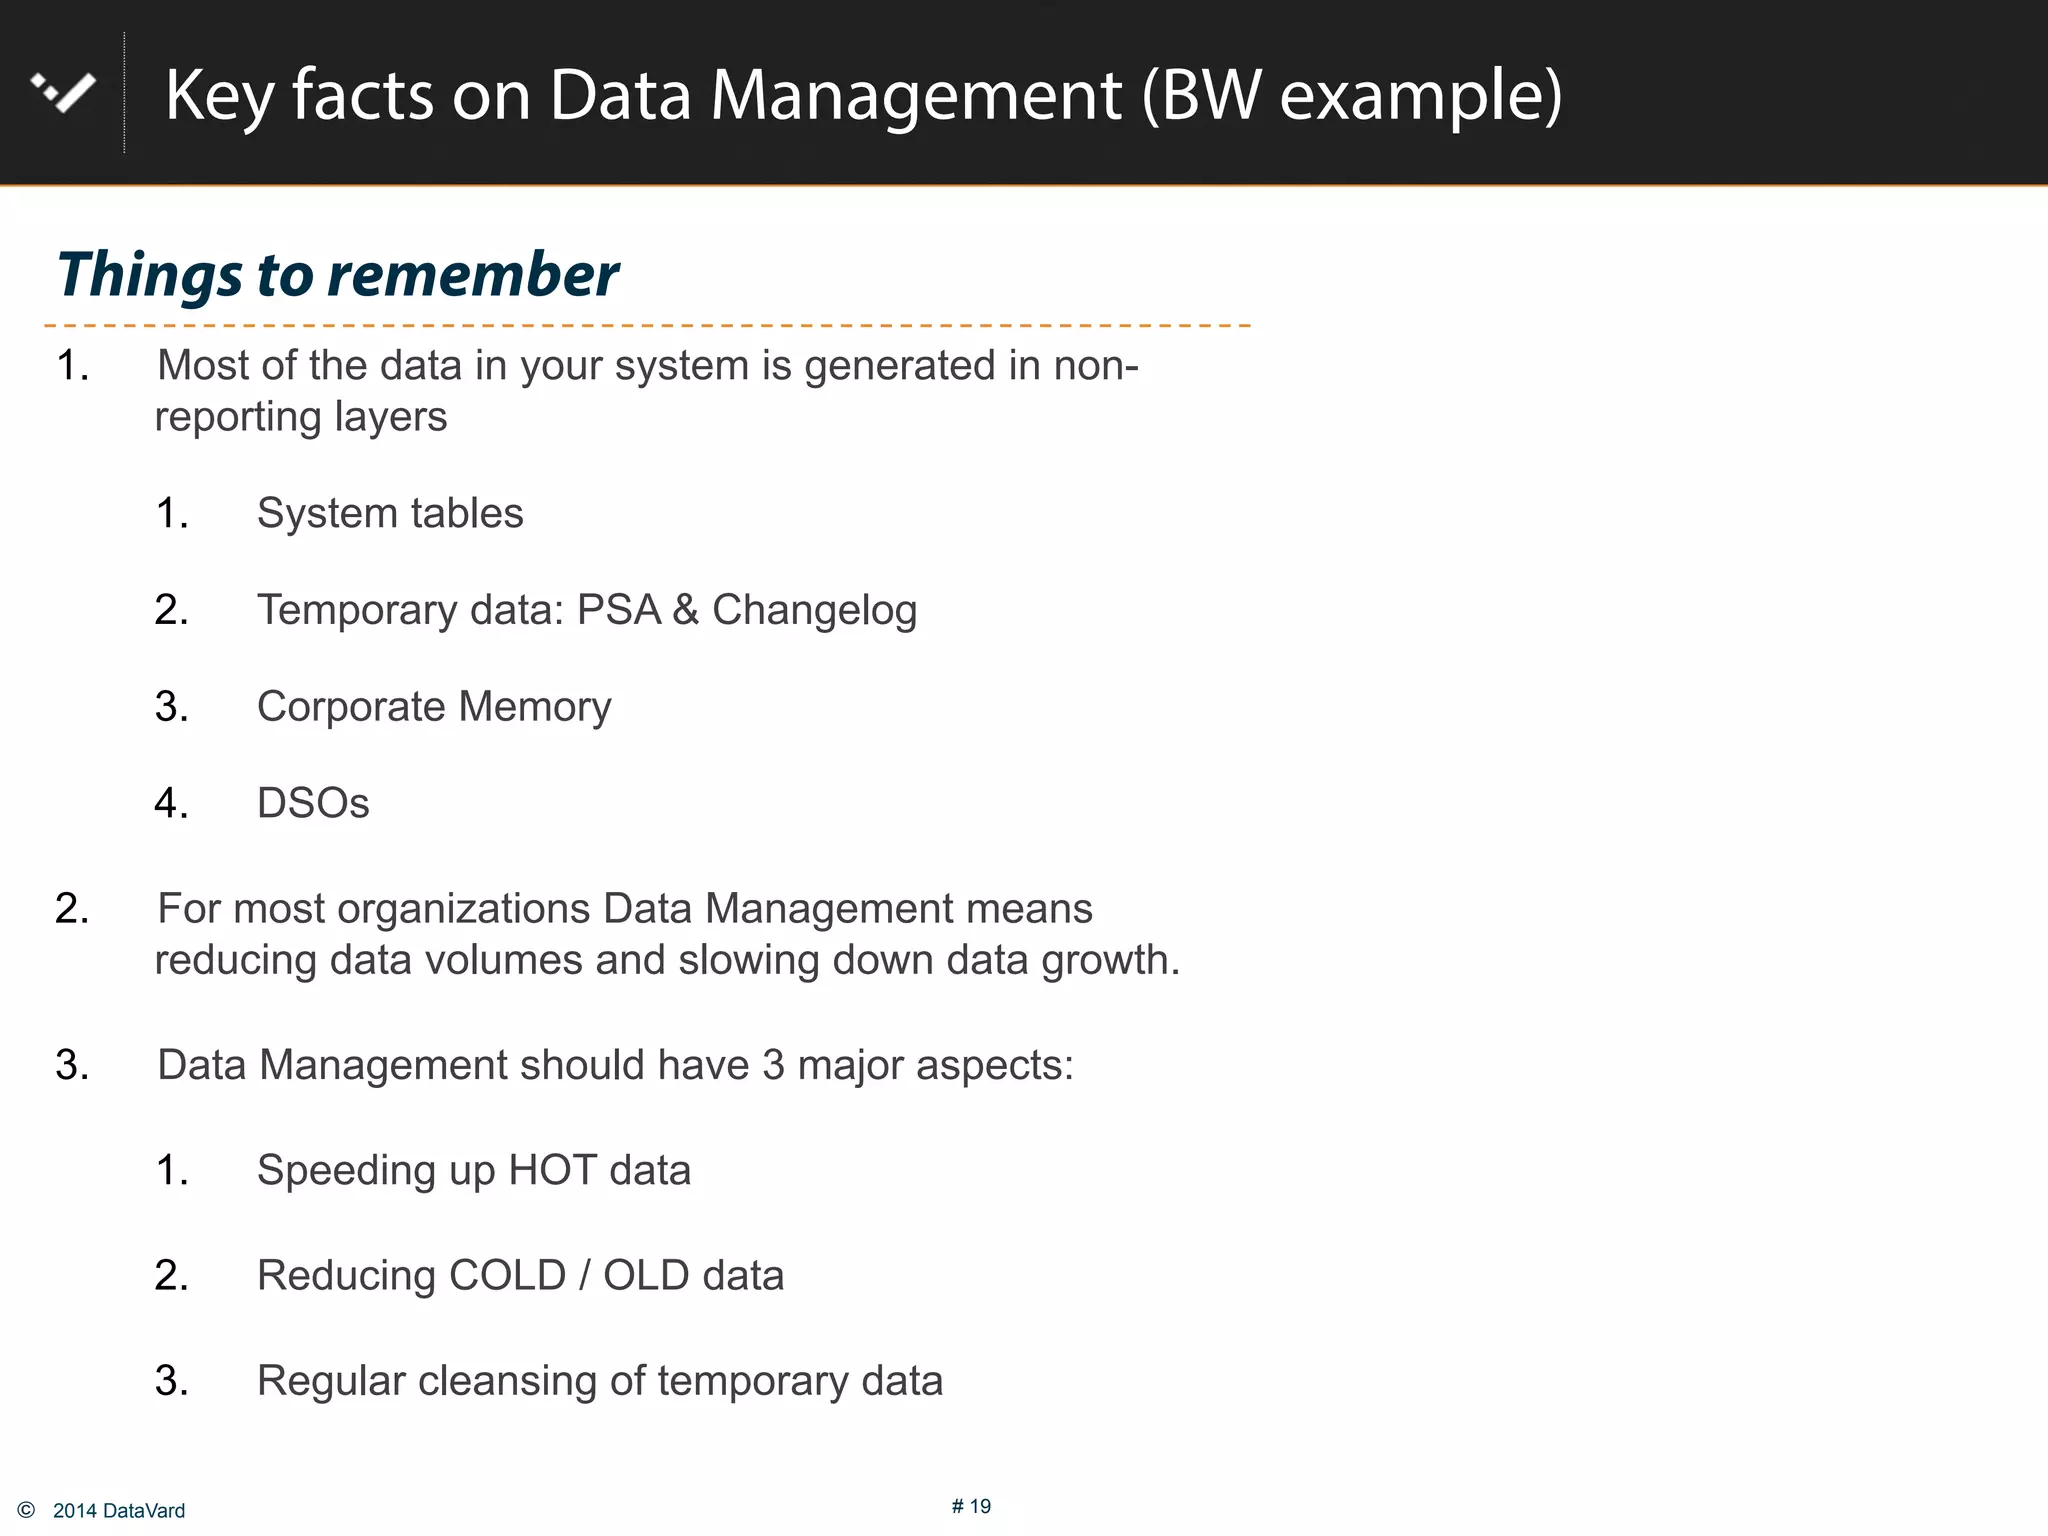
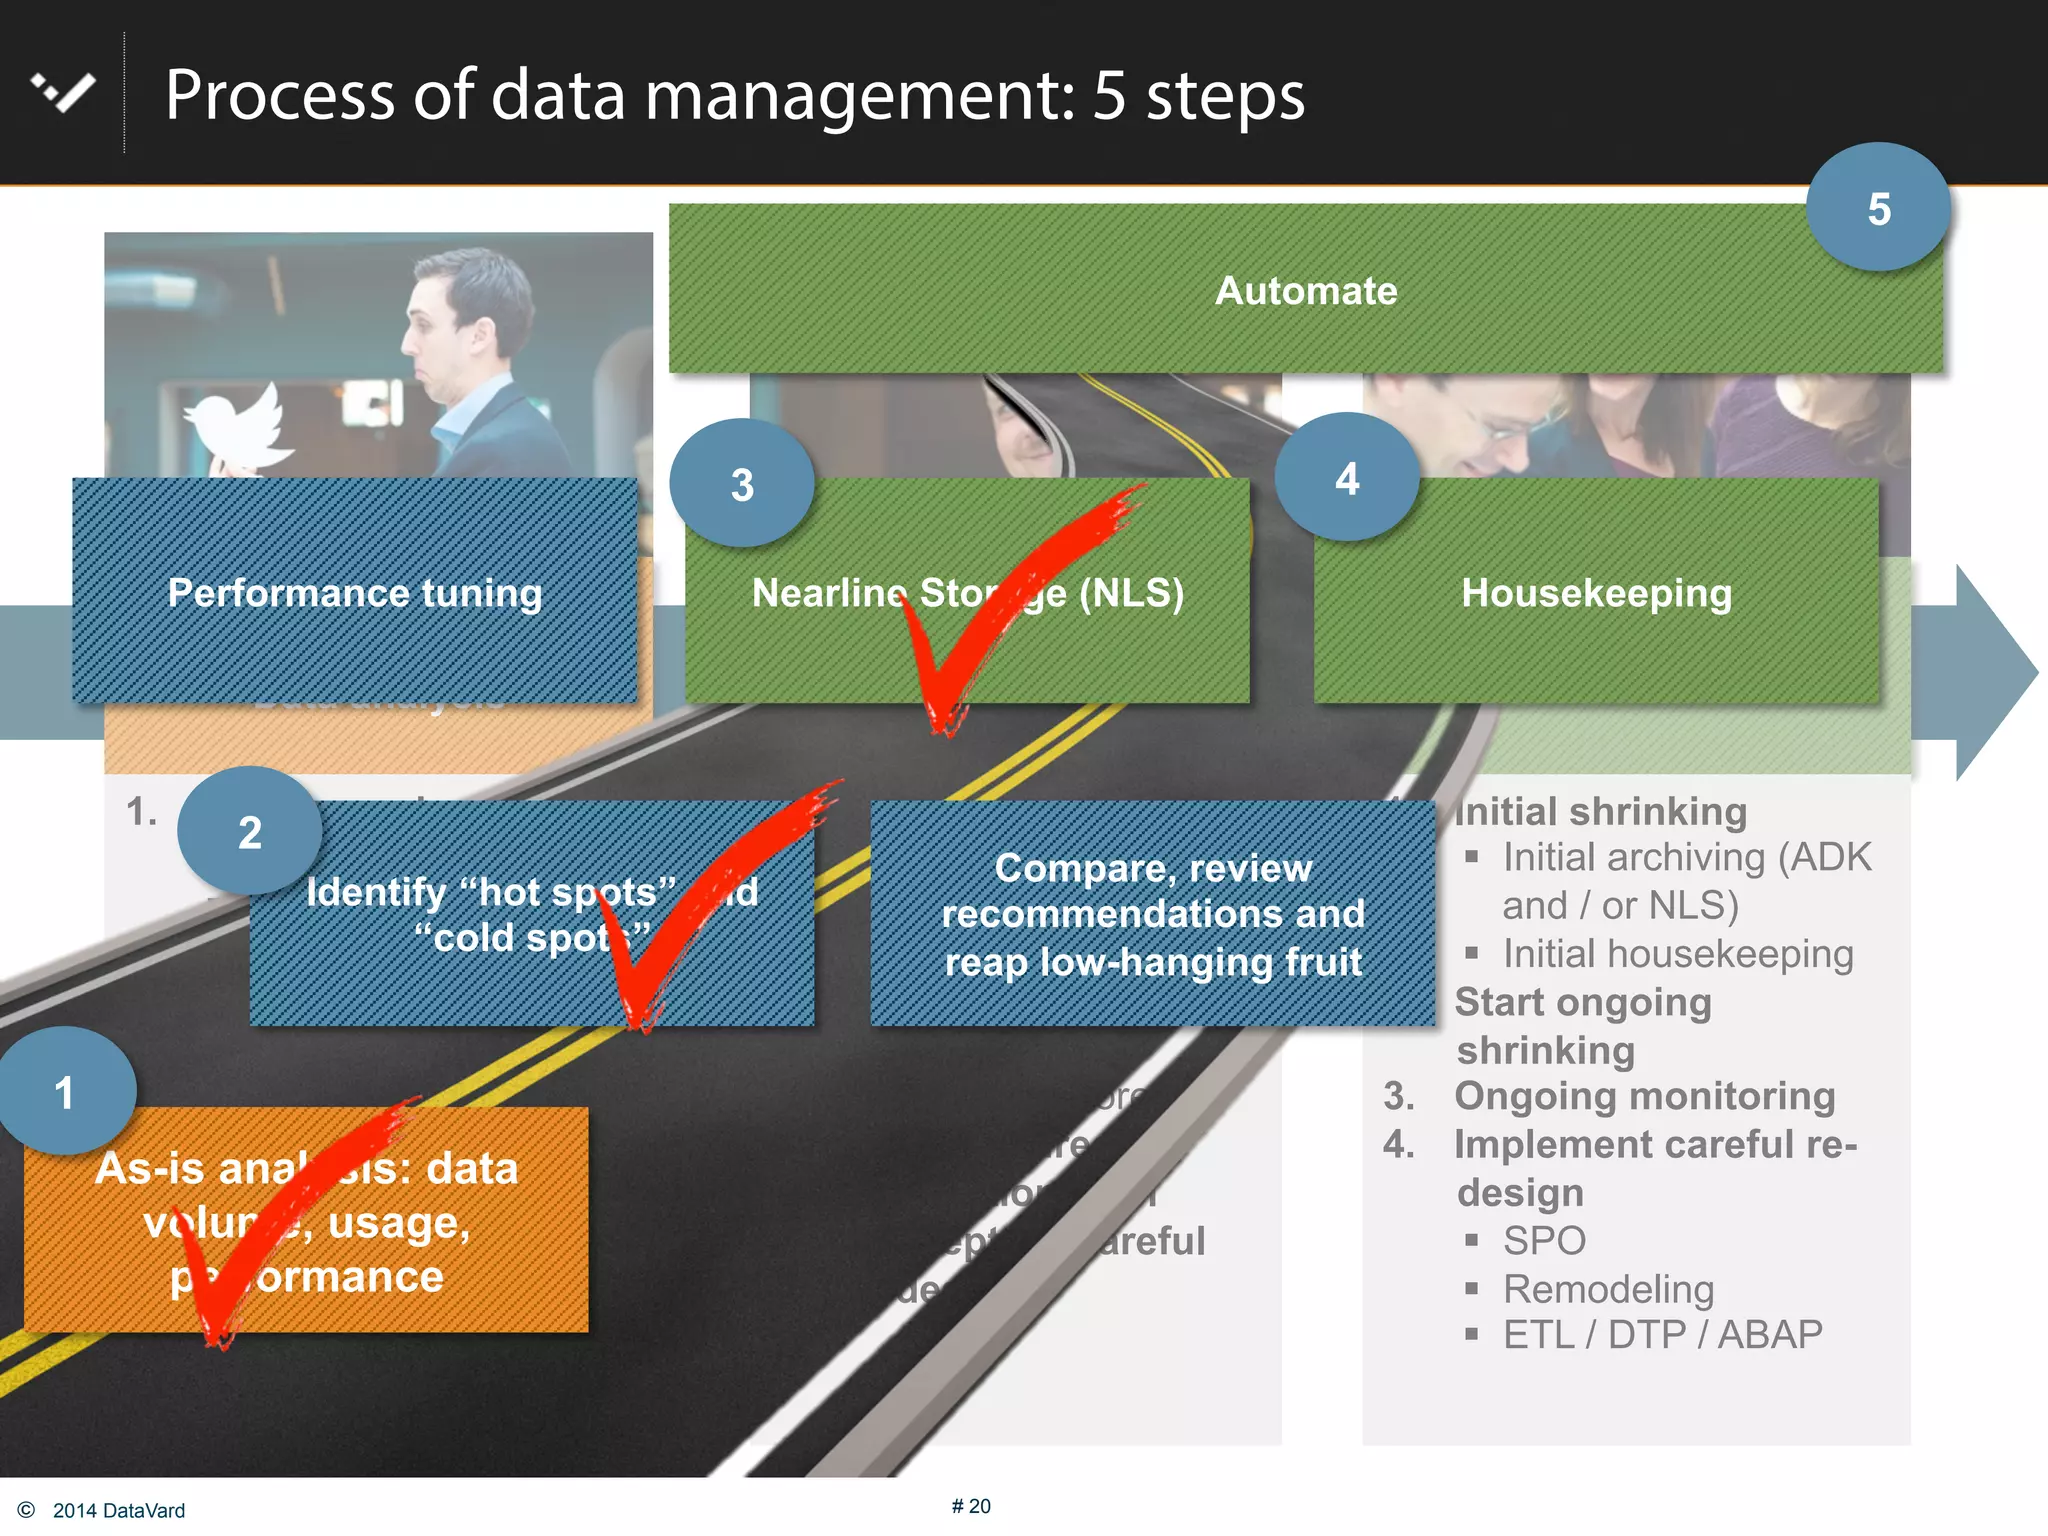
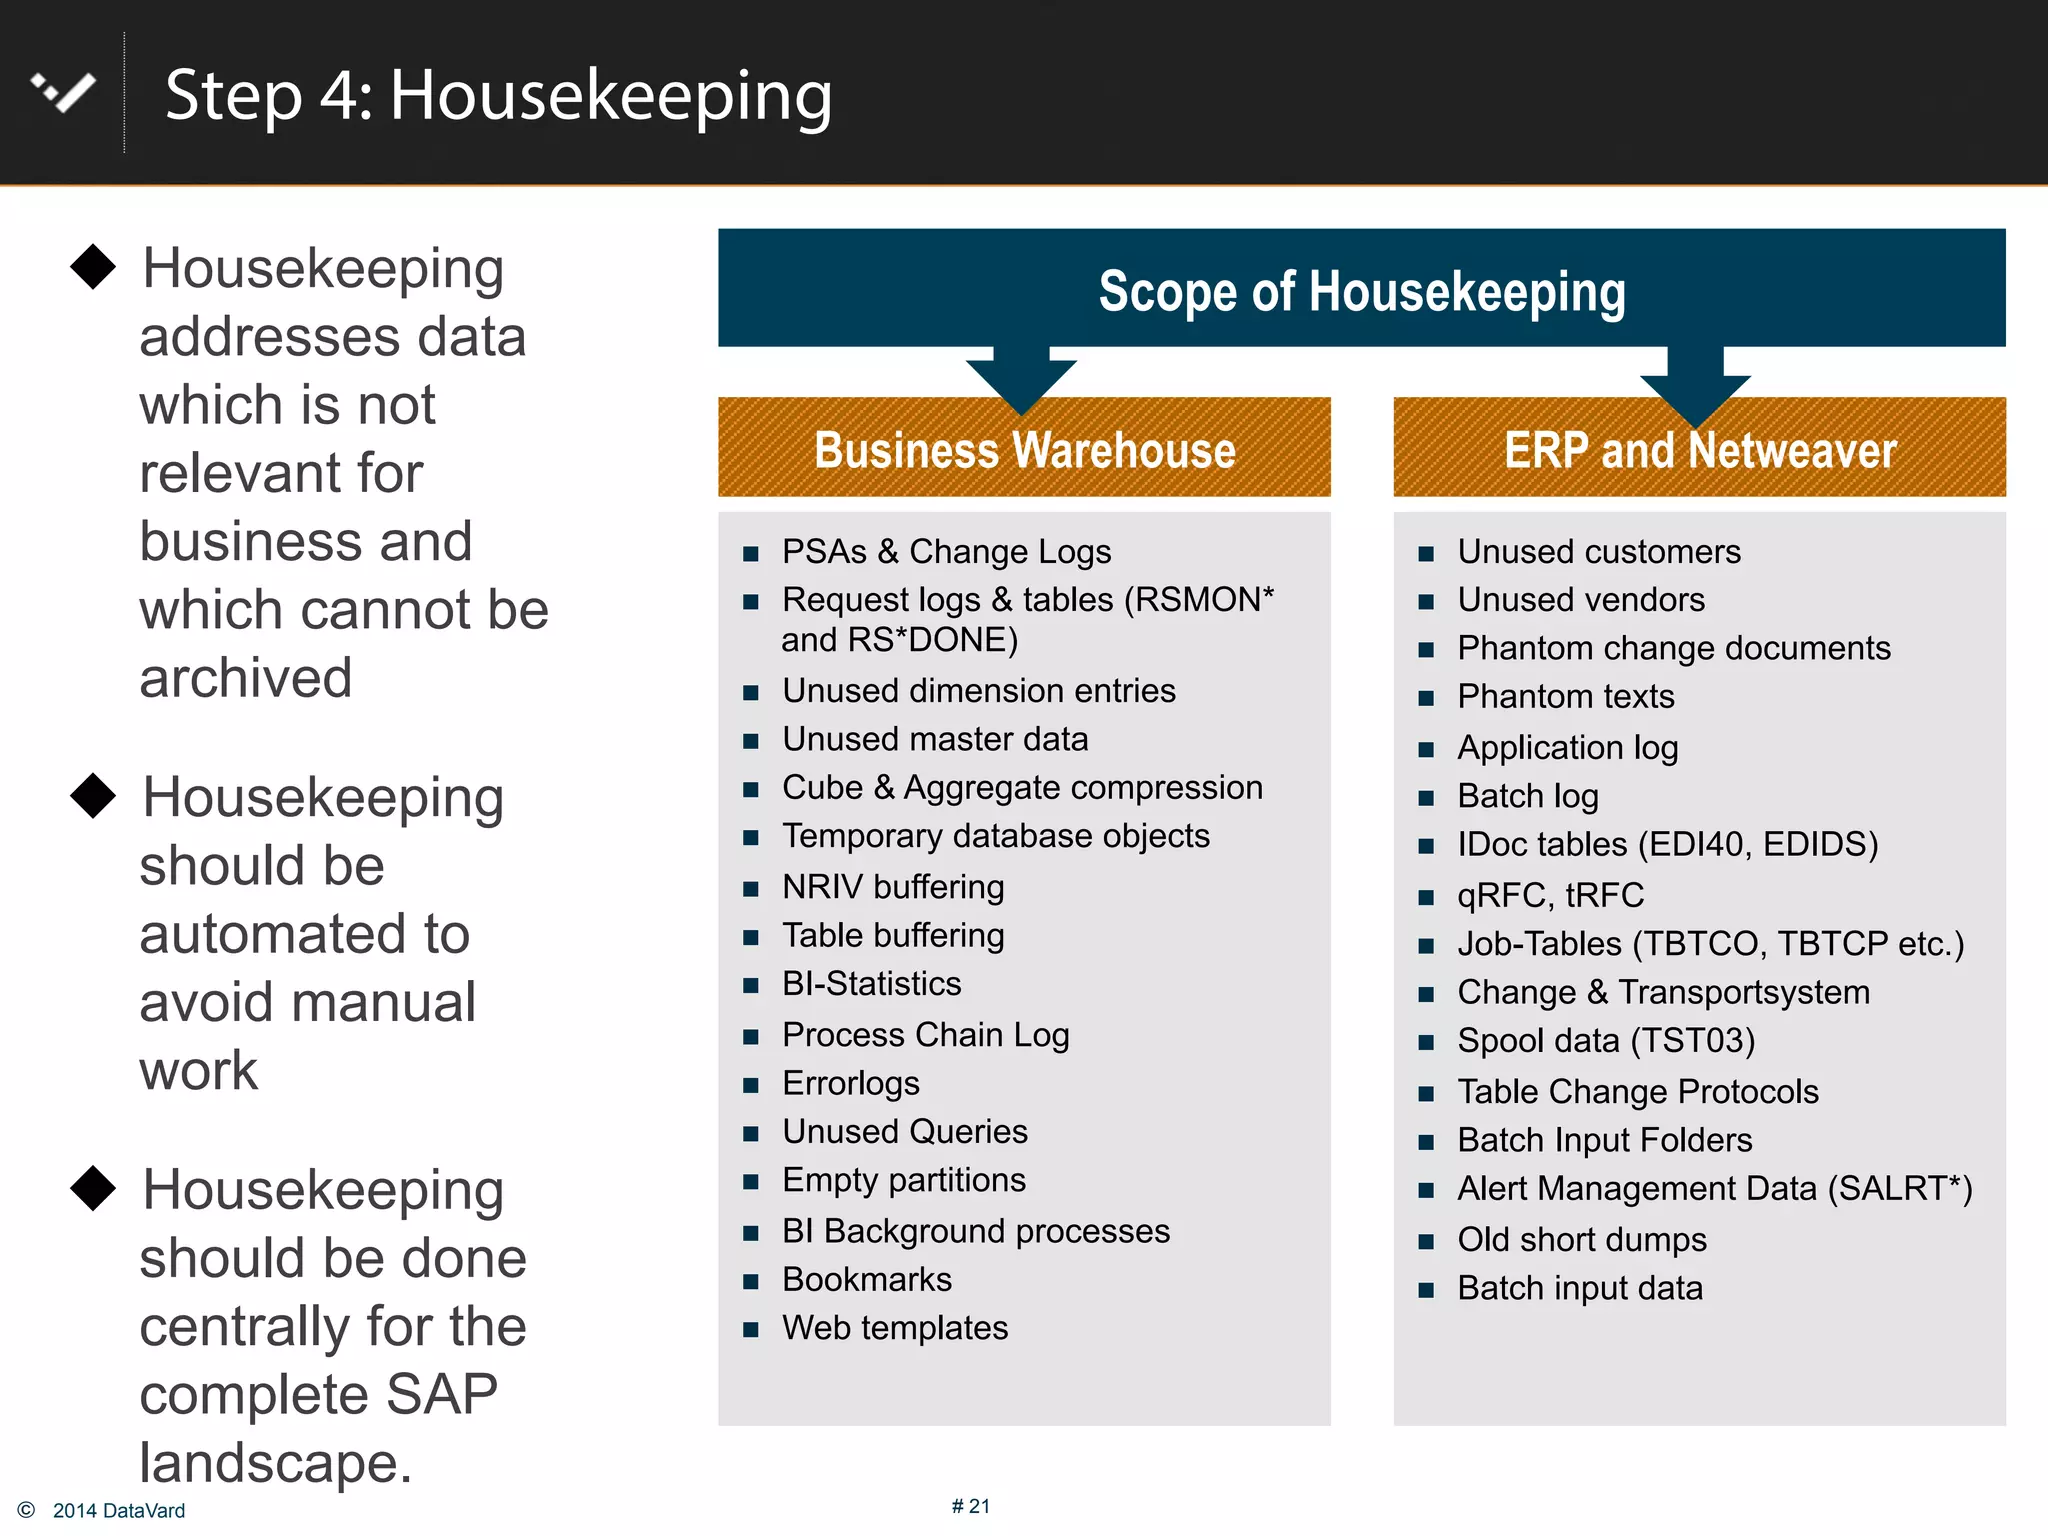
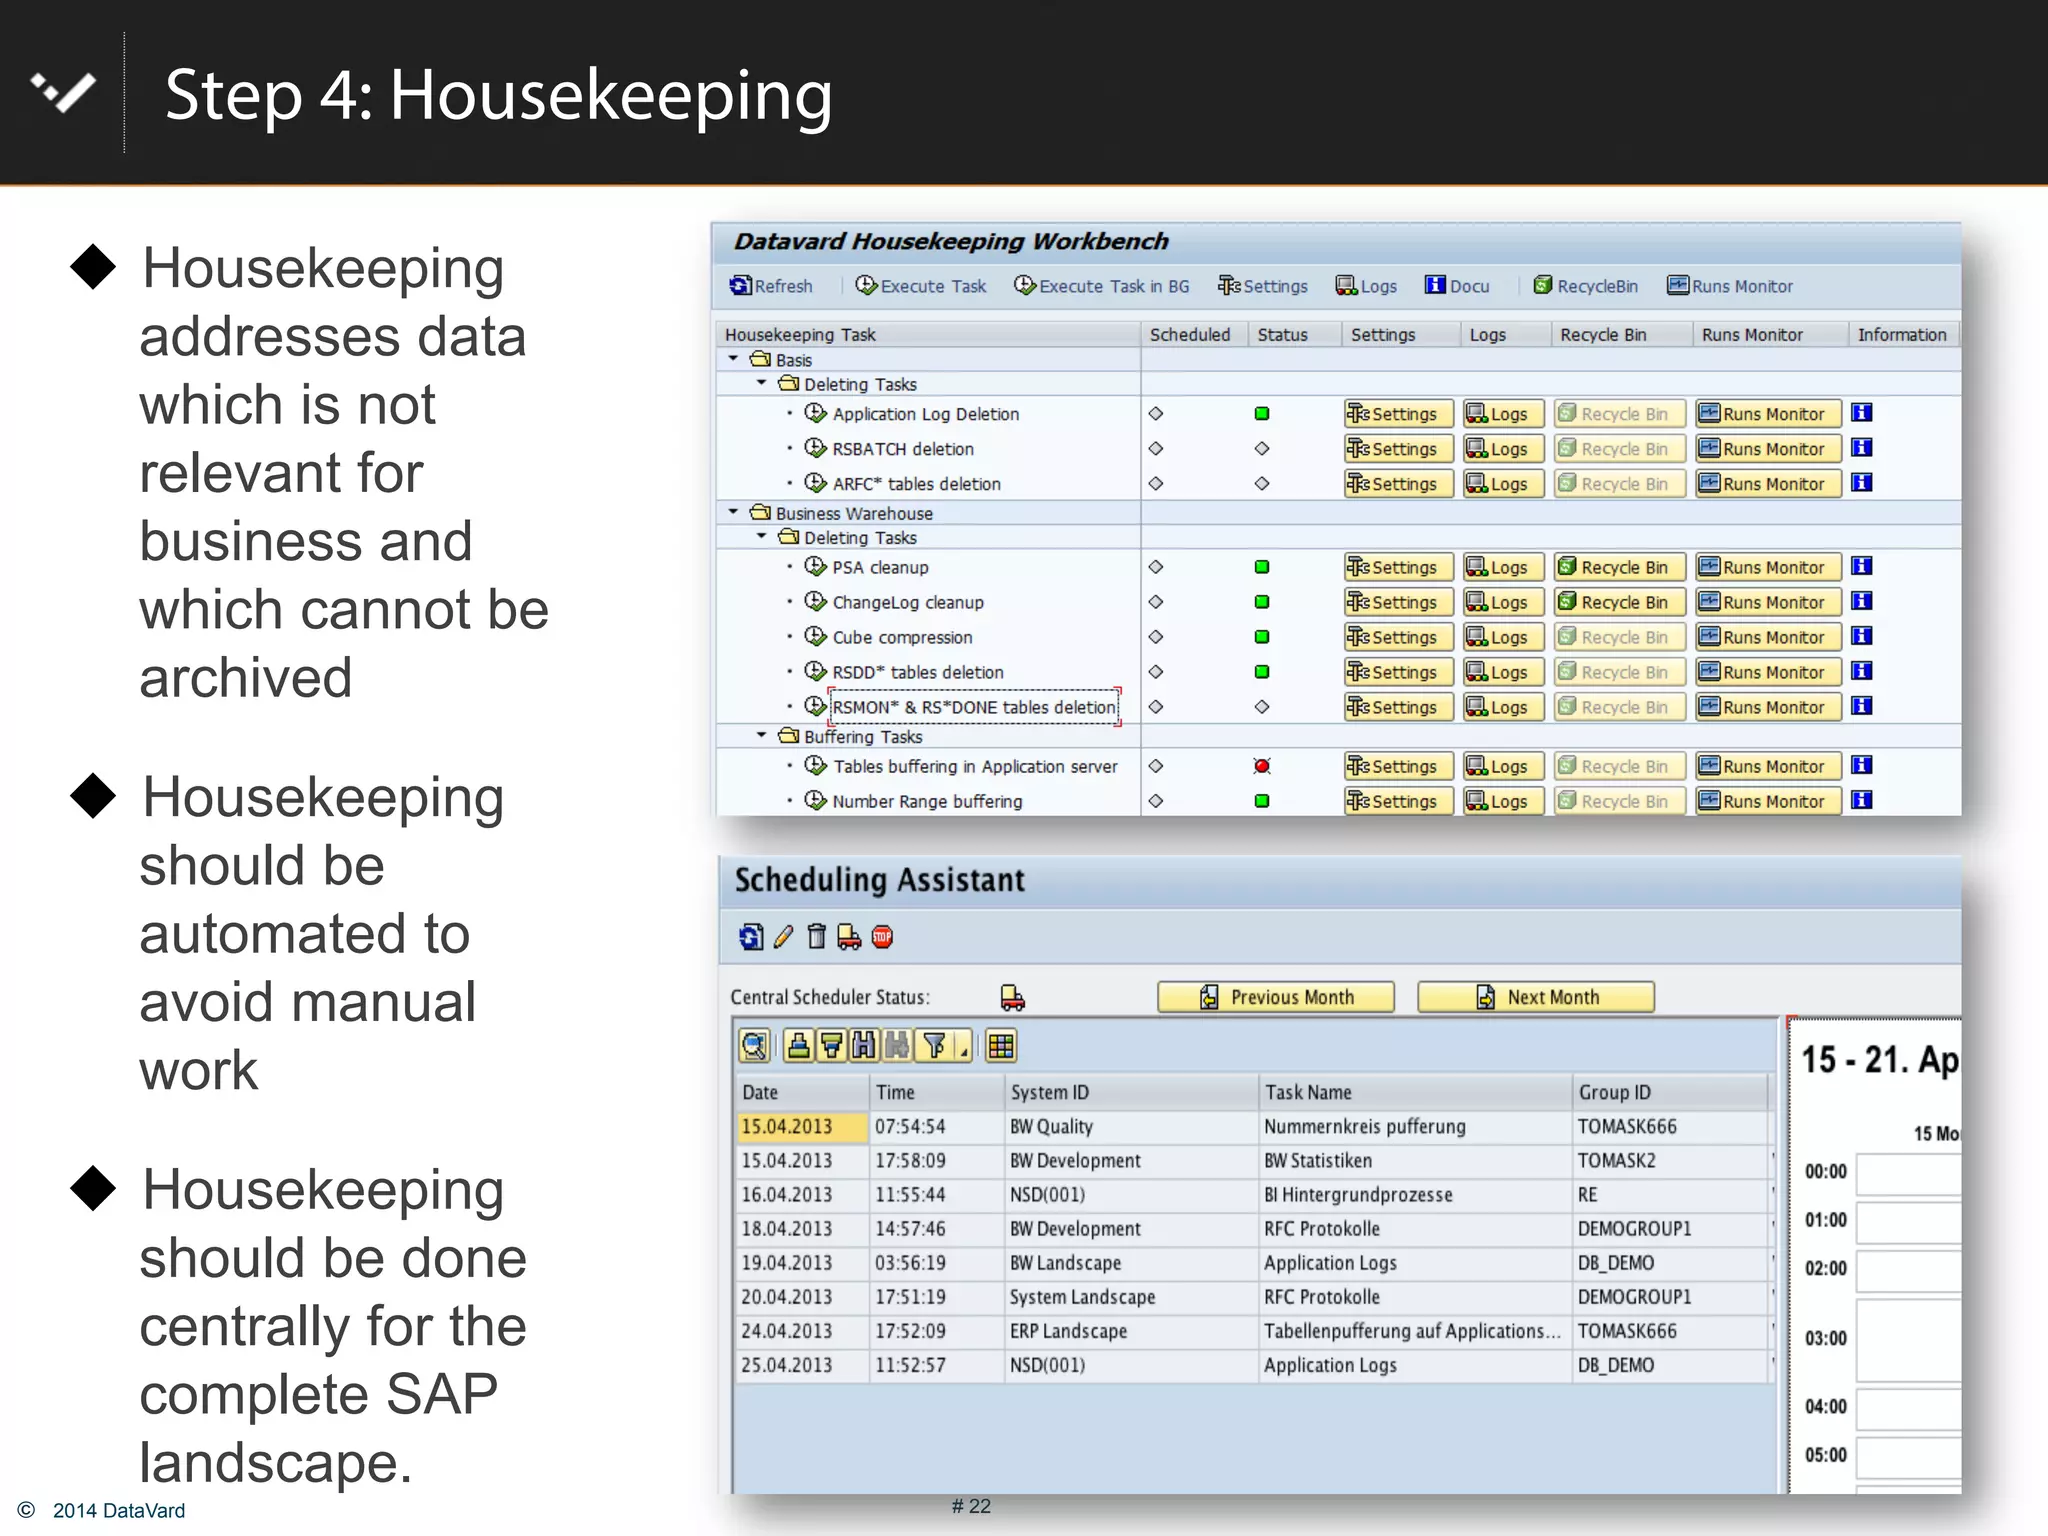
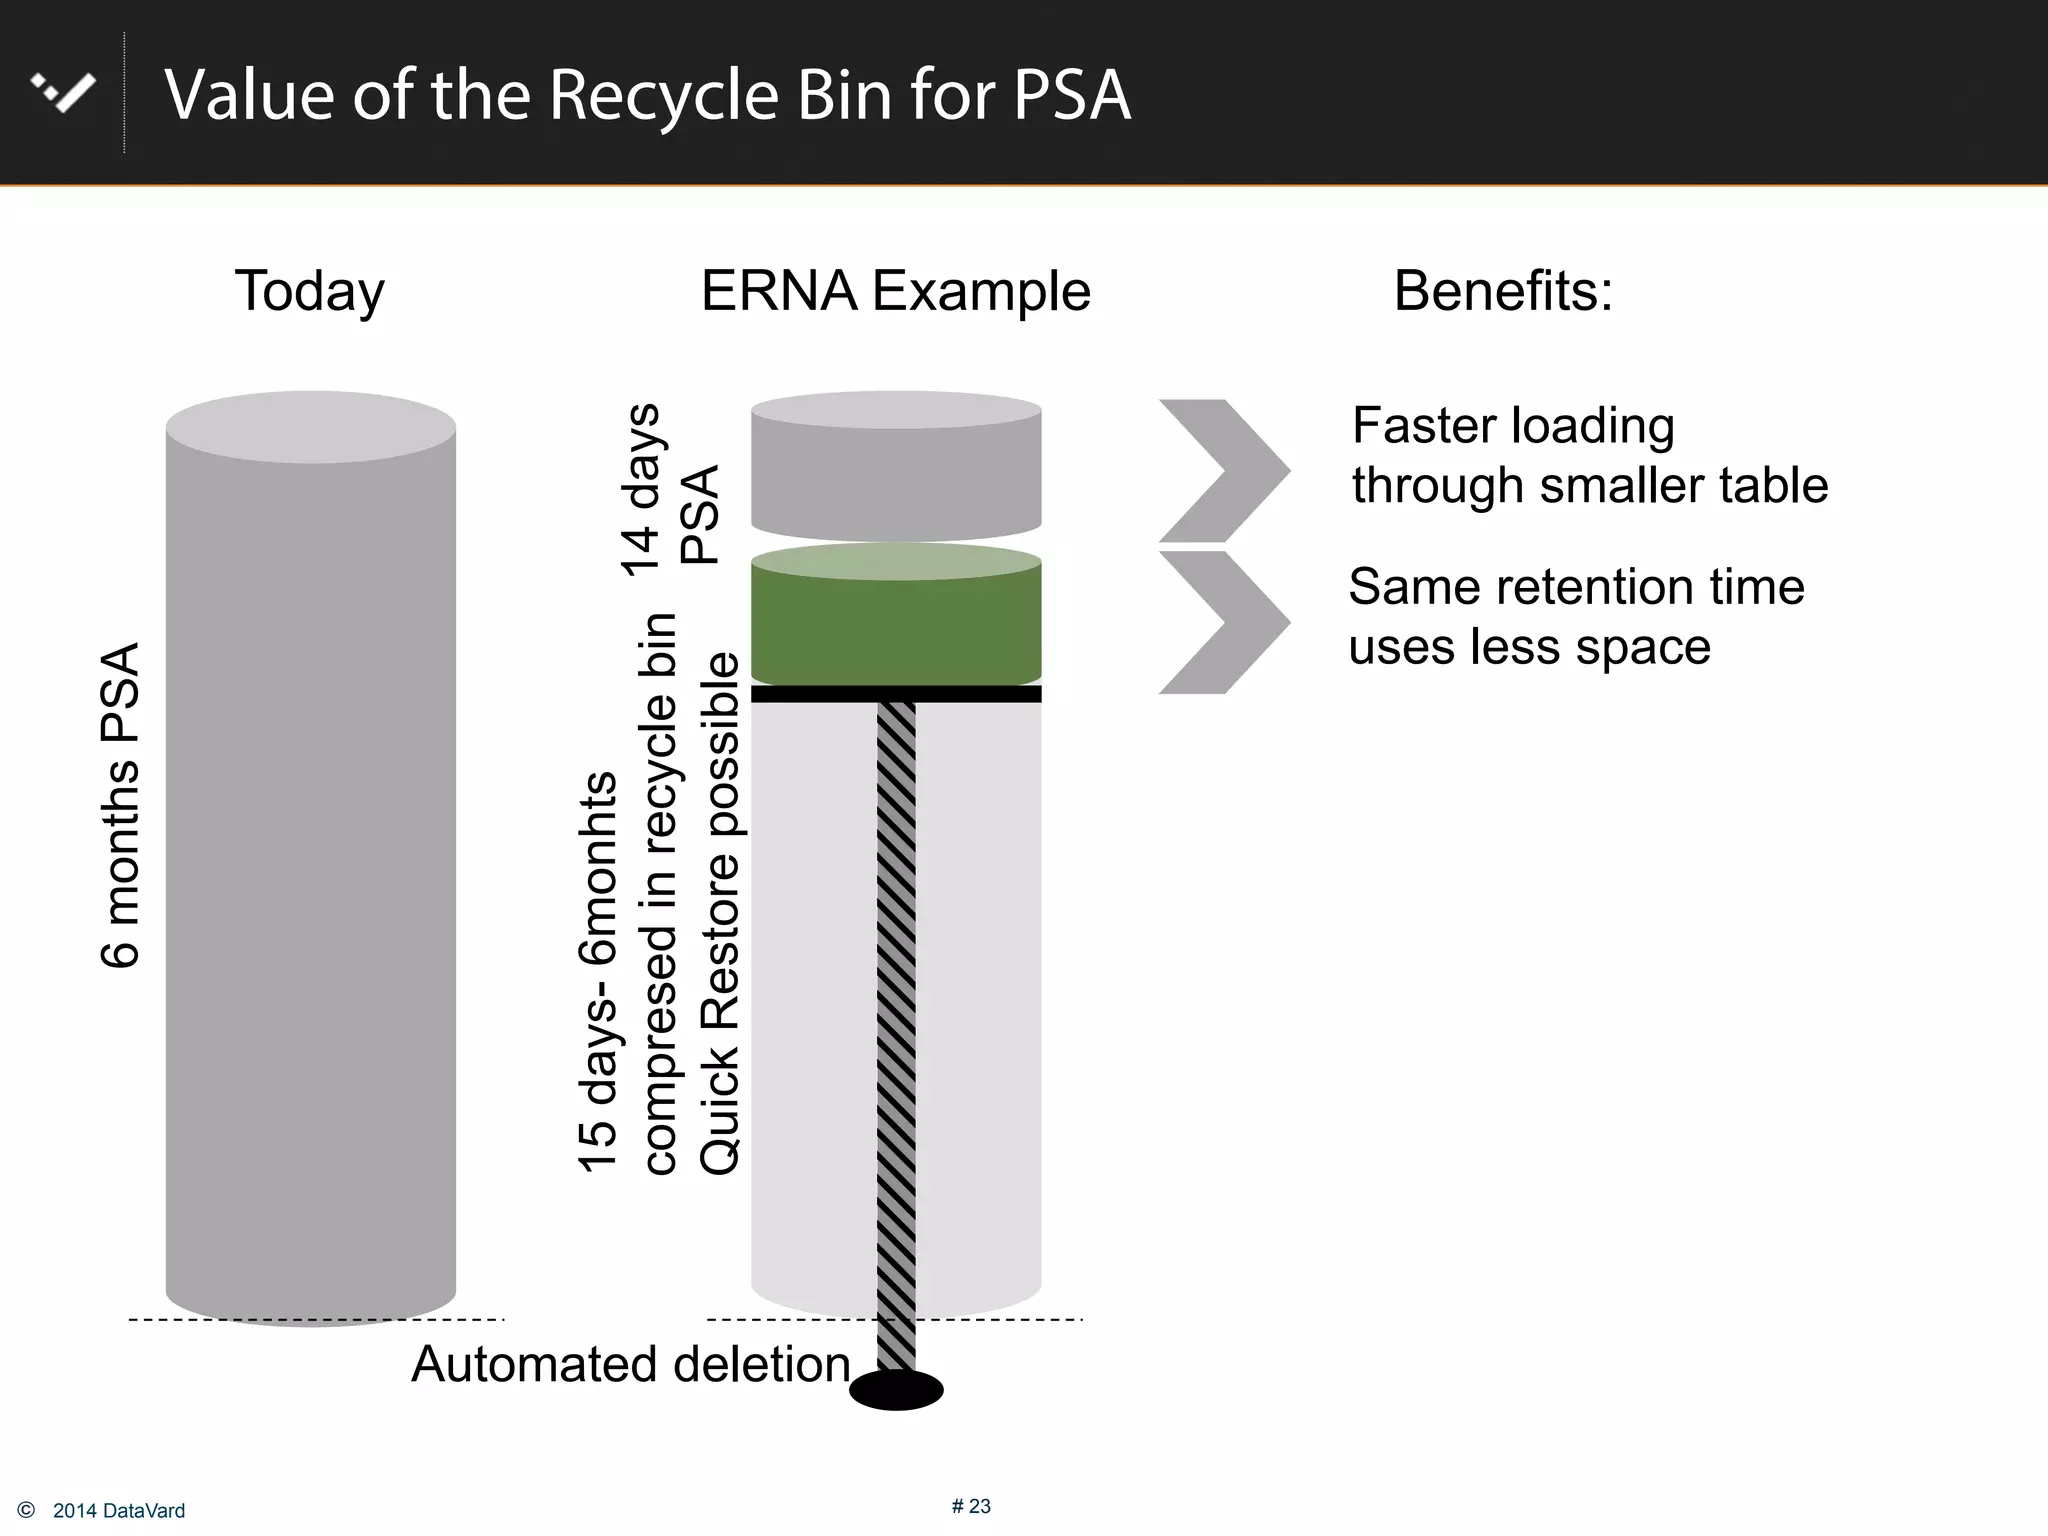
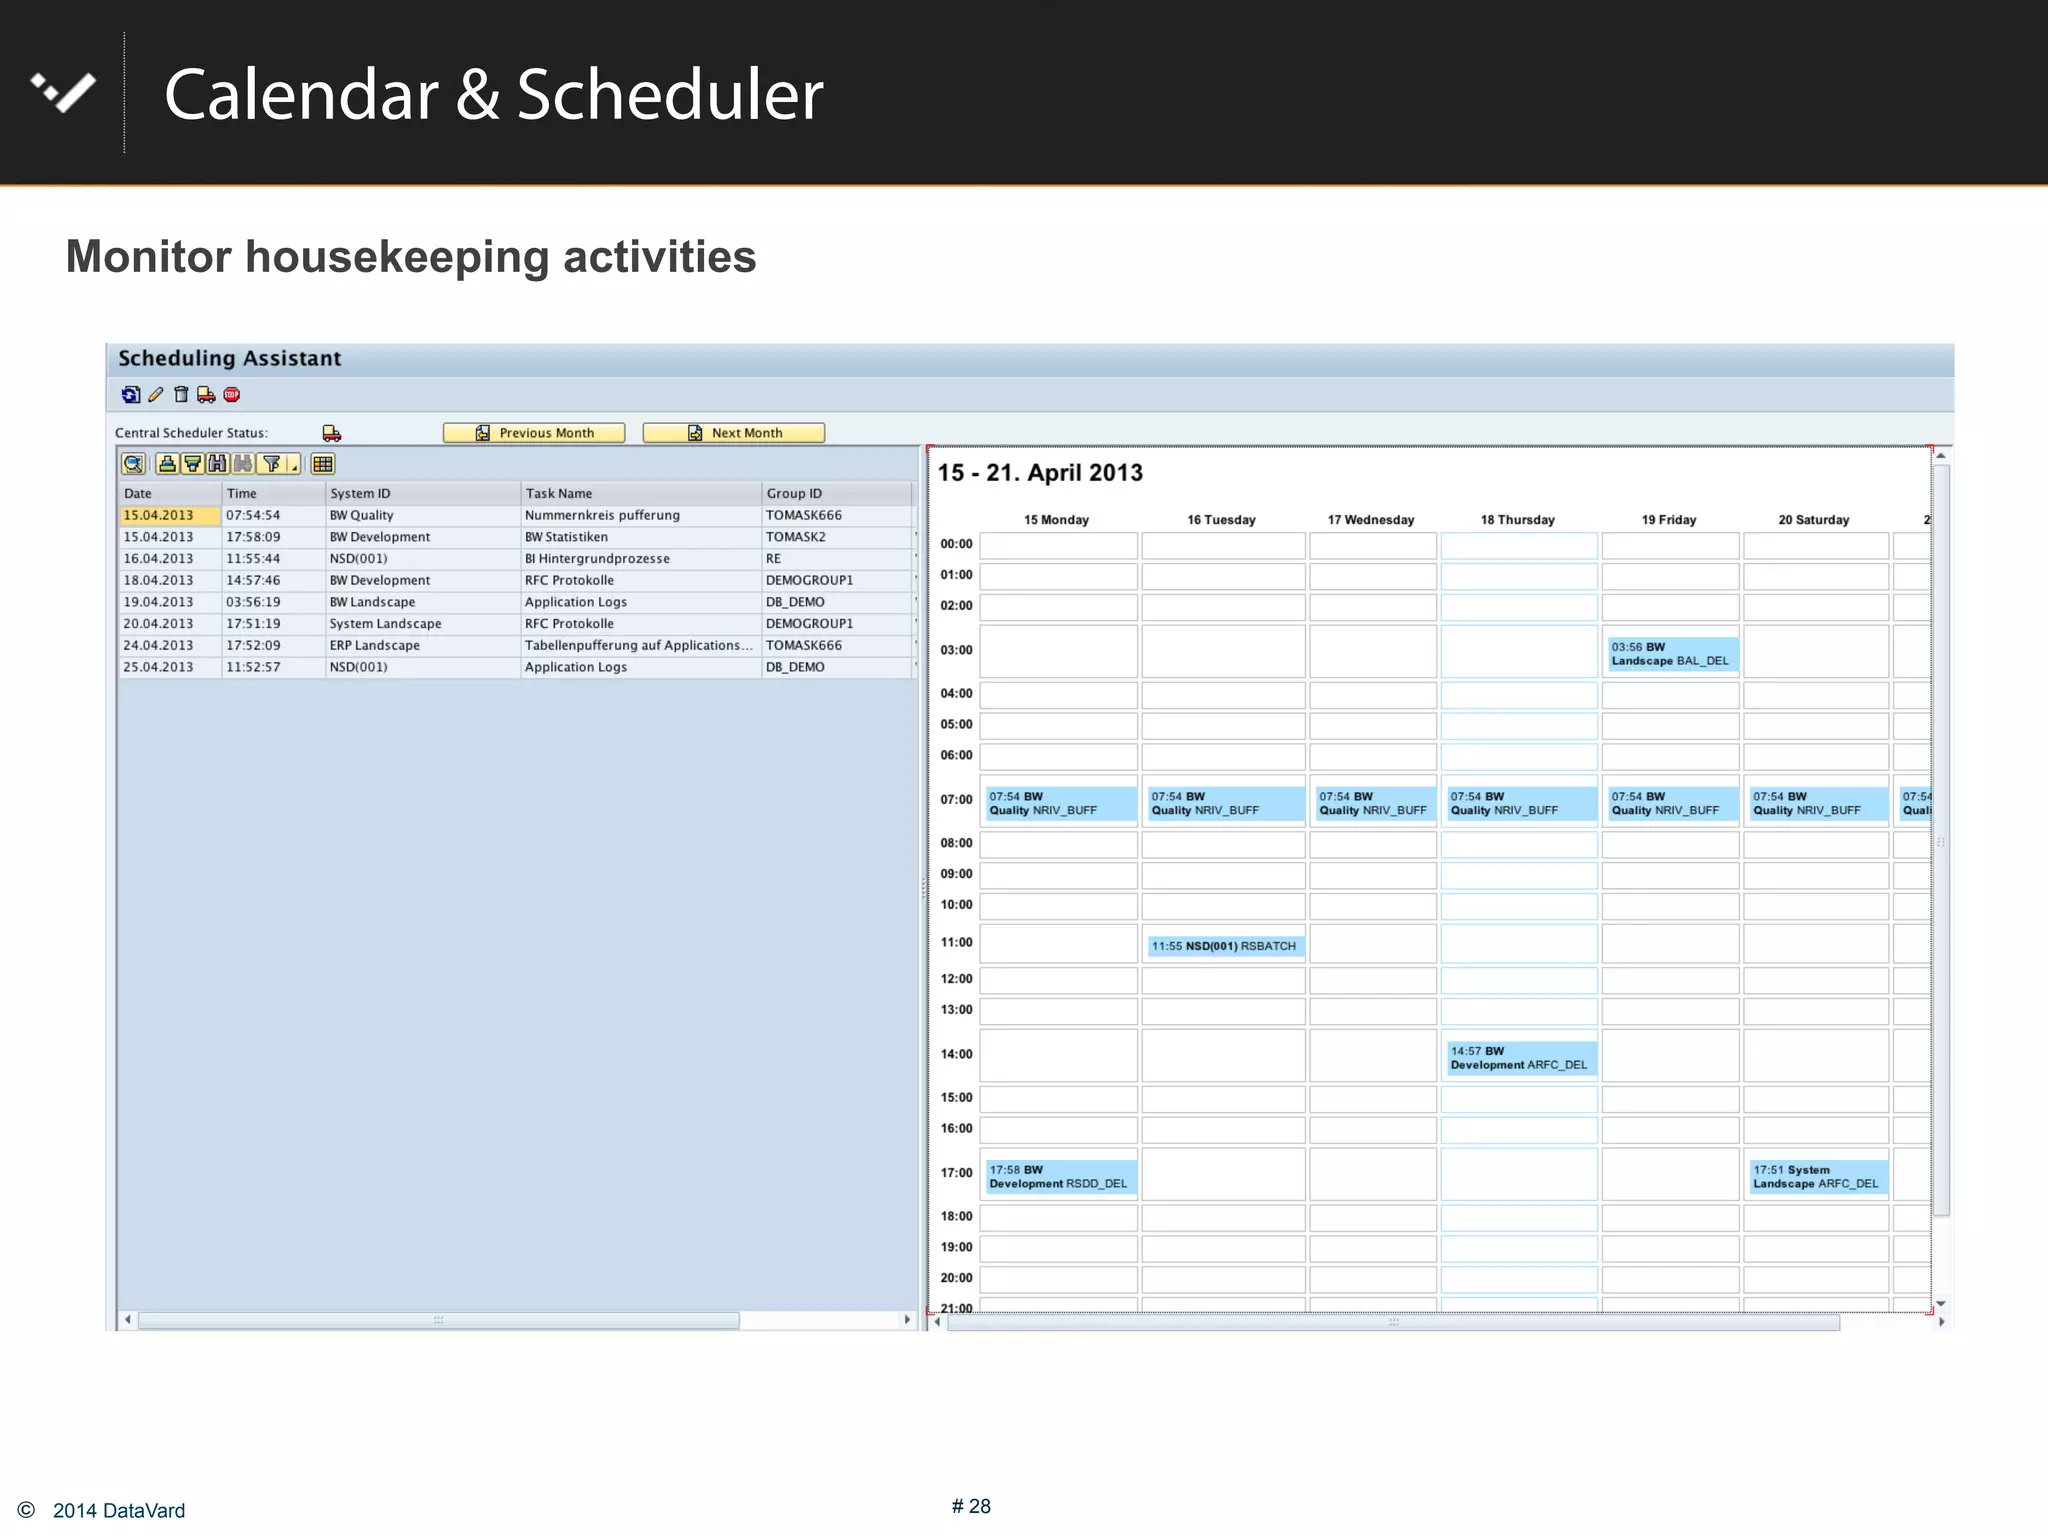
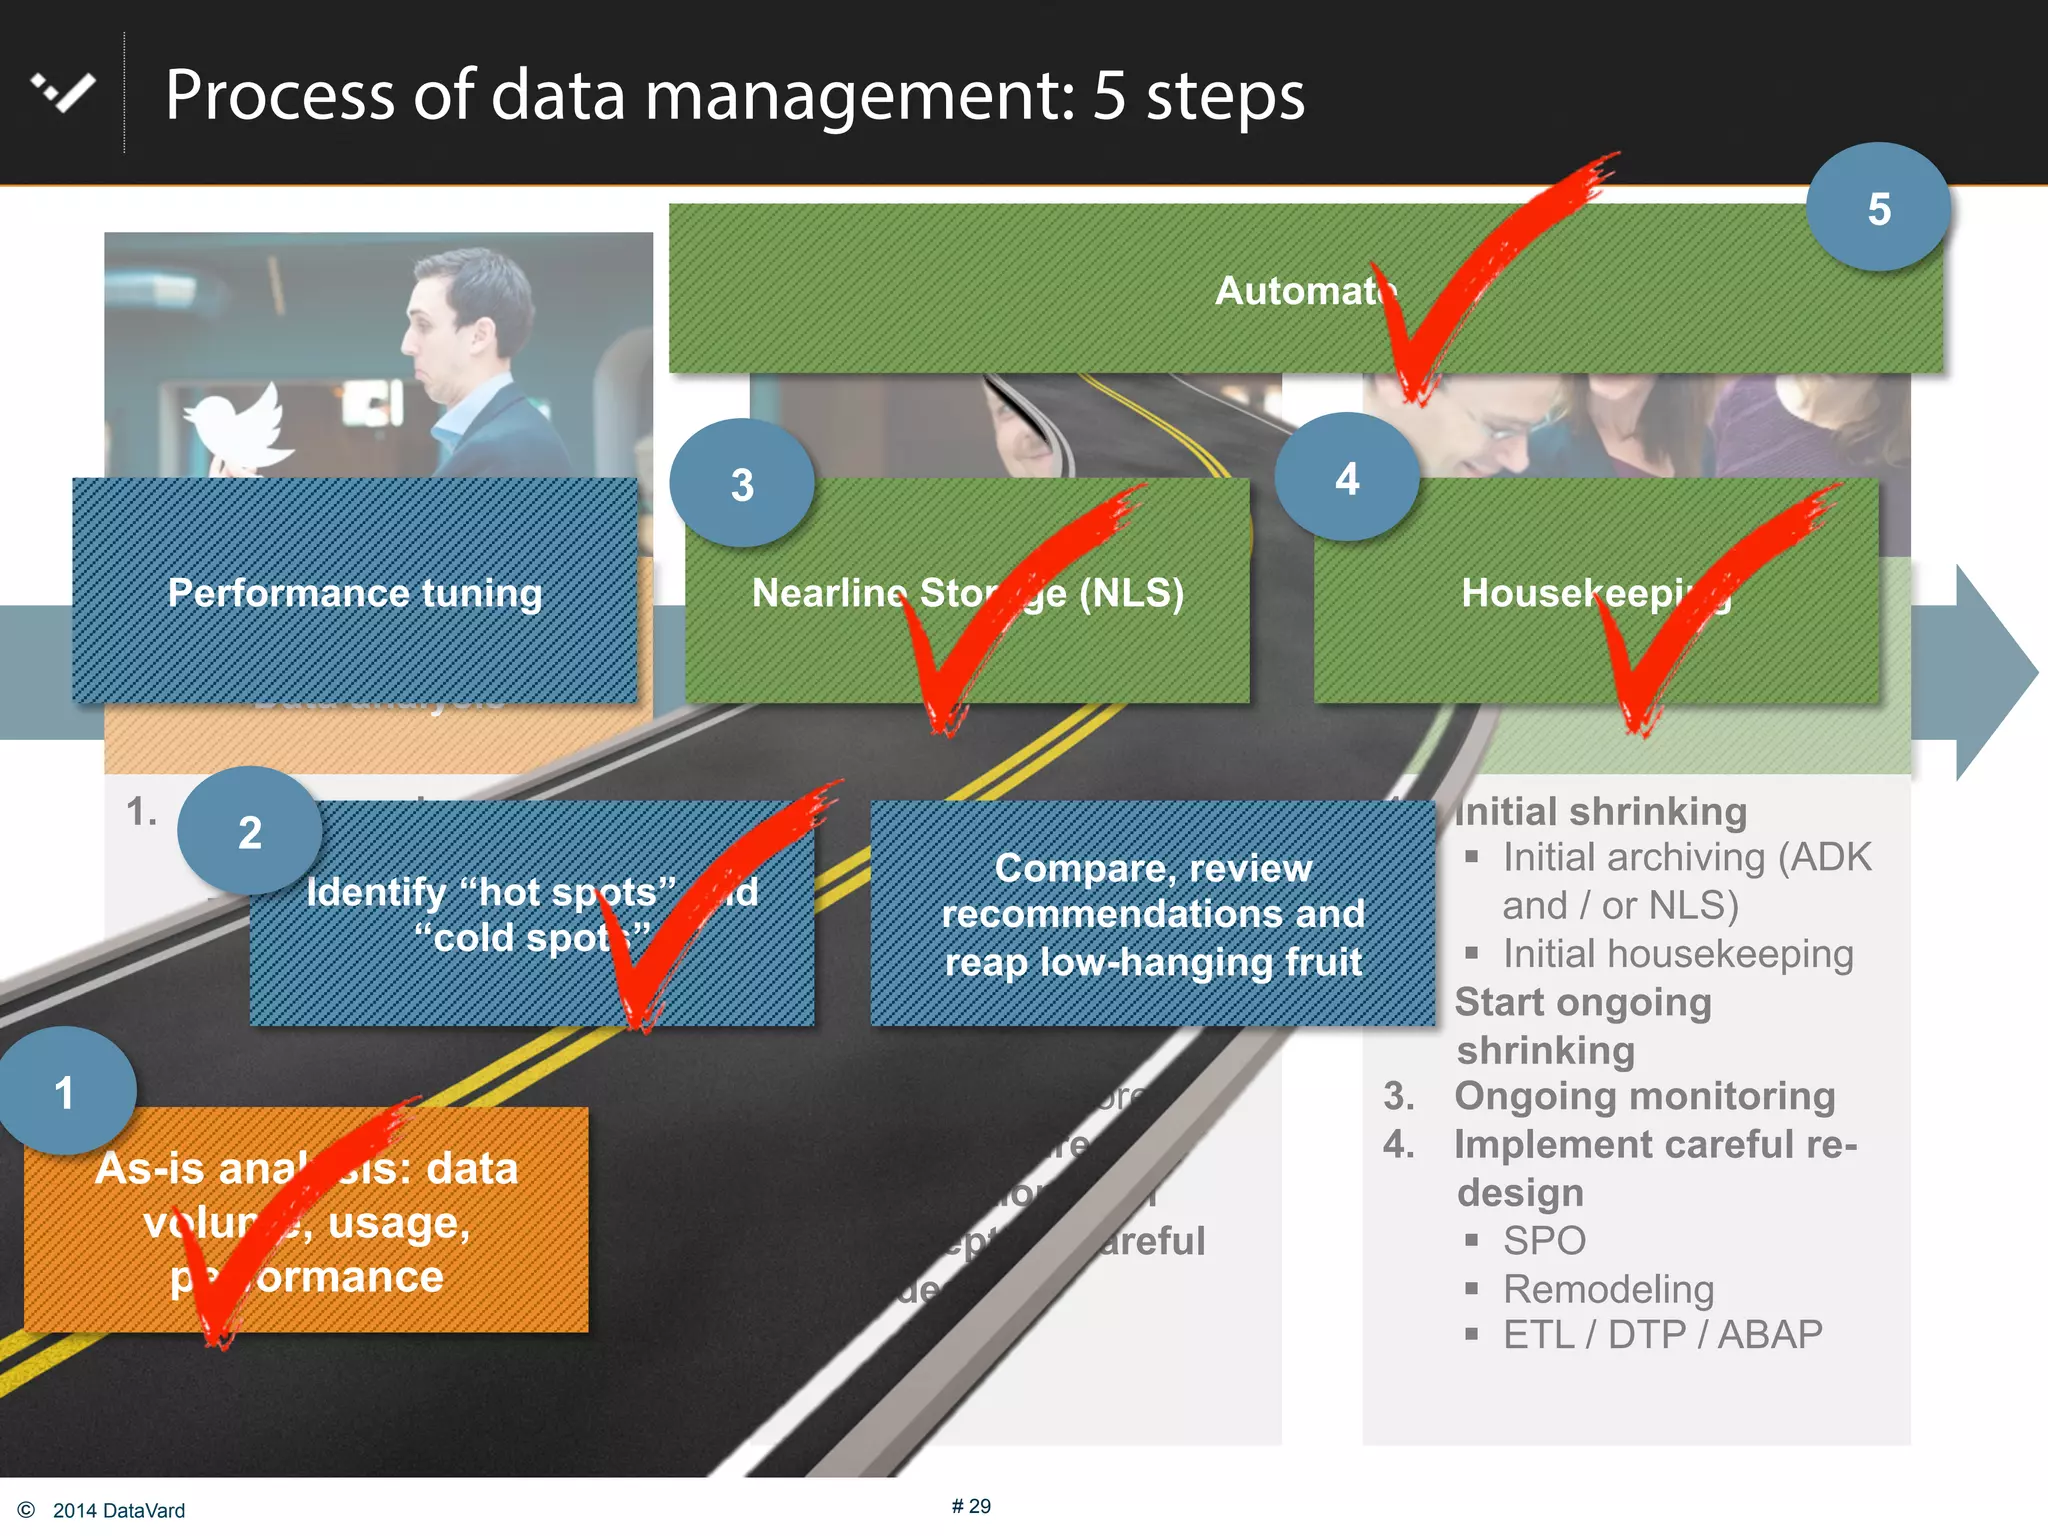


The document discusses how to optimize data management in SAP systems through analyzing data usage and volume, identifying hot and cold data, implementing nearline storage and housekeeping automation to reduce database size by 40-50% while improving performance, as demonstrated by a case study where a company reduced database size by 43% and improved data load time by 64%.


![[WEBINAR] Data Management: The cornerstone to succeed in the move to S/4HANA](https://cdn.slidesharecdn.com/ss_thumbnails/tjcgroupukisugwebinardms4hanafinal-share-200921125243-thumbnail.jpg?width=640&height=640&fit=bounds)


