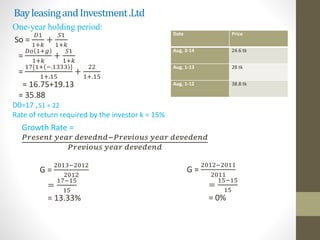
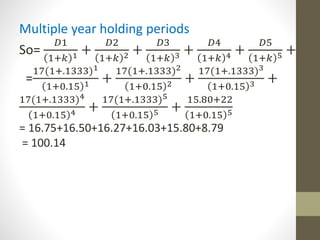
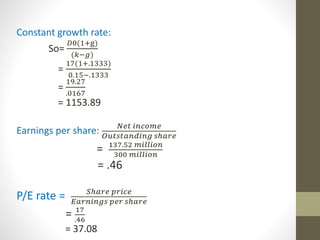
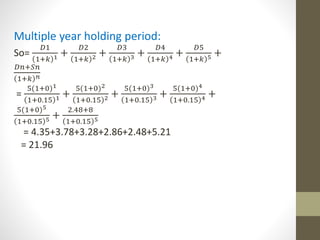
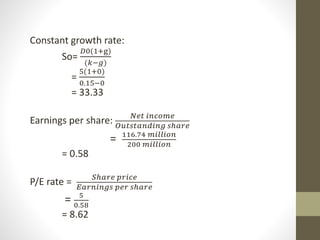
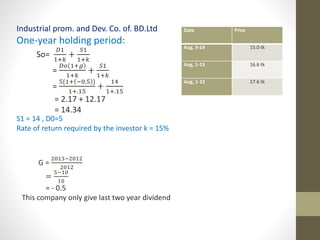
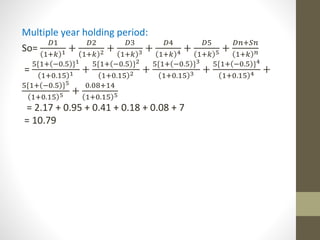
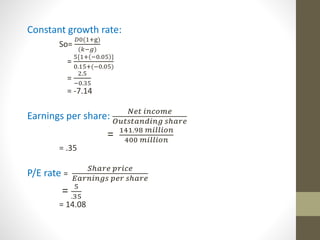
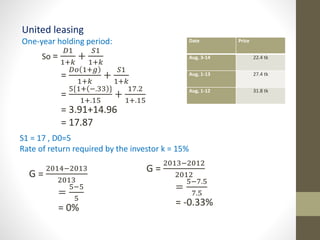
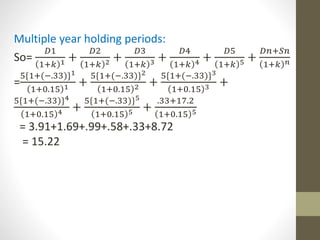
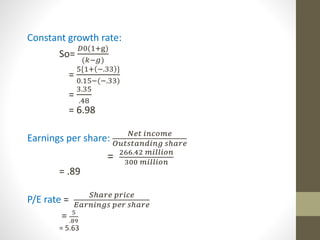
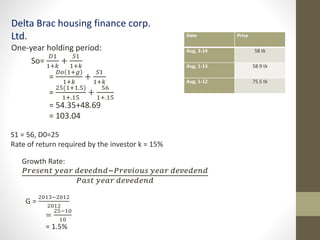
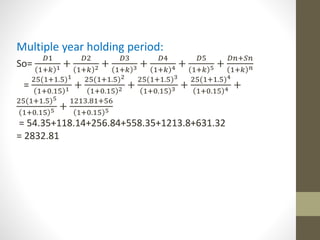
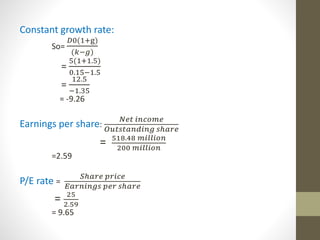
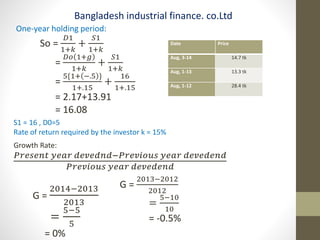
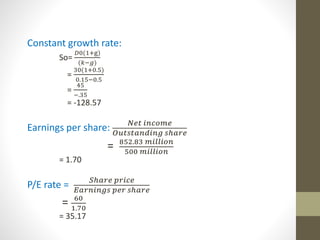
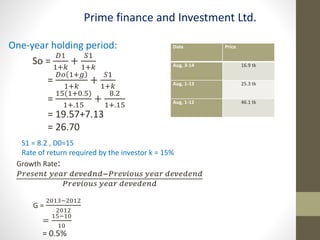
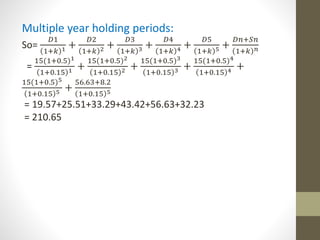
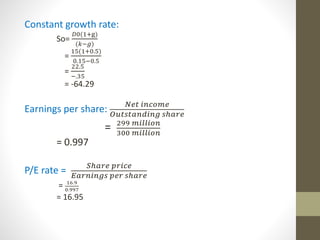
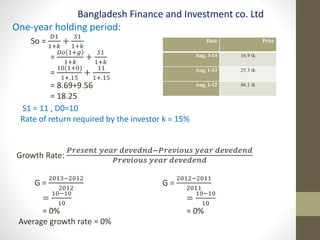
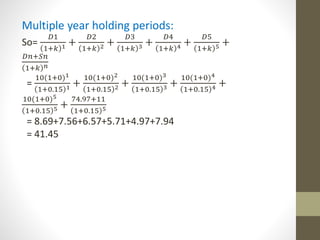
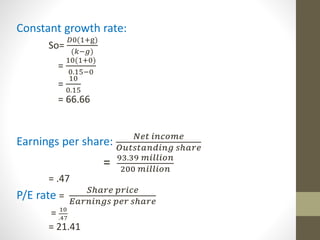
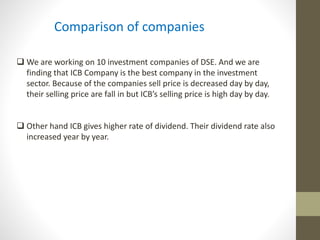
Date Price 
Aug, 3-14 24.6 tk 
Aug, 1-13 28 tk 
Aug, 1-12 38.8 tk 
One-year holding period: 
So = 
퐷1 
1+푘 
+ 
푆1 
1+푘 
= 
퐷표 1+푔 
1+푘 
+ 
푆1 
1+푘 
= 
17{1+ −.1333 } 
1+.15 
+ 
22 
1+.15 
= 16.75+19.13 
= 35.88 
D0=17 , S1 = 22 
Rate of return required by the investor k = 15% 
Growth Rate = 
푃푟푒푠푒푛푡 푦푒푎푟 푑푒푣푒푑푛푑−푃푟푒푣푖표푢푠 푦푒푎푟 푑푒푣푒푑푒푛푑 
푃푟푒푣푖표푢푠 푦푒푎푟 푑푒푣푒푑푒푛푑 
G = 
2013−2012 
2012 
= 
17−15 
15 
= 13.33% 
G = 
2012−2011 
2011 
= 
15−15 
15 
= 0% 
Bay leasing and Investment .Ltd
Multiple year holding periods 
So= 
퐷1 
1+푘 1 + 
퐷2 
1+푘 2 + 
퐷3 
1+푘 3 + 
퐷4 
1+푘 4 + 
퐷5 
1+푘 5 + 
= 
17(1+.1333)1 
1+0.15 1 + 
17(1+.1333)2 
1+0.15 2 + 
17(1+.1333)3 
1+0.15 3 + 
17(1+.1333)4 
1+0.15 4 + 
17(1+.1333)5 
1+0.15 5 + 
15.80+22 
1+0.15 5 
= 16.75+16.50+16.27+16.03+15.80+8.79 
= 100.14
Constant growth rate: 
퐷0(1+g) 
(푘−푔) 
= 
So= 
17(1+.1333) 
0.15−.1333 
= 
19.27 
.0167 
= 1153.89 
Earnings per share: 푁푒푡 푖푛푐표푚푒 
푂푢푡푠푡푎푛푑푖푛푔 푠ℎ푎푟푒 
= 137.52 푚푖푙푙푖표푛 
300 푚푖푙푙푖표푛 
= .46 
P/E rate = 푆ℎ푎푟푒 푝푟푖푐푒 
퐸푎푟푛푖푛푔푠 푝푒푟 푠ℎ푎푟푒 
= 17 
.46 
= 37.08
One-year holding period: 
So = 
퐷1 
1+푘 
+ 
푆1 
1+푘 
= 
퐷표 1+푔 
1+푘 
+ 
푆1 
1+푘 
= 
40(1+.64) 
1+.15 
+ 
2000 
1+.15 
= 57.04+1739.13 
= 1796.17 
Date Price 
Aug, 3-14 1898 tk 
Aug, 1-13 1820 tk 
Aug, 1-12 1683 tk 
S1 = 2000 , D0=40 
Rate of return required by the investor k = 15% 
Growth Rate: 
푃푟푒푠푒푛푡 푦푒푎푟 푑푒푣푒푑푛푑−푃푟푒푣푖표푢푠 푦푒푎푟 푑푒푣푒푑푒푛푑 
푃푎푠푡 푦푒푎푟 푑푒푣푒푑푒푛푑 
G = 
2013−2012 
2012 
= 
40−25 
25 
= 0.6% 
G = 
2012−2011 
2011 
= 
25−15 
15 
= 0.67% 
Average rate = 
.6+.67 
2 
= 0.64% 
ICB ( Investment corporation of Bangladesh
Multiple year holding period 
So= 
퐷1 
1+푘 1 + 
퐷2 
1+푘 2 + 
퐷3 
1+푘 3 + 
퐷4 
1+푘 4 + 
퐷5 
1+푘 5 + 
퐷푛+푆푛 
1+푘 푛 
= 
40(1+.64)1 
1+0.15 1 + 
40(1+.64)2 
1+0.15 2 + 
40(1+.64)3 
1+0.15 3 + 
40(1+.64)4 
1+0.15 4 + 
40(1+.64)5 
1+0.15 5 + 
235.93+2000 
1+0.15 5 
= 57.04+81.34+116.01+165.44+235.93+1111.65 
= 1767.41
Constant growth rate: 
퐷0(1+g) 
(푘−푔) 
= 
So= 
40(1+.64) 
0.15−.64 
= 
65.6 
−0.49 
= -133.88 
Earnings per share = 
푁푒푡 푖푛푐표푚푒 
푂푢푡푠푡푎푛푑푖푛푔 푠ℎ푎푟푒 
= 3764.24 푚푖푙푙푖표푛 
100 푚푖푙푙푖표푛 
= 37.64 
P/E rate = 
푆ℎ푎푟푒 푝푟푖푐푒 
퐸푎푟푛푖푛푔푠 푝푒푟 푠ℎ푎푟푒 
= 40 
37.64 
= 1.06
Internal Leasing and financial service Ltd. 
One-year holding period: 
So= 
퐷1 
1+푘 
+ 
푆1 
1+푘 
= 
퐷표 1+푔 
1+푘 
+ 
푆1 
1+푘 
= 
5(1+0) 
1+.15 
+ 
8 
1+.15 
= 4.35+6.96 
= 11.30 
Date Price 
Aug, 3-14 10.9 tk 
Aug, 1-13 12.5 tk 
Aug, 1-12 21 tk 
S1 = 8 ,D0=5 
Rate of return required by the investor k = 15% 
Growth Rate: 
푃푟푒푠푒푛푡 푦푒푎푟 푑푒푣푒푑푛푑−푃푟푒푣푖표푢푠 푦푒푎푟 푑푒푣푒푑푒푛푑 
푃푎푠푡 푦푒푎푟 푑푒푣푒푑푒푛푑 
G = 
2014−2013 
2013 
= 
5−5 
5 
= 0% 
This company give last two years dividend.
Multiple year holding period: 
So= 
퐷1 
1+푘 1 + 
퐷2 
1+푘 2 + 
퐷3 
1+푘 3 + 
퐷4 
1+푘 4 + 
퐷5 
1+푘 5 + 
퐷푛+푆푛 
1+푘 푛 
= 
5(1+0)1 
1+0.15 1 + 
5(1+0)2 
1+0.15 2 + 
5(1+0)3 
1+0.15 3 + 
5(1+0)4 
1+0.15 4 + 
5(1+0)5 
1+0.15 5 + 
2.48+8 
1+0.15 5 
= 4.35+3.78+3.28+2.86+2.48+5.21 
= 21.96
Constant growth rate: 
퐷0(1+g) 
(푘−푔) 
= 
So= 
5(1+0) 
0.15−0 
= 33.33 
Earnings per share: 푁푒푡 푖푛푐표푚푒 
푂푢푡푠푡푎푛푑푖푛푔 푠ℎ푎푟푒 
= 116.74 푚푖푙푙푖표푛 
200 푚푖푙푙푖표푛 
= 0.58 
P/E rate = 푆ℎ푎푟푒 푝푟푖푐푒 
퐸푎푟푛푖푛푔푠 푝푒푟 푠ℎ푎푟푒 
= 5 
0.58 
= 8.62
Industrial prom. and Dev. Co. of. BD.Ltd 
One-year holding period: 
So= 
퐷1 
1+푘 
+ 
푆1 
1+푘 
= 
퐷표 1+푔 
1+푘 
+ 
푆1 
1+푘 
= 
5{1+ −0.5 } 
1+.15 
+ 
14 
1+.15 
= 2.17 + 12.17 
= 14.34 
S1 = 14 , D0=5 
Rate of return required by the investor k = 15% 
Date Price 
Aug, 3-14 15.0 tk 
Aug, 1-13 16.6 tk 
Aug, 1-12 17.6 tk 
G = 
2013−2012 
2012 
= 
5−10 
10 
= - 0.5 
This company only give last two year dividend
Multiple year holding period: 
So= 
퐷1 
1+푘 1 + 
퐷2 
1+푘 2 + 
퐷3 
1+푘 3 + 
퐷4 
1+푘 4 + 
퐷5 
1+푘 5 + 
퐷푛+푆푛 
1+푘 푛 
= 
5{1+ −0.5 }1 
1+0.15 1 + 
5{1+ −0.5 }2 
1+0.15 2 + 
5{1+ −0.5 }3 
1+0.15 3 + 
5{1+ −0.5 }4 
1+0.15 4 + 
5{1+ −0.5 }5 
1+0.15 5 + 
0.08+14 
1+0.15 5 
= 2.17 + 0.95 + 0.41 + 0.18 + 0.08 + 7 
= 10.79
Constant growth rate: 
퐷0(1+g) 
(푘−푔) 
= 
So= 
5{1+ −0.05 } 
0.15+(−0.05) 
= 
2.5 
−0.35 
= -7.14 
Earnings per share: 푁푒푡 푖푛푐표푚푒 
푂푢푡푠푡푎푛푑푖푛푔 푠ℎ푎푟푒 
= 141.98 푚푖푙푙푖표푛 
400 푚푖푙푙푖표푛 
= .35 
P/E rate = 
푆ℎ푎푟푒 푝푟푖푐푒 
퐸푎푟푛푖푛푔푠 푝푒푟 푠ℎ푎푟푒 
= 5 
.35 
= 14.08
United leasing 
One-year holding period: 
So = 
퐷1 
1+푘 
+ 
푆1 
1+푘 
= 
퐷표 1+푔 
1+푘 
+ 
푆1 
1+푘 
= 
5{1+ −.33 } 
1+.15 
+ 
17.2 
1+.15 
= 3.91+14.96 
= 17.87 
Date Price 
Aug, 3-14 22.4 tk 
Aug, 1-13 27.4 tk 
Aug, 1-12 31.8 tk 
S1 = 17 , D0=5 
Rate of return required by the investor k = 15% 
G = 
2014−2013 
2013 
= 
5−5 
5 
= 0% 
G = 
2013−2012 
2012 
= 
5−7.5 
7.5 
= -0.33%
Multiple year holding periods: 
So= 
퐷1 
1+푘 1 + 
퐷2 
1+푘 2 + 
퐷3 
1+푘 3 + 
퐷4 
1+푘 4 + 
퐷5 
1+푘 5 + 
퐷푛+푆푛 
1+푘 푛 
5{1+(−.33)}1 
= 
1+0.15 1 + 
5{1+(−.33)}2 
1+0.15 2 + 
5{1+(−.33)}3 
1+0.15 3 + 
5{1+(−.33)}4 
1+0.15 4 + 
5{1+(−.33)}5 
1+0.15 5 + 
.33+17.2 
1+0.15 5 
= 3.91+1.69+.99+.58+.33+8.72 
= 15.22
Constant growth rate: 
퐷0(1+g) 
(푘−푔) 
= 
So= 
5{1+ −.33 } 
0.15−(−.33) 
= 
3.35 
.48 
= 6.98 
Earnings per share: 푁푒푡 푖푛푐표푚푒 
푂푢푡푠푡푎푛푑푖푛푔 푠ℎ푎푟푒 
= 266.42 푚푖푙푙푖표푛 
300 푚푖푙푙푖표푛 
= .89 
P/E rate = 푆ℎ푎푟푒 푝푟푖푐푒 
퐸푎푟푛푖푛푔푠 푝푒푟 푠ℎ푎푟푒 
= 5 
.89 
= 5.63
Delta Brac housing finance corp. 
Ltd. 
One-year holding period: 
So= 
퐷1 
1+푘 
+ 
푆1 
1+푘 
= 
퐷표 1+푔 
1+푘 
+ 
푆1 
1+푘 
= 
25(1+1.5) 
1+.15 
+ 
56 
1+.15 
= 54.35+48.69 
= 103.04 
S1 = 56, D0=25 
Rate of return required by the investor k = 15% 
Date Price 
Aug, 3-14 58 tk 
Aug, 1-13 58.9 tk 
Aug, 1-12 75.5 tk 
Growth Rate: 
푃푟푒푠푒푛푡 푦푒푎푟 푑푒푣푒푑푛푑−푃푟푒푣푖표푢푠 푦푒푎푟 푑푒푣푒푑푒푛푑 
푃푎푠푡 푦푒푎푟 푑푒푣푒푑푒푛푑 
G = 
2013−2012 
2012 
= 
25−10 
10 
= 1.5%
Multiple year holding period: 
So= 
퐷1 
1+푘 1 + 
퐷2 
1+푘 2 + 
퐷3 
1+푘 3 + 
퐷4 
1+푘 4 + 
퐷5 
1+푘 5 + 
퐷푛+푆푛 
1+푘 푛 
= 
25(1+1.5)1 
1+0.15 1 + 
25(1+1.5)2 
1+0.15 2 + 
25(1+1.5)3 
1+0.15 3 + 
25(1+1.5)4 
1+0.15 4 + 
25(1+1.5)5 
1+0.15 5 + 
1213.81+56 
1+0.15 5 
= 54.35+118.14+256.84+558.35+1213.8+631.32 
= 2832.81
Constant growth rate: 
퐷0(1+g) 
(푘−푔) 
= 
So= 
5(1+1.5) 
0.15−1.5 
= 
12.5 
−1.35 
= -9.26 
Earnings per share: 
푁푒푡 푖푛푐표푚푒 
푂푢푡푠푡푎푛푑푖푛푔 푠ℎ푎푟푒 
= 518.48 푚푖푙푙푖표푛 
200 푚푖푙푙푖표푛 
=2.59 
P/E rate = 
푆ℎ푎푟푒 푝푟푖푐푒 
퐸푎푟푛푖푛푔푠 푝푒푟 푠ℎ푎푟푒 
= 25 
2.59 
= 9.65
Bangladesh industrial finance. co.Ltd 
One-year holding period: 
So = 
퐷1 
1+푘 
+ 
푆1 
1+푘 
= 
퐷표 1+푔 
1+푘 
+ 
푆1 
1+푘 
= 
5{1+ −.5 } 
1+.15 
+ 
16 
1+.15 
= 2.17+13.91 
= 16.08 
Date Price 
Aug, 3-14 14.7 tk 
Aug, 1-13 13.3 tk 
Aug, 1-12 28.4 tk 
S1 = 16 , D0=5 
Rate of return required by the investor k = 15% 
Growth Rate: 
푃푟푒푠푒푛푡 푦푒푎푟 푑푒푣푒푑푛푑−푃푟푒푣푖표푢푠 푦푒푎푟 푑푒푣푒푑푒푛푑 
푃푟푒푣푖표푢푠 푦푒푎푟 푑푒푣푒푑푒푛푑 
G = 
2014−2013 
2013 
= 
5−5 
5 
= 0% 
G = 
2013−2012 
2012 
= 
5−10 
10 
= -0.5%
Multiple year holding periods: 
So= 
퐷1 
1+푘 1 + 
퐷2 
1+푘 2 + 
퐷3 
1+푘 3 + 
퐷4 
1+푘 4 + 
퐷5 
1+푘 5 + 
퐷푛+푆푛 
1+푘 푛 
= 
5{1+(−0.5)}1 
1+0.15 1 + 
5{1+(−0.5)}2 
1+0.15 2 + 
5{1+(−0.5)}3 
1+0.15 3 + 
5{1+(−0.5)}4 
1+0.15 4 + 
5{1+(−0.5)}5 
1+0.15 5 + 
0.07+16 
1+0.15 5 
= 2.17+.94+.41+.18+.07+8 
= 11.76
Constant growth rate: 
퐷0(1+g) 
(푘−푔) 
= 
So= 
5{1+(−0.5)} 
0.15−(−0.5) 
= 
2.5 
.65 
= 3.84 
Earnings per share: 
푁푒푡 푖푛푐표푚푒 
푂푢푡푠푡푎푛푑푖푛푔 푠ℎ푎푟푒 
= 45.51 푚푖푙푙푖표푛 
200 푚푖푙푙푖표푛 
= .23 
P/E rate = 푆ℎ푎푟푒 푝푟푖푐푒 
퐸푎푟푛푖푛푔푠 푝푒푟 푠ℎ푎푟푒 
= 5 
.23 
= 21.74
Uttara Finance 
One-year holding period: 
So = 
퐷1 
1+푘 
+ 
푆1 
1+푘 
= 
퐷표 1+푔 
1+푘 
+ 
푆1 
1+푘 
= 
30(1+0.5) 
1+.15 
+ 
55 
1+.15 
= 39.13+47.83 
= 89.95 
Date Price 
Aug, 3-14 66 tk 
Aug, 1-13 74.1 tk 
Aug, 1-12 85.8 tk 
S1 = 55 , D0=30 
Rate of return required by the investor k = 15% 
Growth Rate: 푃푟푒푠푒푛푡 푦푒푎푟 푑푒푣푒푑푛푑−푃푟푒푣푖표푢푠 푦푒푎푟 푑푒푣푒푑푒푛푑 
푃푟푒푣푖표푢푠 푦푒푎푟 푑푒푣푒푑푒푛푑 
G = 
2013−2012 
2012 
= 
30−20 
20 
= 0.5% 
The company provide last two years dividend.
Multiple year holding periods: 
So= 
퐷1 
1+푘 1 + 
퐷2 
1+푘 2 + 
퐷3 
1+푘 3 + 
퐷4 
1+푘 4 + 
퐷5 
1+푘 5 + 
퐷푛+푆푛 
1+푘 푛 
= 
30(1+0.5)1 
1+0.15 1 + 
30(1+0.5)2 
1+0.15 2 + 
30(1+0.5)3 
1+0.15 3 + 
30(1+0.5)4 
1+0.15 4 + 
30(1+0.5)5 
1+0.15 5 + 
113.27+55 
1+0.15 5 
= 39.13+51.03+66.57+86.84+113.27+83.6 
= 440.50
Constant growth rate: 
퐷0(1+g) 
(푘−푔) 
= 
So= 
30(1+0.5) 
0.15−0.5 
= 
45 
−.35 
= -128.57 
Earnings per share: 푁푒푡 푖푛푐표푚푒 
푂푢푡푠푡푎푛푑푖푛푔 푠ℎ푎푟푒 
= 852.83 푚푖푙푙푖표푛 
500 푚푖푙푙푖표푛 
= 1.70 
P/E rate = 푆ℎ푎푟푒 푝푟푖푐푒 
퐸푎푟푛푖푛푔푠 푝푒푟 푠ℎ푎푟푒 
= 60 
1.70 
= 35.17
Prime finance and Investment Ltd. 
One-year holding period: 
So = 
퐷1 
1+푘 
+ 
푆1 
1+푘 
= 
퐷표 1+푔 
1+푘 
+ 
푆1 
1+푘 
= 
15(1+0.5) 
1+.15 
+ 
8.2 
1+.15 
= 19.57+7.13 
= 26.70 
Date Price 
Aug, 3-14 16.9 tk 
Aug, 1-13 25.3 tk 
Aug, 1-12 46.1 tk 
S1 = 8.2 , D0=15 
Rate of return required by the investor k = 15% 
Growth Rate: 
푃푟푒푠푒푛푡 푦푒푎푟 푑푒푣푒푑푛푑−푃푟푒푣푖표푢푠 푦푒푎푟 푑푒푣푒푑푒푛푑 
푃푟푒푣푖표푢푠 푦푒푎푟 푑푒푣푒푑푒푛푑 
G = 
2013−2012 
2012 
= 
15−10 
10 
= 0.5% 
The company provide only last two years dividend
Multiple year holding periods: 
So= 
퐷1 
1+푘 1 + 
퐷2 
1+푘 2 + 
퐷3 
1+푘 3 + 
퐷4 
1+푘 4 + 
퐷5 
1+푘 5 + 
퐷푛+푆푛 
1+푘 푛 
= 
15(1+0.5)1 
1+0.15 1 + 
15(1+0.5)2 
1+0.15 2 + 
15(1+0.5)3 
1+0.15 3 + 
15(1+0.5)4 
1+0.15 4 + 
15(1+0.5)5 
1+0.15 5 + 
56.63+8.2 
1+0.15 5 
= 19.57+25.51+33.29+43.42+56.63+32.23 
= 210.65
Constant growth rate: 
퐷0(1+g) 
(푘−푔) 
= 
So= 
15(1+0.5) 
0.15−0.5 
= 
22.5 
−.35 
= -64.29 
Earnings per share: 푁푒푡 푖푛푐표푚푒 
푂푢푡푠푡푎푛푑푖푛푔 푠ℎ푎푟푒 
= 299 푚푖푙푙푖표푛 
300 푚푖푙푙푖표푛 
= 0.997 
P/E rate = 푆ℎ푎푟푒 푝푟푖푐푒 
퐸푎푟푛푖푛푔푠 푝푒푟 푠ℎ푎푟푒 
= 16.9 
0.997 
= 16.95
Bangladesh Finance and Investment co. Ltd 
One-year holding period: 
So = 
퐷1 
1+푘 
+ 
푆1 
1+푘 
= 
퐷표 1+푔 
1+푘 
+ 
푆1 
1+푘 
= 
10(1+0) 
1+.15 
+ 
11 
1+.15 
= 8.69+9.56 
= 18.25 
Date Price 
Aug, 3-14 16.9 tk 
Aug, 1-13 25.3 tk 
Aug, 1-12 46.1 tk 
S1 = 11 , D0=10 
Rate of return required by the investor k = 15% 
Growth Rate: 
푃푟푒푠푒푛푡 푦푒푎푟 푑푒푣푒푑푛푑−푃푟푒푣푖표푢푠 푦푒푎푟 푑푒푣푒푑푒푛푑 
푃푟푒푣푖표푢푠 푦푒푎푟 푑푒푣푒푑푒푛푑 
G = 
2013−2012 
2012 
= 
10−10 
10 
= 0% 
Average growth rate = 0% 
G = 
2012−2011 
2011 
= 
10−10 
10 
= 0%
Multiple year holding periods: 
So= 
퐷1 
1+푘 1 + 
퐷2 
1+푘 2 + 
퐷3 
1+푘 3 + 
퐷4 
1+푘 4 + 
퐷5 
1+푘 5 + 
퐷푛+푆푛 
1+푘 푛 
= 
10(1+0)1 
1+0.15 1 + 
10(1+0)2 
1+0.15 2 + 
10(1+0)3 
1+0.15 3 + 
10(1+0)4 
1+0.15 4 + 
10(1+0)5 
1+0.15 5 + 
74.97+11 
1+0.15 5 
= 8.69+7.56+6.57+5.71+4.97+7.94 
= 41.45
Constant growth rate: 
퐷0(1+g) 
(푘−푔) 
= 
So= 
10(1+0) 
0.15−0 
= 
10 
0.15 
= 66.66 
Earnings per share: 푁푒푡 푖푛푐표푚푒 
푂푢푡푠푡푎푛푑푖푛푔 푠ℎ푎푟푒 
= 93.39 푚푖푙푙푖표푛 
200 푚푖푙푙푖표푛 
= .47 
P/E rate = 
푆ℎ푎푟푒 푝푟푖푐푒 
퐸푎푟푛푖푛푔푠 푝푒푟 푠ℎ푎푟푒 
= 10 
.47 
= 21.41
Comparison of companies 
 We are working on 10 investment companies of DSE. And we are 
finding that ICB Company is the best company in the investment 
sector. Because of the companies sell price is decreased day by day, 
their selling price are fall in but ICB’s selling price is high day by day. 
 Other hand ICB gives higher rate of dividend. Their dividend rate also 
increased year by year.

Share valuation

  • 2.
    Date Price Aug,3-14 24.6 tk Aug, 1-13 28 tk Aug, 1-12 38.8 tk One-year holding period: So = 퐷1 1+푘 + 푆1 1+푘 = 퐷표 1+푔 1+푘 + 푆1 1+푘 = 17{1+ −.1333 } 1+.15 + 22 1+.15 = 16.75+19.13 = 35.88 D0=17 , S1 = 22 Rate of return required by the investor k = 15% Growth Rate = 푃푟푒푠푒푛푡 푦푒푎푟 푑푒푣푒푑푛푑−푃푟푒푣푖표푢푠 푦푒푎푟 푑푒푣푒푑푒푛푑 푃푟푒푣푖표푢푠 푦푒푎푟 푑푒푣푒푑푒푛푑 G = 2013−2012 2012 = 17−15 15 = 13.33% G = 2012−2011 2011 = 15−15 15 = 0% Bay leasing and Investment .Ltd
  • 3.
    Multiple year holdingperiods So= 퐷1 1+푘 1 + 퐷2 1+푘 2 + 퐷3 1+푘 3 + 퐷4 1+푘 4 + 퐷5 1+푘 5 + = 17(1+.1333)1 1+0.15 1 + 17(1+.1333)2 1+0.15 2 + 17(1+.1333)3 1+0.15 3 + 17(1+.1333)4 1+0.15 4 + 17(1+.1333)5 1+0.15 5 + 15.80+22 1+0.15 5 = 16.75+16.50+16.27+16.03+15.80+8.79 = 100.14
  • 4.
    Constant growth rate: 퐷0(1+g) (푘−푔) = So= 17(1+.1333) 0.15−.1333 = 19.27 .0167 = 1153.89 Earnings per share: 푁푒푡 푖푛푐표푚푒 푂푢푡푠푡푎푛푑푖푛푔 푠ℎ푎푟푒 = 137.52 푚푖푙푙푖표푛 300 푚푖푙푙푖표푛 = .46 P/E rate = 푆ℎ푎푟푒 푝푟푖푐푒 퐸푎푟푛푖푛푔푠 푝푒푟 푠ℎ푎푟푒 = 17 .46 = 37.08
  • 5.
    One-year holding period: So = 퐷1 1+푘 + 푆1 1+푘 = 퐷표 1+푔 1+푘 + 푆1 1+푘 = 40(1+.64) 1+.15 + 2000 1+.15 = 57.04+1739.13 = 1796.17 Date Price Aug, 3-14 1898 tk Aug, 1-13 1820 tk Aug, 1-12 1683 tk S1 = 2000 , D0=40 Rate of return required by the investor k = 15% Growth Rate: 푃푟푒푠푒푛푡 푦푒푎푟 푑푒푣푒푑푛푑−푃푟푒푣푖표푢푠 푦푒푎푟 푑푒푣푒푑푒푛푑 푃푎푠푡 푦푒푎푟 푑푒푣푒푑푒푛푑 G = 2013−2012 2012 = 40−25 25 = 0.6% G = 2012−2011 2011 = 25−15 15 = 0.67% Average rate = .6+.67 2 = 0.64% ICB ( Investment corporation of Bangladesh
  • 6.
    Multiple year holdingperiod So= 퐷1 1+푘 1 + 퐷2 1+푘 2 + 퐷3 1+푘 3 + 퐷4 1+푘 4 + 퐷5 1+푘 5 + 퐷푛+푆푛 1+푘 푛 = 40(1+.64)1 1+0.15 1 + 40(1+.64)2 1+0.15 2 + 40(1+.64)3 1+0.15 3 + 40(1+.64)4 1+0.15 4 + 40(1+.64)5 1+0.15 5 + 235.93+2000 1+0.15 5 = 57.04+81.34+116.01+165.44+235.93+1111.65 = 1767.41
  • 7.
    Constant growth rate: 퐷0(1+g) (푘−푔) = So= 40(1+.64) 0.15−.64 = 65.6 −0.49 = -133.88 Earnings per share = 푁푒푡 푖푛푐표푚푒 푂푢푡푠푡푎푛푑푖푛푔 푠ℎ푎푟푒 = 3764.24 푚푖푙푙푖표푛 100 푚푖푙푙푖표푛 = 37.64 P/E rate = 푆ℎ푎푟푒 푝푟푖푐푒 퐸푎푟푛푖푛푔푠 푝푒푟 푠ℎ푎푟푒 = 40 37.64 = 1.06
  • 8.
    Internal Leasing andfinancial service Ltd. One-year holding period: So= 퐷1 1+푘 + 푆1 1+푘 = 퐷표 1+푔 1+푘 + 푆1 1+푘 = 5(1+0) 1+.15 + 8 1+.15 = 4.35+6.96 = 11.30 Date Price Aug, 3-14 10.9 tk Aug, 1-13 12.5 tk Aug, 1-12 21 tk S1 = 8 ,D0=5 Rate of return required by the investor k = 15% Growth Rate: 푃푟푒푠푒푛푡 푦푒푎푟 푑푒푣푒푑푛푑−푃푟푒푣푖표푢푠 푦푒푎푟 푑푒푣푒푑푒푛푑 푃푎푠푡 푦푒푎푟 푑푒푣푒푑푒푛푑 G = 2014−2013 2013 = 5−5 5 = 0% This company give last two years dividend.
  • 9.
    Multiple year holdingperiod: So= 퐷1 1+푘 1 + 퐷2 1+푘 2 + 퐷3 1+푘 3 + 퐷4 1+푘 4 + 퐷5 1+푘 5 + 퐷푛+푆푛 1+푘 푛 = 5(1+0)1 1+0.15 1 + 5(1+0)2 1+0.15 2 + 5(1+0)3 1+0.15 3 + 5(1+0)4 1+0.15 4 + 5(1+0)5 1+0.15 5 + 2.48+8 1+0.15 5 = 4.35+3.78+3.28+2.86+2.48+5.21 = 21.96
  • 10.
    Constant growth rate: 퐷0(1+g) (푘−푔) = So= 5(1+0) 0.15−0 = 33.33 Earnings per share: 푁푒푡 푖푛푐표푚푒 푂푢푡푠푡푎푛푑푖푛푔 푠ℎ푎푟푒 = 116.74 푚푖푙푙푖표푛 200 푚푖푙푙푖표푛 = 0.58 P/E rate = 푆ℎ푎푟푒 푝푟푖푐푒 퐸푎푟푛푖푛푔푠 푝푒푟 푠ℎ푎푟푒 = 5 0.58 = 8.62
  • 11.
    Industrial prom. andDev. Co. of. BD.Ltd One-year holding period: So= 퐷1 1+푘 + 푆1 1+푘 = 퐷표 1+푔 1+푘 + 푆1 1+푘 = 5{1+ −0.5 } 1+.15 + 14 1+.15 = 2.17 + 12.17 = 14.34 S1 = 14 , D0=5 Rate of return required by the investor k = 15% Date Price Aug, 3-14 15.0 tk Aug, 1-13 16.6 tk Aug, 1-12 17.6 tk G = 2013−2012 2012 = 5−10 10 = - 0.5 This company only give last two year dividend
  • 12.
    Multiple year holdingperiod: So= 퐷1 1+푘 1 + 퐷2 1+푘 2 + 퐷3 1+푘 3 + 퐷4 1+푘 4 + 퐷5 1+푘 5 + 퐷푛+푆푛 1+푘 푛 = 5{1+ −0.5 }1 1+0.15 1 + 5{1+ −0.5 }2 1+0.15 2 + 5{1+ −0.5 }3 1+0.15 3 + 5{1+ −0.5 }4 1+0.15 4 + 5{1+ −0.5 }5 1+0.15 5 + 0.08+14 1+0.15 5 = 2.17 + 0.95 + 0.41 + 0.18 + 0.08 + 7 = 10.79
  • 13.
    Constant growth rate: 퐷0(1+g) (푘−푔) = So= 5{1+ −0.05 } 0.15+(−0.05) = 2.5 −0.35 = -7.14 Earnings per share: 푁푒푡 푖푛푐표푚푒 푂푢푡푠푡푎푛푑푖푛푔 푠ℎ푎푟푒 = 141.98 푚푖푙푙푖표푛 400 푚푖푙푙푖표푛 = .35 P/E rate = 푆ℎ푎푟푒 푝푟푖푐푒 퐸푎푟푛푖푛푔푠 푝푒푟 푠ℎ푎푟푒 = 5 .35 = 14.08
  • 14.
    United leasing One-yearholding period: So = 퐷1 1+푘 + 푆1 1+푘 = 퐷표 1+푔 1+푘 + 푆1 1+푘 = 5{1+ −.33 } 1+.15 + 17.2 1+.15 = 3.91+14.96 = 17.87 Date Price Aug, 3-14 22.4 tk Aug, 1-13 27.4 tk Aug, 1-12 31.8 tk S1 = 17 , D0=5 Rate of return required by the investor k = 15% G = 2014−2013 2013 = 5−5 5 = 0% G = 2013−2012 2012 = 5−7.5 7.5 = -0.33%
  • 15.
    Multiple year holdingperiods: So= 퐷1 1+푘 1 + 퐷2 1+푘 2 + 퐷3 1+푘 3 + 퐷4 1+푘 4 + 퐷5 1+푘 5 + 퐷푛+푆푛 1+푘 푛 5{1+(−.33)}1 = 1+0.15 1 + 5{1+(−.33)}2 1+0.15 2 + 5{1+(−.33)}3 1+0.15 3 + 5{1+(−.33)}4 1+0.15 4 + 5{1+(−.33)}5 1+0.15 5 + .33+17.2 1+0.15 5 = 3.91+1.69+.99+.58+.33+8.72 = 15.22
  • 16.
    Constant growth rate: 퐷0(1+g) (푘−푔) = So= 5{1+ −.33 } 0.15−(−.33) = 3.35 .48 = 6.98 Earnings per share: 푁푒푡 푖푛푐표푚푒 푂푢푡푠푡푎푛푑푖푛푔 푠ℎ푎푟푒 = 266.42 푚푖푙푙푖표푛 300 푚푖푙푙푖표푛 = .89 P/E rate = 푆ℎ푎푟푒 푝푟푖푐푒 퐸푎푟푛푖푛푔푠 푝푒푟 푠ℎ푎푟푒 = 5 .89 = 5.63
  • 17.
    Delta Brac housingfinance corp. Ltd. One-year holding period: So= 퐷1 1+푘 + 푆1 1+푘 = 퐷표 1+푔 1+푘 + 푆1 1+푘 = 25(1+1.5) 1+.15 + 56 1+.15 = 54.35+48.69 = 103.04 S1 = 56, D0=25 Rate of return required by the investor k = 15% Date Price Aug, 3-14 58 tk Aug, 1-13 58.9 tk Aug, 1-12 75.5 tk Growth Rate: 푃푟푒푠푒푛푡 푦푒푎푟 푑푒푣푒푑푛푑−푃푟푒푣푖표푢푠 푦푒푎푟 푑푒푣푒푑푒푛푑 푃푎푠푡 푦푒푎푟 푑푒푣푒푑푒푛푑 G = 2013−2012 2012 = 25−10 10 = 1.5%
  • 18.
    Multiple year holdingperiod: So= 퐷1 1+푘 1 + 퐷2 1+푘 2 + 퐷3 1+푘 3 + 퐷4 1+푘 4 + 퐷5 1+푘 5 + 퐷푛+푆푛 1+푘 푛 = 25(1+1.5)1 1+0.15 1 + 25(1+1.5)2 1+0.15 2 + 25(1+1.5)3 1+0.15 3 + 25(1+1.5)4 1+0.15 4 + 25(1+1.5)5 1+0.15 5 + 1213.81+56 1+0.15 5 = 54.35+118.14+256.84+558.35+1213.8+631.32 = 2832.81
  • 19.
    Constant growth rate: 퐷0(1+g) (푘−푔) = So= 5(1+1.5) 0.15−1.5 = 12.5 −1.35 = -9.26 Earnings per share: 푁푒푡 푖푛푐표푚푒 푂푢푡푠푡푎푛푑푖푛푔 푠ℎ푎푟푒 = 518.48 푚푖푙푙푖표푛 200 푚푖푙푙푖표푛 =2.59 P/E rate = 푆ℎ푎푟푒 푝푟푖푐푒 퐸푎푟푛푖푛푔푠 푝푒푟 푠ℎ푎푟푒 = 25 2.59 = 9.65
  • 20.
    Bangladesh industrial finance.co.Ltd One-year holding period: So = 퐷1 1+푘 + 푆1 1+푘 = 퐷표 1+푔 1+푘 + 푆1 1+푘 = 5{1+ −.5 } 1+.15 + 16 1+.15 = 2.17+13.91 = 16.08 Date Price Aug, 3-14 14.7 tk Aug, 1-13 13.3 tk Aug, 1-12 28.4 tk S1 = 16 , D0=5 Rate of return required by the investor k = 15% Growth Rate: 푃푟푒푠푒푛푡 푦푒푎푟 푑푒푣푒푑푛푑−푃푟푒푣푖표푢푠 푦푒푎푟 푑푒푣푒푑푒푛푑 푃푟푒푣푖표푢푠 푦푒푎푟 푑푒푣푒푑푒푛푑 G = 2014−2013 2013 = 5−5 5 = 0% G = 2013−2012 2012 = 5−10 10 = -0.5%
  • 21.
    Multiple year holdingperiods: So= 퐷1 1+푘 1 + 퐷2 1+푘 2 + 퐷3 1+푘 3 + 퐷4 1+푘 4 + 퐷5 1+푘 5 + 퐷푛+푆푛 1+푘 푛 = 5{1+(−0.5)}1 1+0.15 1 + 5{1+(−0.5)}2 1+0.15 2 + 5{1+(−0.5)}3 1+0.15 3 + 5{1+(−0.5)}4 1+0.15 4 + 5{1+(−0.5)}5 1+0.15 5 + 0.07+16 1+0.15 5 = 2.17+.94+.41+.18+.07+8 = 11.76
  • 22.
    Constant growth rate: 퐷0(1+g) (푘−푔) = So= 5{1+(−0.5)} 0.15−(−0.5) = 2.5 .65 = 3.84 Earnings per share: 푁푒푡 푖푛푐표푚푒 푂푢푡푠푡푎푛푑푖푛푔 푠ℎ푎푟푒 = 45.51 푚푖푙푙푖표푛 200 푚푖푙푙푖표푛 = .23 P/E rate = 푆ℎ푎푟푒 푝푟푖푐푒 퐸푎푟푛푖푛푔푠 푝푒푟 푠ℎ푎푟푒 = 5 .23 = 21.74
  • 23.
    Uttara Finance One-yearholding period: So = 퐷1 1+푘 + 푆1 1+푘 = 퐷표 1+푔 1+푘 + 푆1 1+푘 = 30(1+0.5) 1+.15 + 55 1+.15 = 39.13+47.83 = 89.95 Date Price Aug, 3-14 66 tk Aug, 1-13 74.1 tk Aug, 1-12 85.8 tk S1 = 55 , D0=30 Rate of return required by the investor k = 15% Growth Rate: 푃푟푒푠푒푛푡 푦푒푎푟 푑푒푣푒푑푛푑−푃푟푒푣푖표푢푠 푦푒푎푟 푑푒푣푒푑푒푛푑 푃푟푒푣푖표푢푠 푦푒푎푟 푑푒푣푒푑푒푛푑 G = 2013−2012 2012 = 30−20 20 = 0.5% The company provide last two years dividend.
  • 24.
    Multiple year holdingperiods: So= 퐷1 1+푘 1 + 퐷2 1+푘 2 + 퐷3 1+푘 3 + 퐷4 1+푘 4 + 퐷5 1+푘 5 + 퐷푛+푆푛 1+푘 푛 = 30(1+0.5)1 1+0.15 1 + 30(1+0.5)2 1+0.15 2 + 30(1+0.5)3 1+0.15 3 + 30(1+0.5)4 1+0.15 4 + 30(1+0.5)5 1+0.15 5 + 113.27+55 1+0.15 5 = 39.13+51.03+66.57+86.84+113.27+83.6 = 440.50
  • 25.
    Constant growth rate: 퐷0(1+g) (푘−푔) = So= 30(1+0.5) 0.15−0.5 = 45 −.35 = -128.57 Earnings per share: 푁푒푡 푖푛푐표푚푒 푂푢푡푠푡푎푛푑푖푛푔 푠ℎ푎푟푒 = 852.83 푚푖푙푙푖표푛 500 푚푖푙푙푖표푛 = 1.70 P/E rate = 푆ℎ푎푟푒 푝푟푖푐푒 퐸푎푟푛푖푛푔푠 푝푒푟 푠ℎ푎푟푒 = 60 1.70 = 35.17
  • 26.
    Prime finance andInvestment Ltd. One-year holding period: So = 퐷1 1+푘 + 푆1 1+푘 = 퐷표 1+푔 1+푘 + 푆1 1+푘 = 15(1+0.5) 1+.15 + 8.2 1+.15 = 19.57+7.13 = 26.70 Date Price Aug, 3-14 16.9 tk Aug, 1-13 25.3 tk Aug, 1-12 46.1 tk S1 = 8.2 , D0=15 Rate of return required by the investor k = 15% Growth Rate: 푃푟푒푠푒푛푡 푦푒푎푟 푑푒푣푒푑푛푑−푃푟푒푣푖표푢푠 푦푒푎푟 푑푒푣푒푑푒푛푑 푃푟푒푣푖표푢푠 푦푒푎푟 푑푒푣푒푑푒푛푑 G = 2013−2012 2012 = 15−10 10 = 0.5% The company provide only last two years dividend
  • 27.
    Multiple year holdingperiods: So= 퐷1 1+푘 1 + 퐷2 1+푘 2 + 퐷3 1+푘 3 + 퐷4 1+푘 4 + 퐷5 1+푘 5 + 퐷푛+푆푛 1+푘 푛 = 15(1+0.5)1 1+0.15 1 + 15(1+0.5)2 1+0.15 2 + 15(1+0.5)3 1+0.15 3 + 15(1+0.5)4 1+0.15 4 + 15(1+0.5)5 1+0.15 5 + 56.63+8.2 1+0.15 5 = 19.57+25.51+33.29+43.42+56.63+32.23 = 210.65
  • 28.
    Constant growth rate: 퐷0(1+g) (푘−푔) = So= 15(1+0.5) 0.15−0.5 = 22.5 −.35 = -64.29 Earnings per share: 푁푒푡 푖푛푐표푚푒 푂푢푡푠푡푎푛푑푖푛푔 푠ℎ푎푟푒 = 299 푚푖푙푙푖표푛 300 푚푖푙푙푖표푛 = 0.997 P/E rate = 푆ℎ푎푟푒 푝푟푖푐푒 퐸푎푟푛푖푛푔푠 푝푒푟 푠ℎ푎푟푒 = 16.9 0.997 = 16.95
  • 29.
    Bangladesh Finance andInvestment co. Ltd One-year holding period: So = 퐷1 1+푘 + 푆1 1+푘 = 퐷표 1+푔 1+푘 + 푆1 1+푘 = 10(1+0) 1+.15 + 11 1+.15 = 8.69+9.56 = 18.25 Date Price Aug, 3-14 16.9 tk Aug, 1-13 25.3 tk Aug, 1-12 46.1 tk S1 = 11 , D0=10 Rate of return required by the investor k = 15% Growth Rate: 푃푟푒푠푒푛푡 푦푒푎푟 푑푒푣푒푑푛푑−푃푟푒푣푖표푢푠 푦푒푎푟 푑푒푣푒푑푒푛푑 푃푟푒푣푖표푢푠 푦푒푎푟 푑푒푣푒푑푒푛푑 G = 2013−2012 2012 = 10−10 10 = 0% Average growth rate = 0% G = 2012−2011 2011 = 10−10 10 = 0%
  • 30.
    Multiple year holdingperiods: So= 퐷1 1+푘 1 + 퐷2 1+푘 2 + 퐷3 1+푘 3 + 퐷4 1+푘 4 + 퐷5 1+푘 5 + 퐷푛+푆푛 1+푘 푛 = 10(1+0)1 1+0.15 1 + 10(1+0)2 1+0.15 2 + 10(1+0)3 1+0.15 3 + 10(1+0)4 1+0.15 4 + 10(1+0)5 1+0.15 5 + 74.97+11 1+0.15 5 = 8.69+7.56+6.57+5.71+4.97+7.94 = 41.45
  • 31.
    Constant growth rate: 퐷0(1+g) (푘−푔) = So= 10(1+0) 0.15−0 = 10 0.15 = 66.66 Earnings per share: 푁푒푡 푖푛푐표푚푒 푂푢푡푠푡푎푛푑푖푛푔 푠ℎ푎푟푒 = 93.39 푚푖푙푙푖표푛 200 푚푖푙푙푖표푛 = .47 P/E rate = 푆ℎ푎푟푒 푝푟푖푐푒 퐸푎푟푛푖푛푔푠 푝푒푟 푠ℎ푎푟푒 = 10 .47 = 21.41
  • 32.
    Comparison of companies  We are working on 10 investment companies of DSE. And we are finding that ICB Company is the best company in the investment sector. Because of the companies sell price is decreased day by day, their selling price are fall in but ICB’s selling price is high day by day.  Other hand ICB gives higher rate of dividend. Their dividend rate also increased year by year.