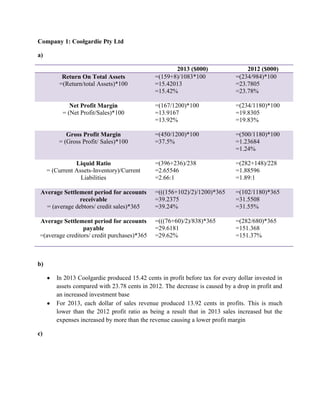
Company 1: In 2013, Coolgardie's return on assets decreased to 15.42% from 23.78% in 2012 due to a drop in profit and increased assets. The net profit margin also decreased from 19.83% to 13.92% as expenses increased more than revenue.
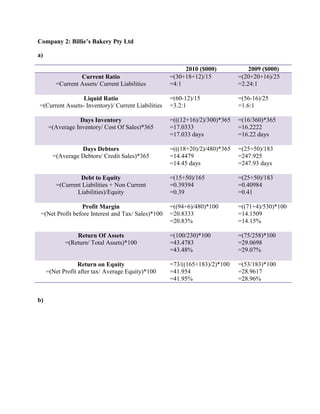
Company 2: In 2010, Billie's Bakery had higher liquidity and profitability ratios compared to 2009. The debt to equity ratio was lower in 2010 at 0.39 compared to 0.41 in 2009.
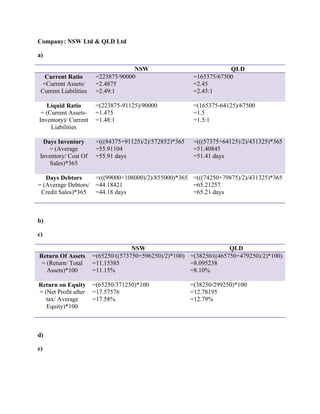
NSW Ltd and QLD Ltd: In the current year, NSW Ltd had higher returns and shorter days for inventory and debtors compared to QLD Ltd, while their current and liquid