Download to read offline
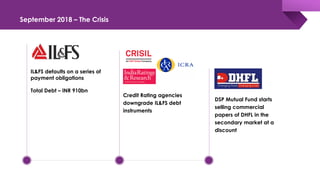
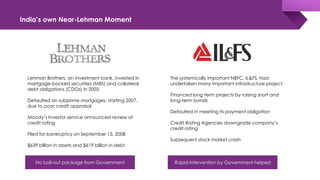


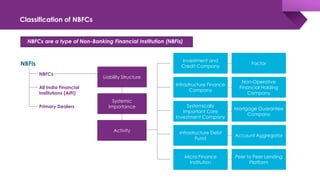
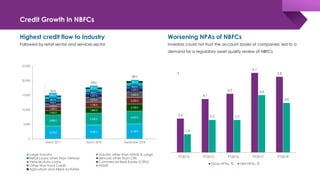
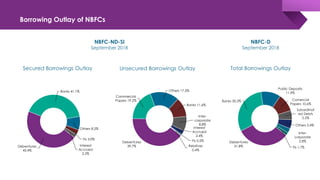

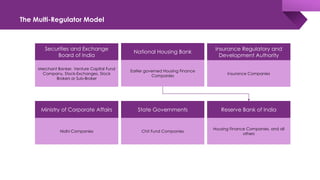
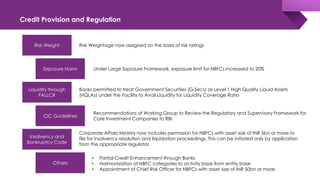

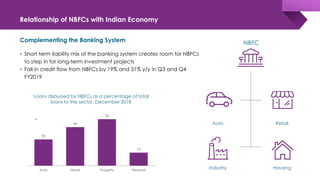

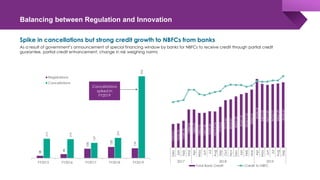


The document discusses the shadow banking crisis in India during 2018, focusing on the defaults of Infrastructure Leasing & Financial Services (IL&FS) and its consequences on the economy, particularly the non-banking financial companies (NBFCs). It outlines how credit rating downgrades, liquidity issues, and market reactions led to significant declines in equity markets and increased borrowing costs for the NBFC sector. The text also highlights the complex regulatory framework and the relationship between NBFCs and the broader Indian economy, emphasizing the challenges posed by deteriorating investor trust and rising non-performing assets.


