SGS Supply Chain Solution - Dashboard KPI's Paper
•
2 likes•495 views

The document discusses supply chain transparency and key performance indicators (KPIs) for measuring supply chain risk. It notes that today's consumers demand greater product safety, quality and transparency in supply chains. It then describes a dashboard for measuring supply chain visibility, supplier transparency, food safety risk, social responsibility risk and other risks. The dashboard is meant to help companies measure how much revenue may be at risk due to issues in their supply chains and identify areas for improvement.

Recommended
Recommended
More Related Content
Viewers also liked
Viewers also liked (17)
Similar to SGS Supply Chain Solution - Dashboard KPI's Paper
Similar to SGS Supply Chain Solution - Dashboard KPI's Paper (20)
SGS Supply Chain Solution - Dashboard KPI's Paper
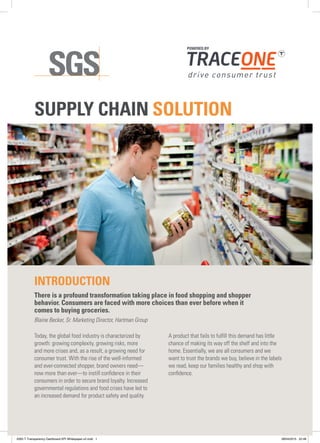
- 1. INTRODUCTION There is a profound transformation taking place in food shopping and shopper behavior. Consumers are faced with more choices than ever before when it comes to buying groceries. Blaine Becker, Sr. Marketing Director, Hartman Group SUPPLY CHAIN SOLUTION POWERED BY Today, the global food industry is characterized by growth: growing complexity, growing risks, more and more crises and, as a result, a growing need for consumer trust. With the rise of the well-informed and ever-connected shopper, brand owners need— now more than ever—to instill confidence in their consumers in order to secure brand loyalty. Increased governmental regulations and food crises have led to an increased demand for product safety and quality. A product that fails to fulfill this demand has little chance of making its way off the shelf and into the home. Essentially, we are all consumers and we want to trust the brands we buy, believe in the labels we read, keep our families healthy and shop with confidence. 0263 T Transparency Dashboard KPI Whitepaper-v2.indd 1 28/04/2015 22:48
- 2. KEY PERFORMANCE INDICATORS Real-life examples of progressive companies’ reporting are valuable in demonstrating the breadth of content and quality of presentation that can be achieved. The following metrics were chosen based on their ability to align industry KPIs with specific corporate strategies and objectives. VISIBILITY • How much information is available about a product supply chain • Visibility decreases if information about the product is missing or if a supplier hides information about ingredients or origin THE CHALLENGE In today’s world we need to monitor our supply chain and measure our product compliance to drive consumer trust. • But how do we achieve this? • How do we know who is in our supply chain? • Are there unknown sources upstream? • Are the growers compliant with the produce safety rule? All of these unanswered questions boil down to the two key challenges: identifying ingredient risks and supplier risks. TRANSPARENCY • How much information does the supplier share about the products • Transparency decreases if the supplier fails to share information about all products and their ingredients’ origin 2 0263 T Transparency Dashboard KPI Whitepaper-v2.indd 2 28/04/2015 22:48
- 3. THE DASHBOARD REVENUE Products at Risk 7.2 $bn -10% ? 60% PRODUCTS Average visibility 6843 ? 78% SUPPLIERS Average Transparency 1140 ? 63% FOOD SAFETY Products at Risk 3.1 $bn 0% ? 30% +20% CORPORATE SOCIAL RESPONSIBILITY Products at Risk 4.3 $bn ? 80% RESILIENCE Products at Risk 1.1 $bn -10% ? 12% -10% EXPOSURE Products at Risk 1.7 $bn ? 15% Discovery (not fully visible) Compliance Structure With the SGS Supply Chain Solution, transparency reporting addresses the biggest supply chain risk factors, which are broken down into three key dashboards: 1. DISCOVERY: Do I have enough visibility in my supply chain? 2. COMPLIANCE: Is my supply chain compliant? 3. STRUCTURE: Does my supply chain have the optimal structure? Supply chain risk goes well beyond current E.U. and FSMA regulations. When taking into account the need to build brands, grow business, and driving consumer trust, the supply chain is today’s biggest risk. 3 0263 T Transparency Dashboard KPI Whitepaper-v2.indd 3 28/04/2015 22:48
- 4. 4 REPORTING Each of the three top line sections answers key questions about the effect the supply chain may have on the business. REVENUE Products at Risk 7.2 $bn -10% ? 60% PRODUCTS Average visibility 6843 ? 78% SUPPLIERS Average Transparency 1140 ? 63% FOOD SAFETY Products at Risk 3.1 $bn 0% ? 30% +20% CORPORATE SOCIAL RESPONSABILITY Products at Risk 4.3 $bn ? 80% REVENUE Products at Risk 7.2 $bn -10% ? 60% PRODUCTS Average visibility 6843 ? 78% SUPPLIERS Average Transparency 1140 ? 63% FOOD SAFETY Products at Risk 3.1 $bn 0% ? 30% +20% CORPORATE SOCIAL RESPONSABILITY Products at Risk 4.3 $bn ? 80% PRODUCTS Average visibility 6843 ? 78% SUPPLIERS Average Transparency 1140 ? 63% RESILIENCE Products at Risk 1.1 $bn -10% ? 12% -10% EXPOSURE Products at Risk 1.7 $bn ? 15% RESILIENCE Products at Risk 1.1 $bn -10% ? 12% -10% EXPOSURE Products at Risk 1.7 $bn ? 15% REVENUE FOOD SAFETY PRODUCTS CORPORATE SOCIAL RESPONSIBILITY SUPPLIERS RESILIENCE EXPOSURE Don’t know all of the products in your supply chain? Let this report show you how much of your revenue is at risk. The report measures the financial risk associated with lack of complete knowledge about the supply chain. How much of your business will be impacted by a crisis? This report will show you how much revenue could be at risk in a food safety incident. The report measures unsafe facilities and dangerous ingredients and is based on Food Security Index Data. Do you have supply chain visibility for all of the products in your portfolio? This report will show you how many products are missing a visible supply chain and measures this lack of visibility by product. How much of your business will be impacted by the social issues consumers care about? This report measures the risk of social incidents such as child labor, modern slavery, and sustainability issues. The report measures high social risk supply chains by country and is based on BSCI Data. Have a lot of suppliers in your network? Let this report tell you how many of them are not transparent when it comes to factory, ingredients, and origins. This report measures lack of supplier transparency in the supply chain. How much of your business depends on a single supplier? This report reveals how much of your revenue is tied to a single supplier and measures the risk associated with being highly dependent on one supplier. Do you know how much of your business is exposed to political or regional price fluctuations? This report measures the risk of supply chain disruption and raw material price volatility. This report is based on country and political risks and is calculated from World Bank, World Risk Report. DISCOVERYCOMPLIANCESTRUCTURE 0263 T Transparency Dashboard KPI Whitepaper-v2.indd 4 28/04/2015 22:48
- 5. CONTROL Data is collected in a precise and accurate manner to constantly improve processes. Integrated global information is computed in a way that allows organizations to adapt quickly to improve supply chain quality and safety. Overall, the SGS Supply Chain Solution is a tool to ensure that strategic direction is set across the complete organization, with defined accountabilities, responsibilities, and product safety as business enablers. 5 0263 T Transparency Dashboard KPI Whitepaper-v2.indd 5 28/04/2015 22:48
- 6. CONTACT POWERED BY For more information please visit www.sgs.com/SupplyChain 0263 T Transparency Dashboard KPI Whitepaper-v2.indd 6 28/04/2015 22:48