![Methods
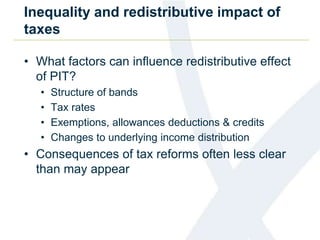
• Progressivity can be decomposed over different
factors:
• Pre-tax income: X
• Tax-exempt income: E
• Tax allowances: A
• Tax deductions: D(X)
• Rate schedule: r(.)
• Tax credits: K
• Net income (N) defined as:
N = X – [r(X – E – A – D(X)] – K]
N = X – Tpit](https://image.slidesharecdn.com/23ffgyisslcr8ccyxyco-signature-0aa1076fef8870271ba3467c193b12f54c4410b860a5b5319158d62f1dd785b7-poli-140830072325-phpapp02/85/Session-8-d-verbist-figari-session-8-d-6-320.jpg)
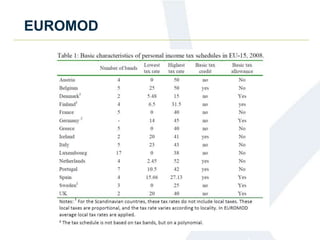

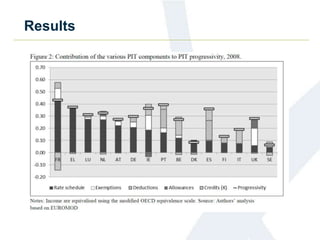

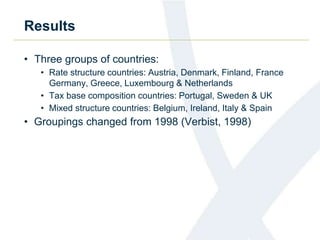
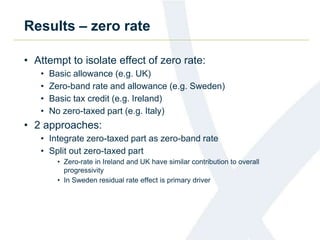


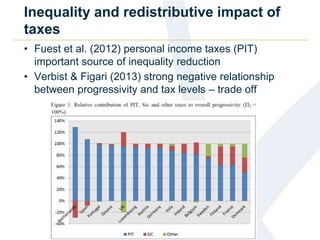
This document summarizes a study that uses EUROMOD microsimulation data to compare the redistributive effects of personal income taxes across 15 European countries. The study finds that tax rate structure is the most important factor influencing redistribution in most countries, accounting for over 80% of total progressivity in some cases. Exemptions and allowances also significantly impact redistribution in some countries. Countries can be grouped into those led by tax rate structure, tax base composition, or a mixed approach. Increasing top tax rates does not necessarily strongly boost progressivity and impacts vary widely between countries.


![Session 7 b commentson daneilkerpaperonukr&d servicelives2014iariw[1]](https://cdn.slidesharecdn.com/ss_thumbnails/pwfpecwntsmdld64j1xg-signature-6de5ee34a7e0a8be608105cfc95b1f55459403214875a488c94e063931d3b0c1-poli-140830080216-phpapp01-thumbnail.jpg?width=640&height=640&fit=bounds)


