Download to read offline


![Regular Expressions: junk
import re
string1 = “This is a! sentence&& with junk!@“
cleanstring1 = re.sub(r'[^w ]', '', string1)
This is a sentence with junk](https://image.slidesharecdn.com/session05cleaningandexploring-160510160255/75/Session-05-cleaning-and-exploring-8-2048.jpg)


![Eyeballing rows
How many rows are there in this dataset?
len(df)
What do my data rows look like?
df.head(5)
df.tail()
df[10:20]](https://image.slidesharecdn.com/session05cleaningandexploring-160510160255/75/Session-05-cleaning-and-exploring-22-2048.jpg)
![Eyeballing columns
What’s in these columns?
df[‘sourceid’]
df[[‘sourceid’,’ag12a_01','ag12a_02_2']]
What’s in the columns when these are true?
df[df.ag12a_01 == ‘YES’]
df[(df.ag12a_01 == 'YES') & (df.ag12a_02_1 == 'NO')]](https://image.slidesharecdn.com/session05cleaningandexploring-160510160255/75/Session-05-cleaning-and-exploring-23-2048.jpg)
![Summarising columns
What are my column names and types?
df.columns
df.dtypes
Which labels do I have in this column?
df['ag12a_03'].unique()
df['ag12a_03'].value_counts()](https://image.slidesharecdn.com/session05cleaningandexploring-160510160255/75/Session-05-cleaning-and-exploring-24-2048.jpg)
![Pivot Tables: Combining data from one dataframe
● pd.pivot_table(df, index=[‘sourceid’, ‘ag12a_03’])](https://image.slidesharecdn.com/session05cleaningandexploring-160510160255/75/Session-05-cleaning-and-exploring-25-2048.jpg)
![Merge: Combining data from multiple frames
longnames = pd.DataFrame({ 'country' : pd.Series(['United States of America', 'Zaire', 'Egypt']),
'longname' : pd.Series([True, True, False])})
merged_data = pd.merge(
left=popstats,
right=longnames,
left_on='Country/territory of residence',
right_on='country')
merged_data[['Year', 'Country/territory of residence', 'longname', 'Total population', 'Origin / Returned from']]](https://image.slidesharecdn.com/session05cleaningandexploring-160510160255/75/Session-05-cleaning-and-exploring-26-2048.jpg)
![Left Joins: Keep everything from the left table…
longnames = pd.DataFrame({ 'country' : pd.Series(['United States of America', 'Zaire', 'Egypt']),
'longname' : pd.Series([True, True, False])})
merged_data = pd.merge(
left=popstats,
right=longnames,
how='left',
left_on='Country/territory of residence',
right_on='country')
merged_data[['Year', 'Country/territory of residence', 'longname', 'Total population', 'Origin / Returned from']]](https://image.slidesharecdn.com/session05cleaningandexploring-160510160255/75/Session-05-cleaning-and-exploring-27-2048.jpg)

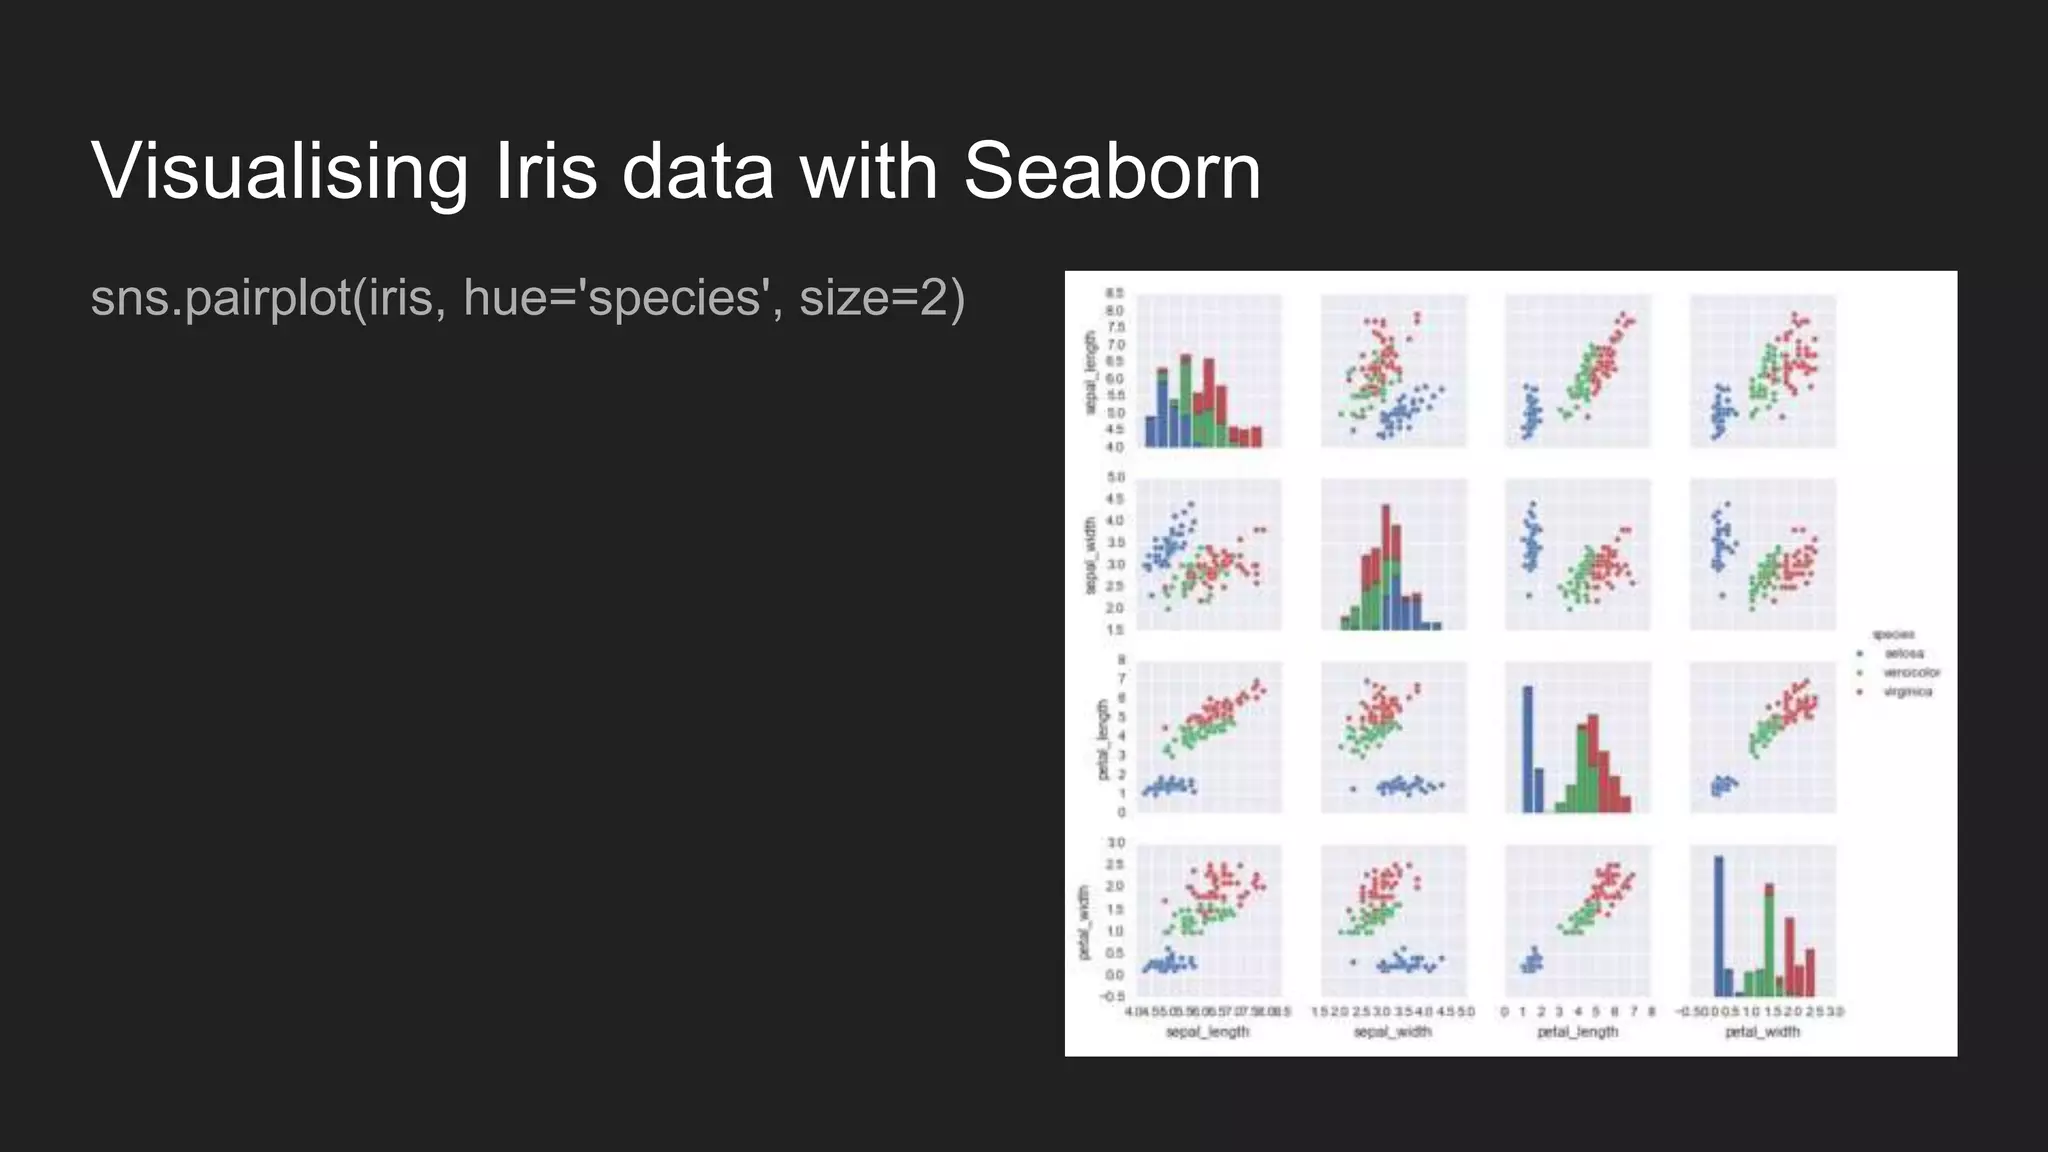

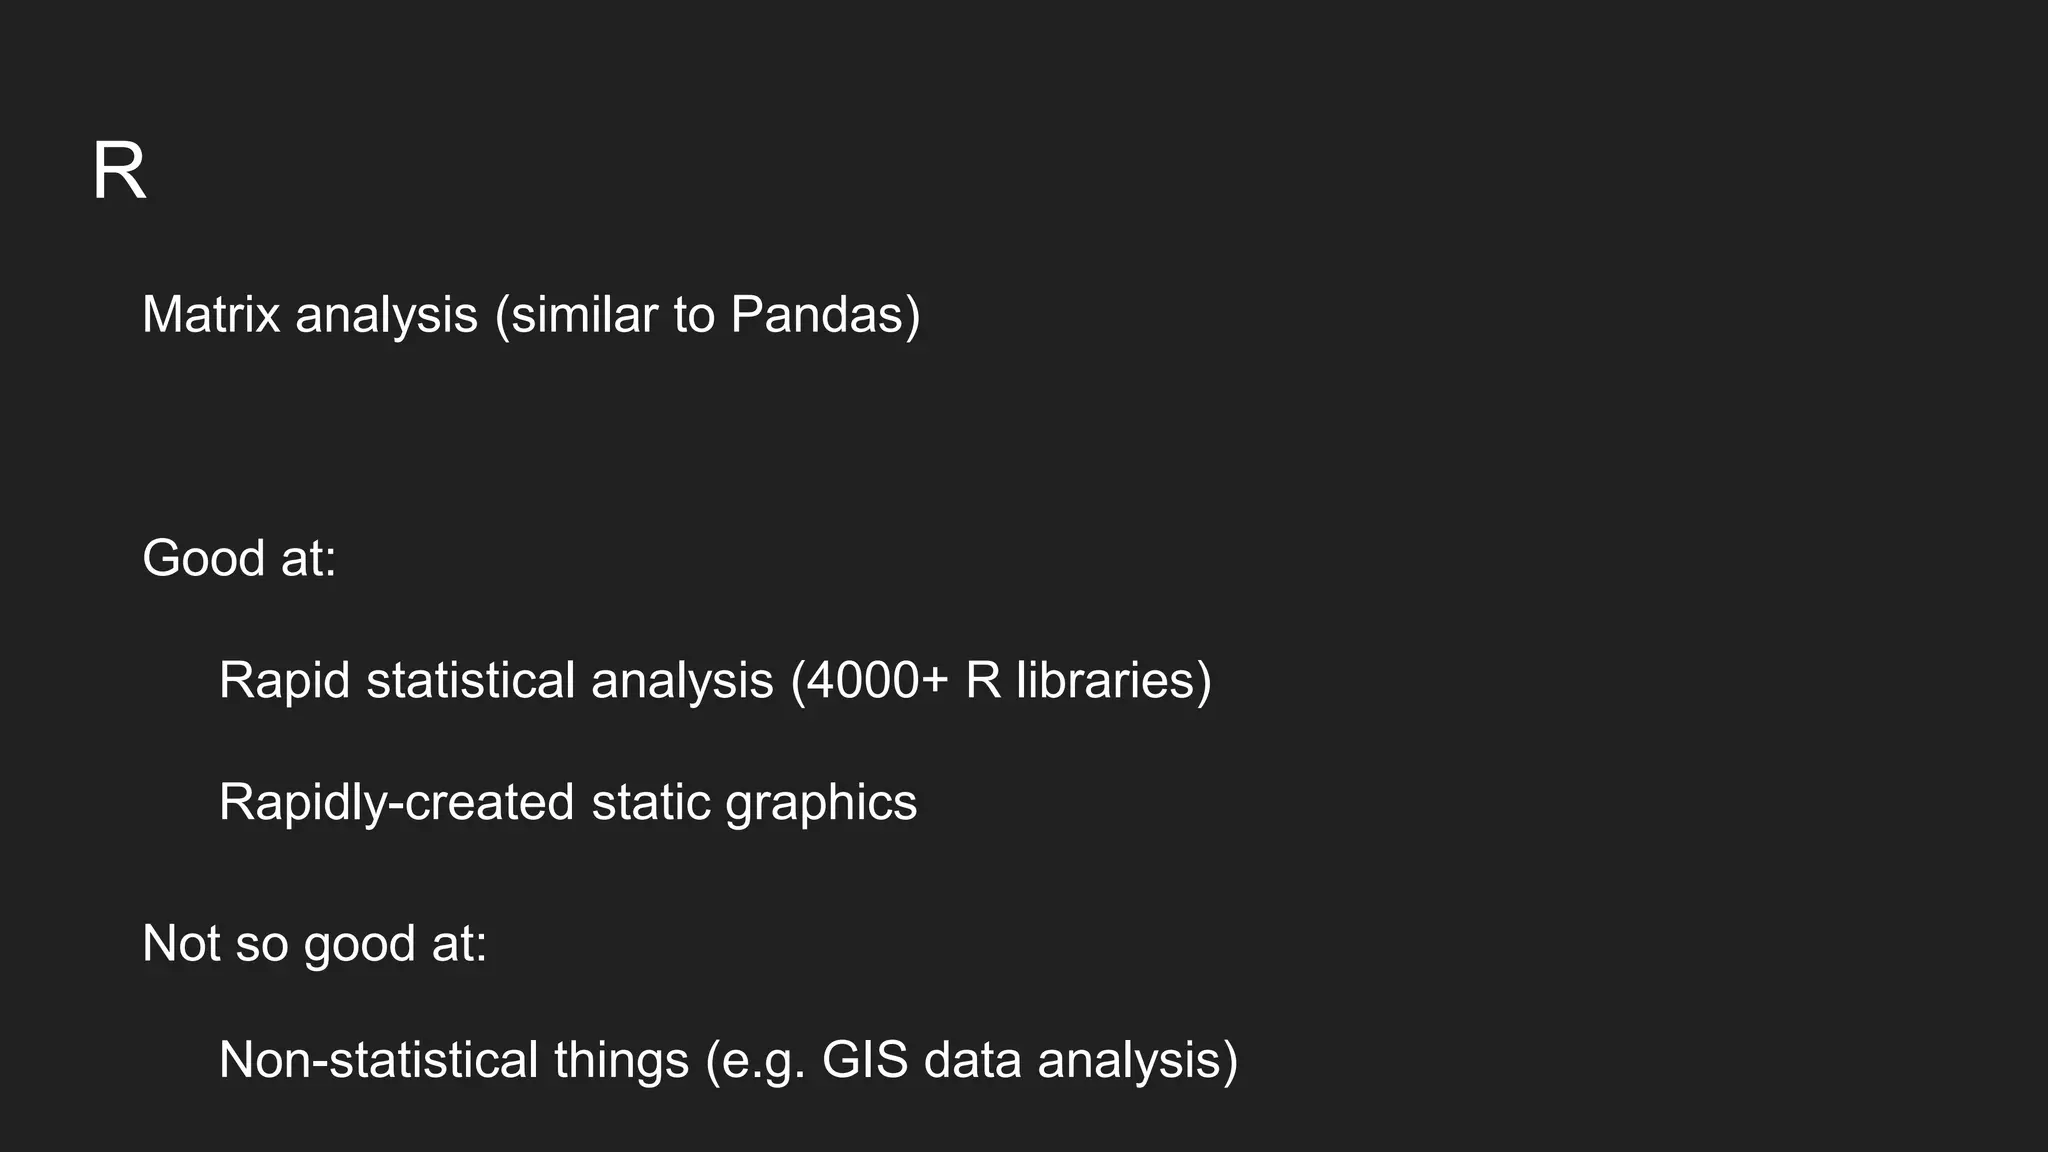
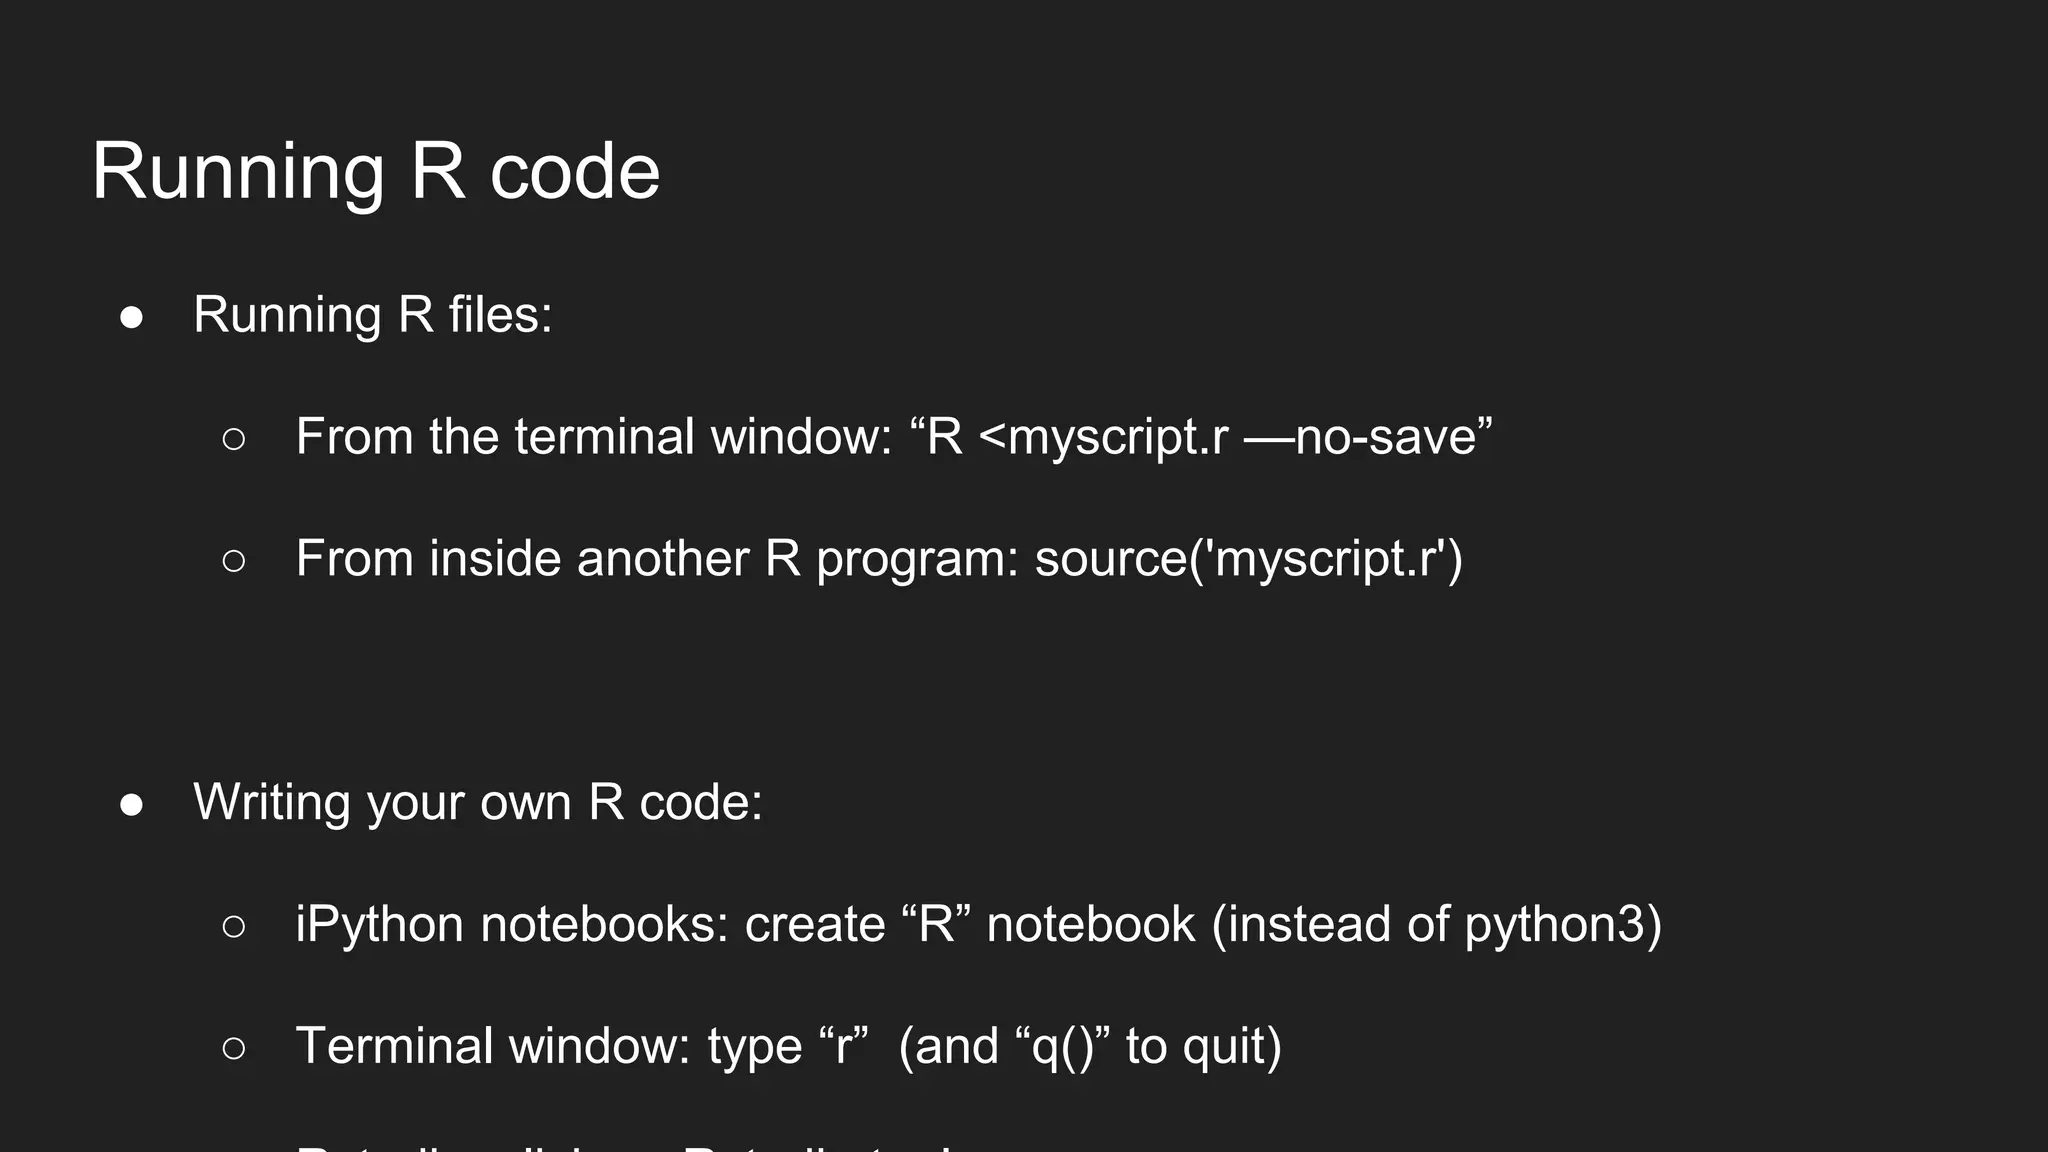


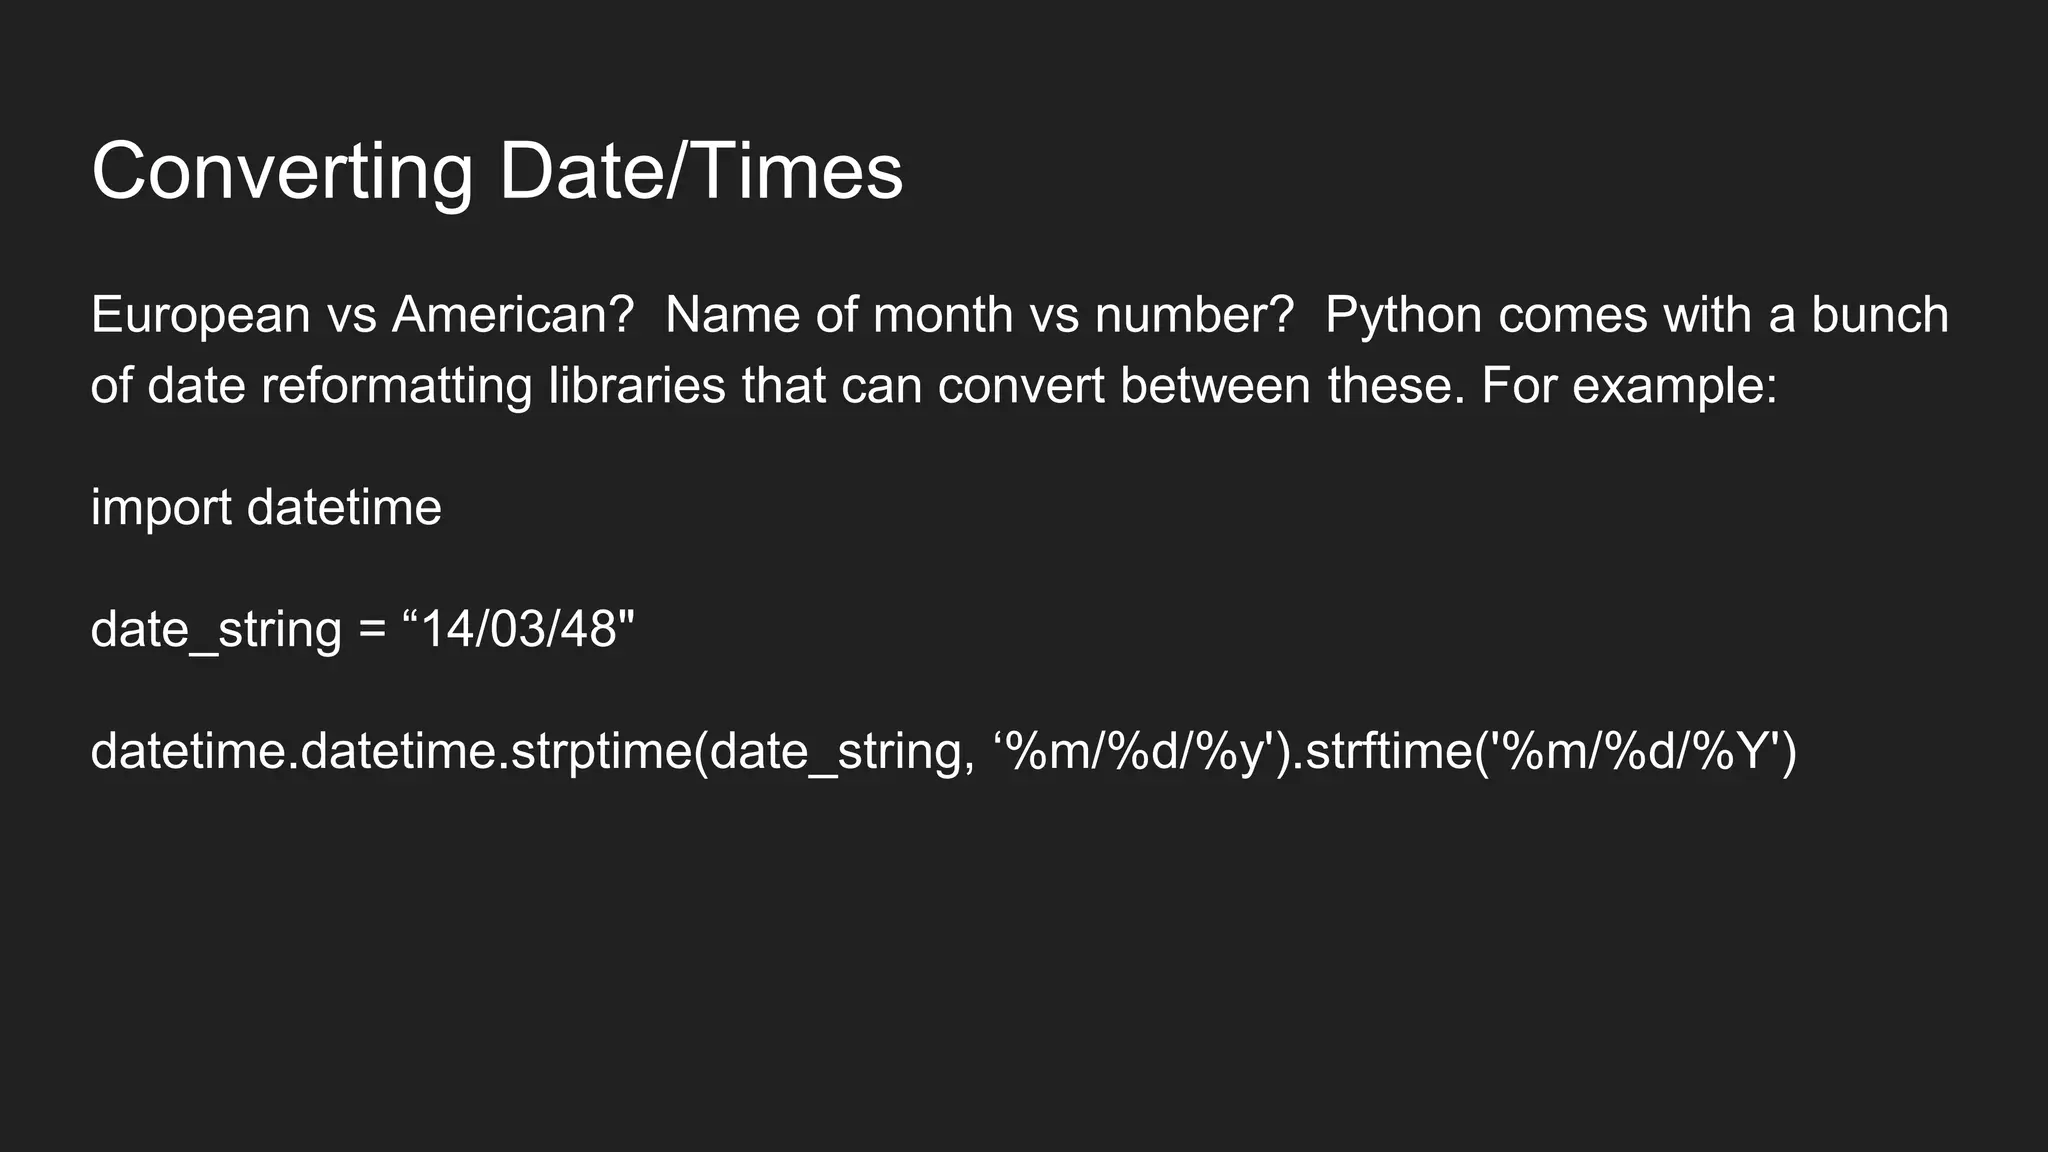
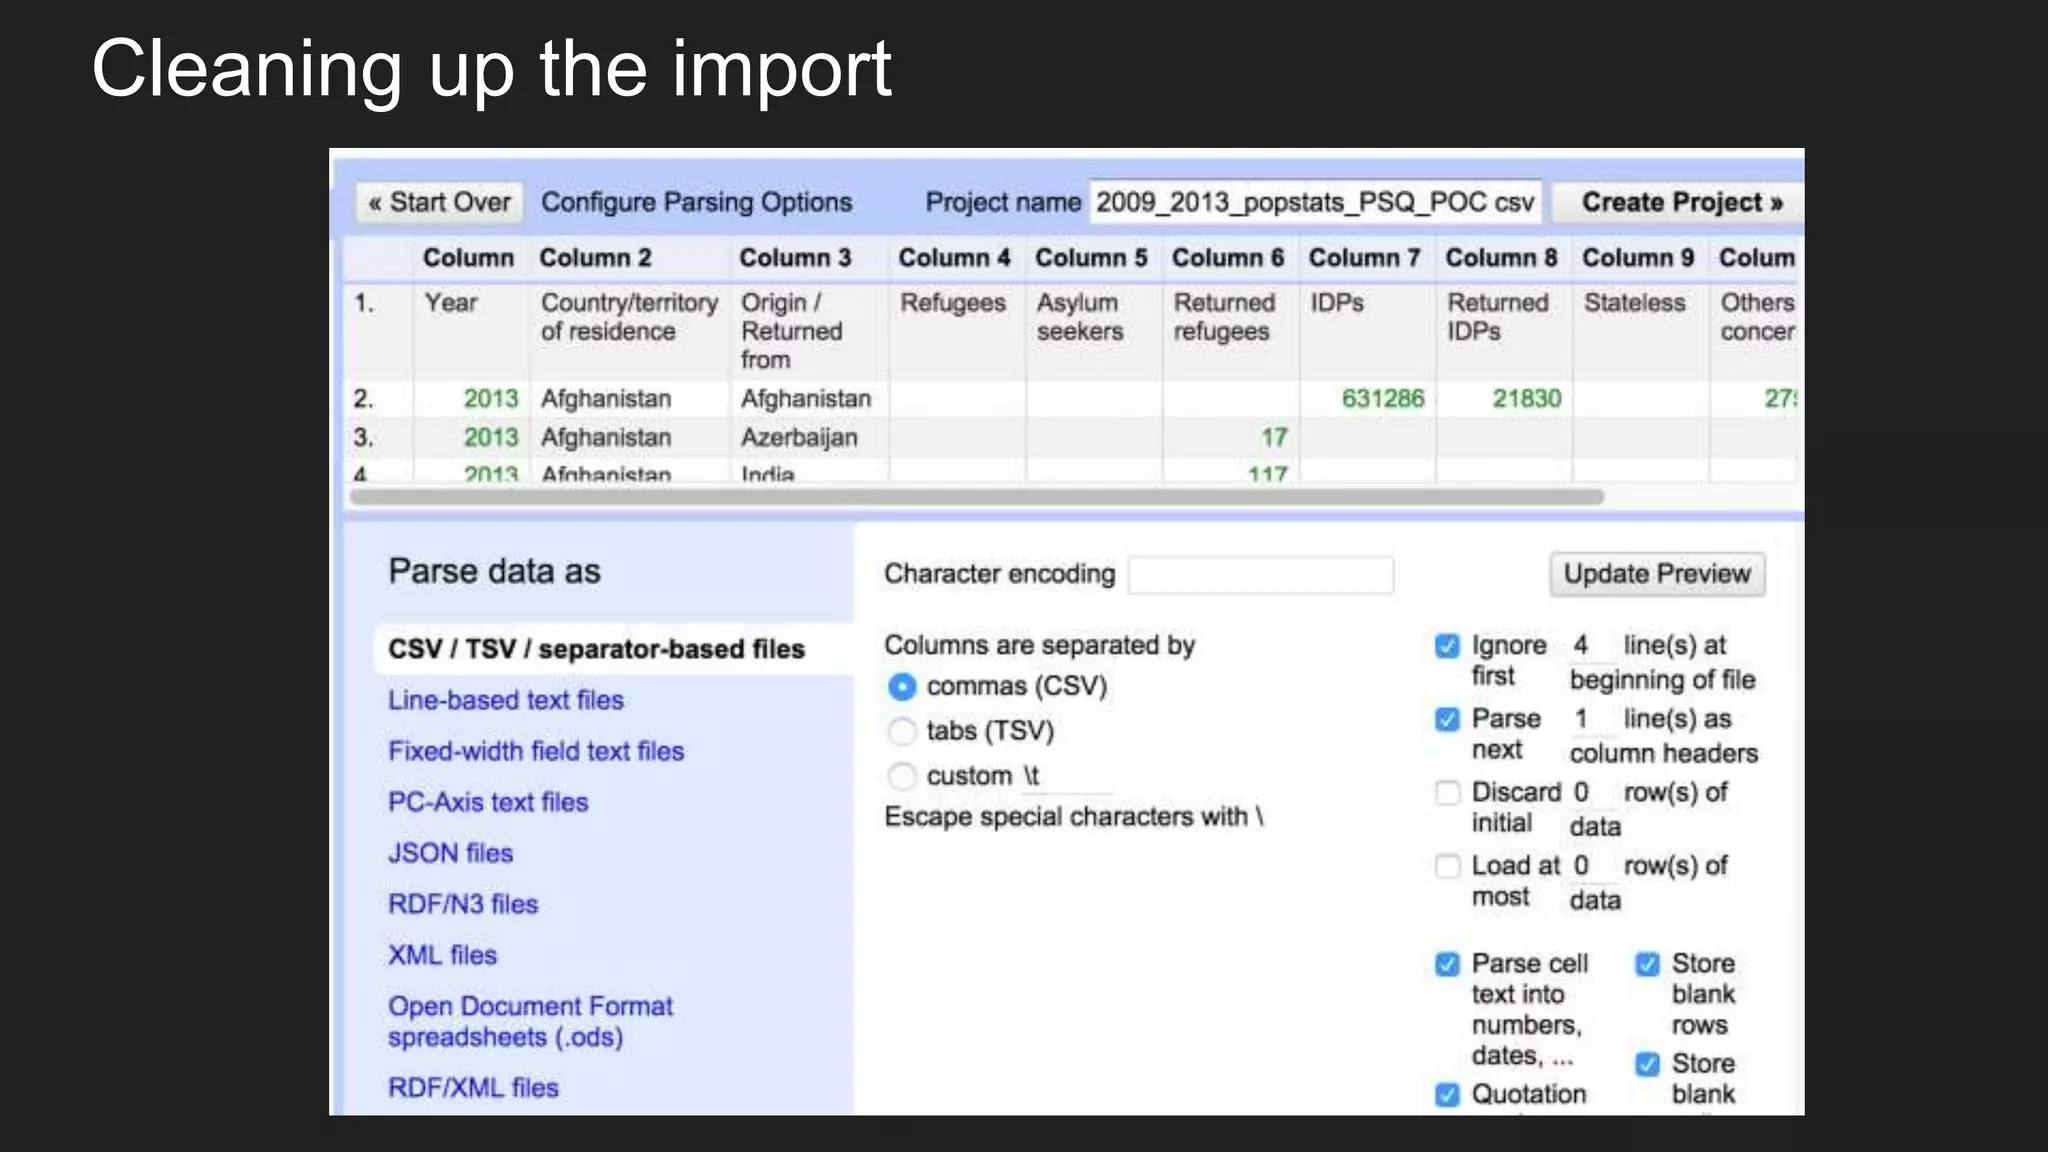
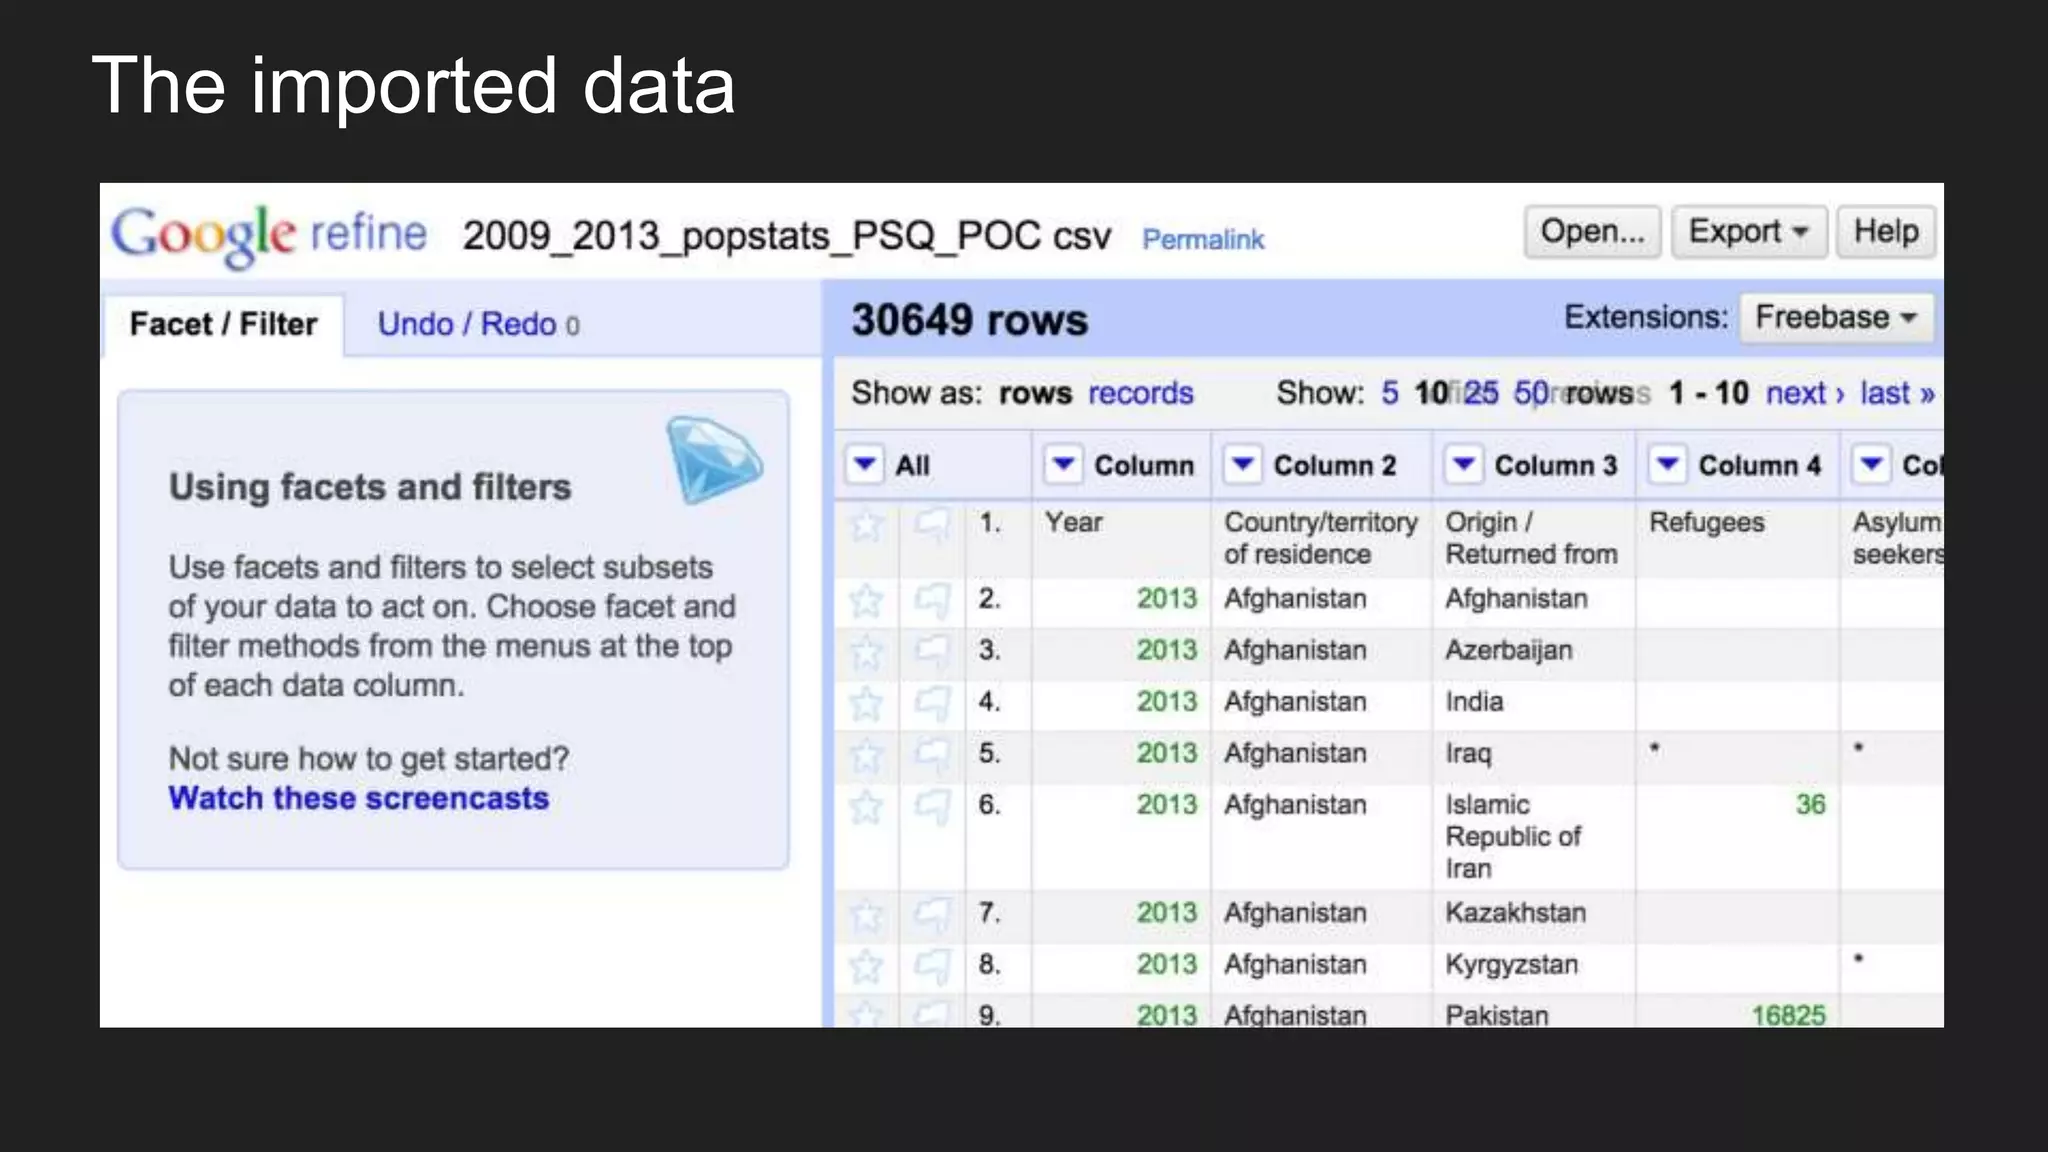
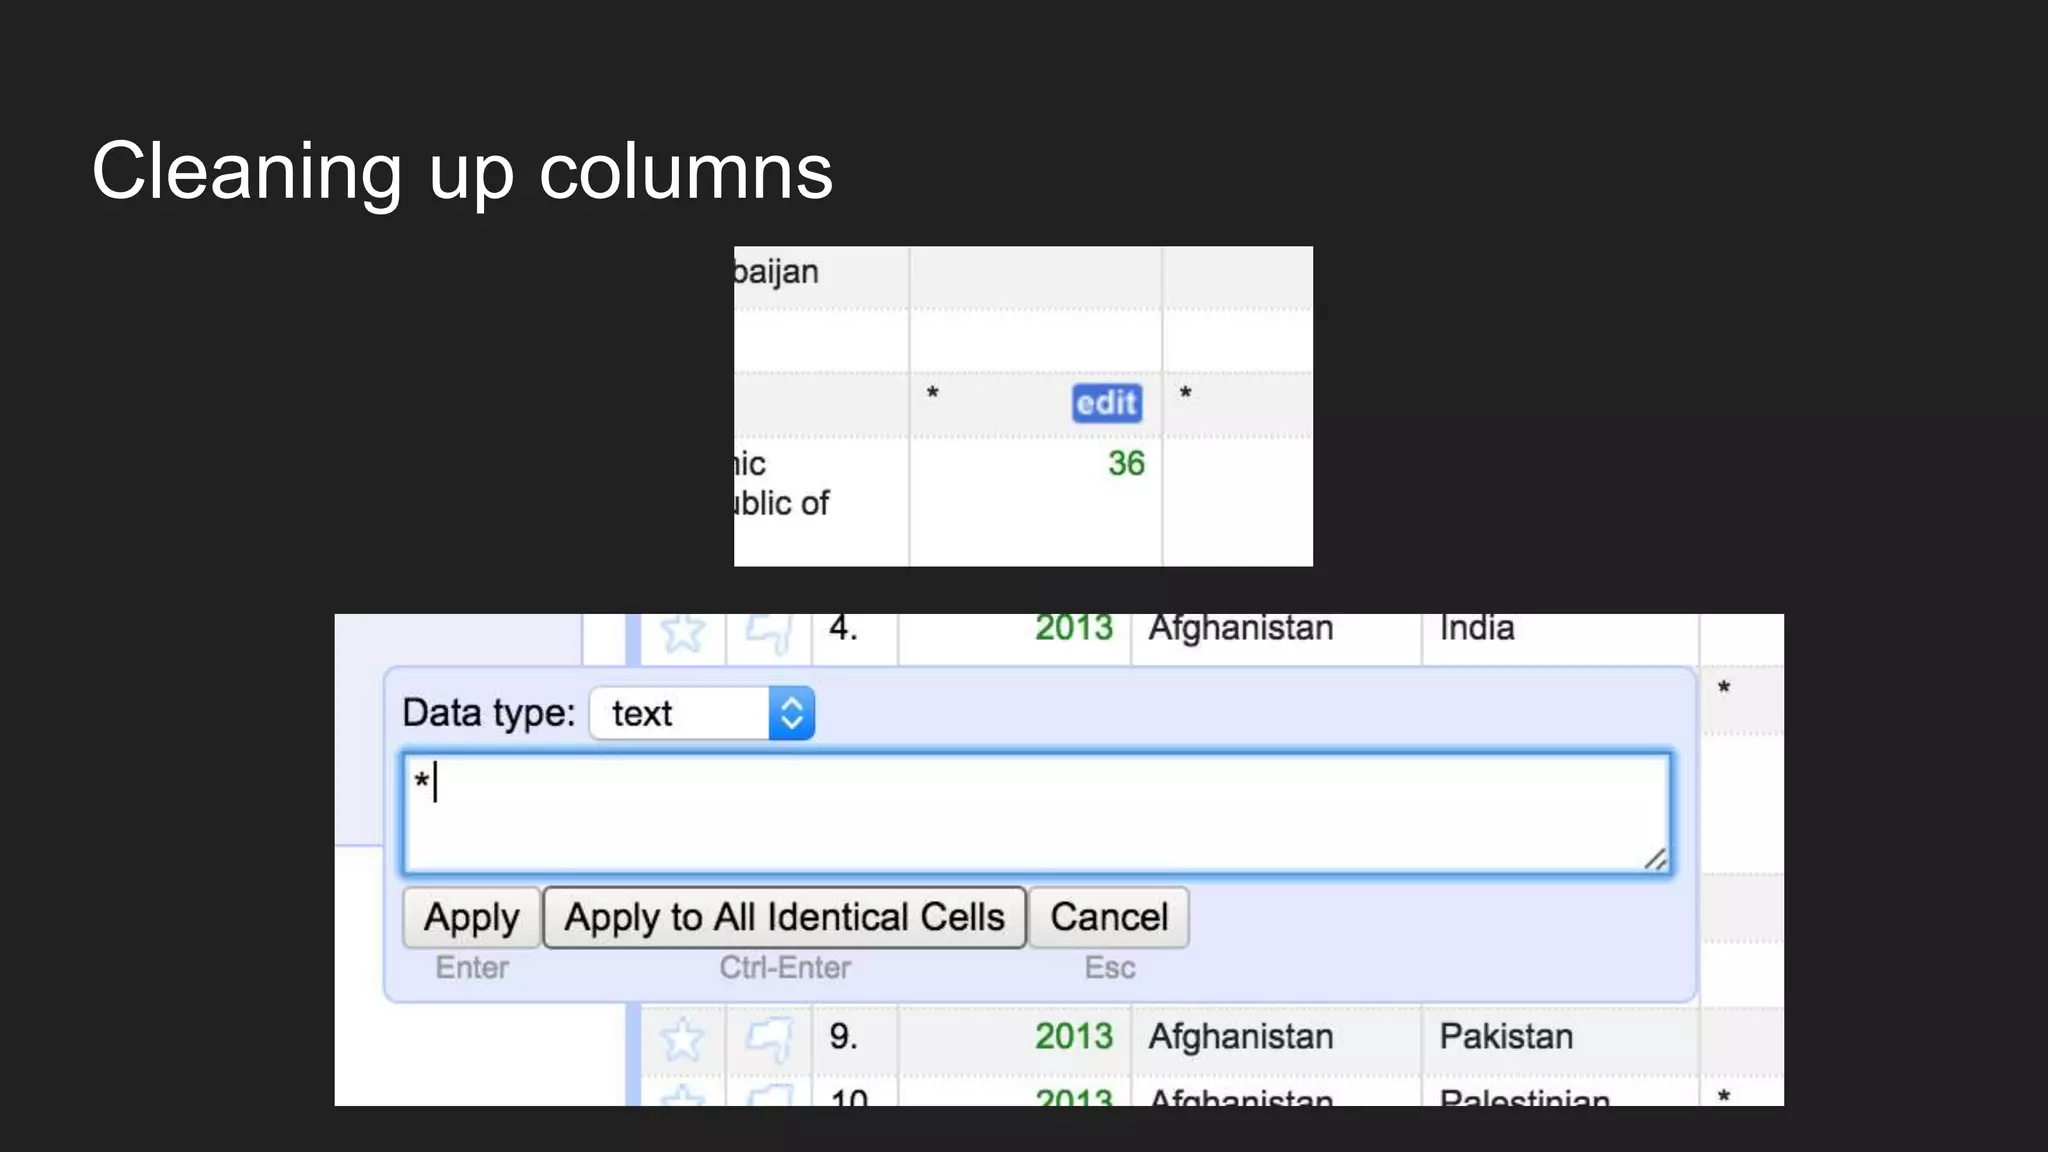
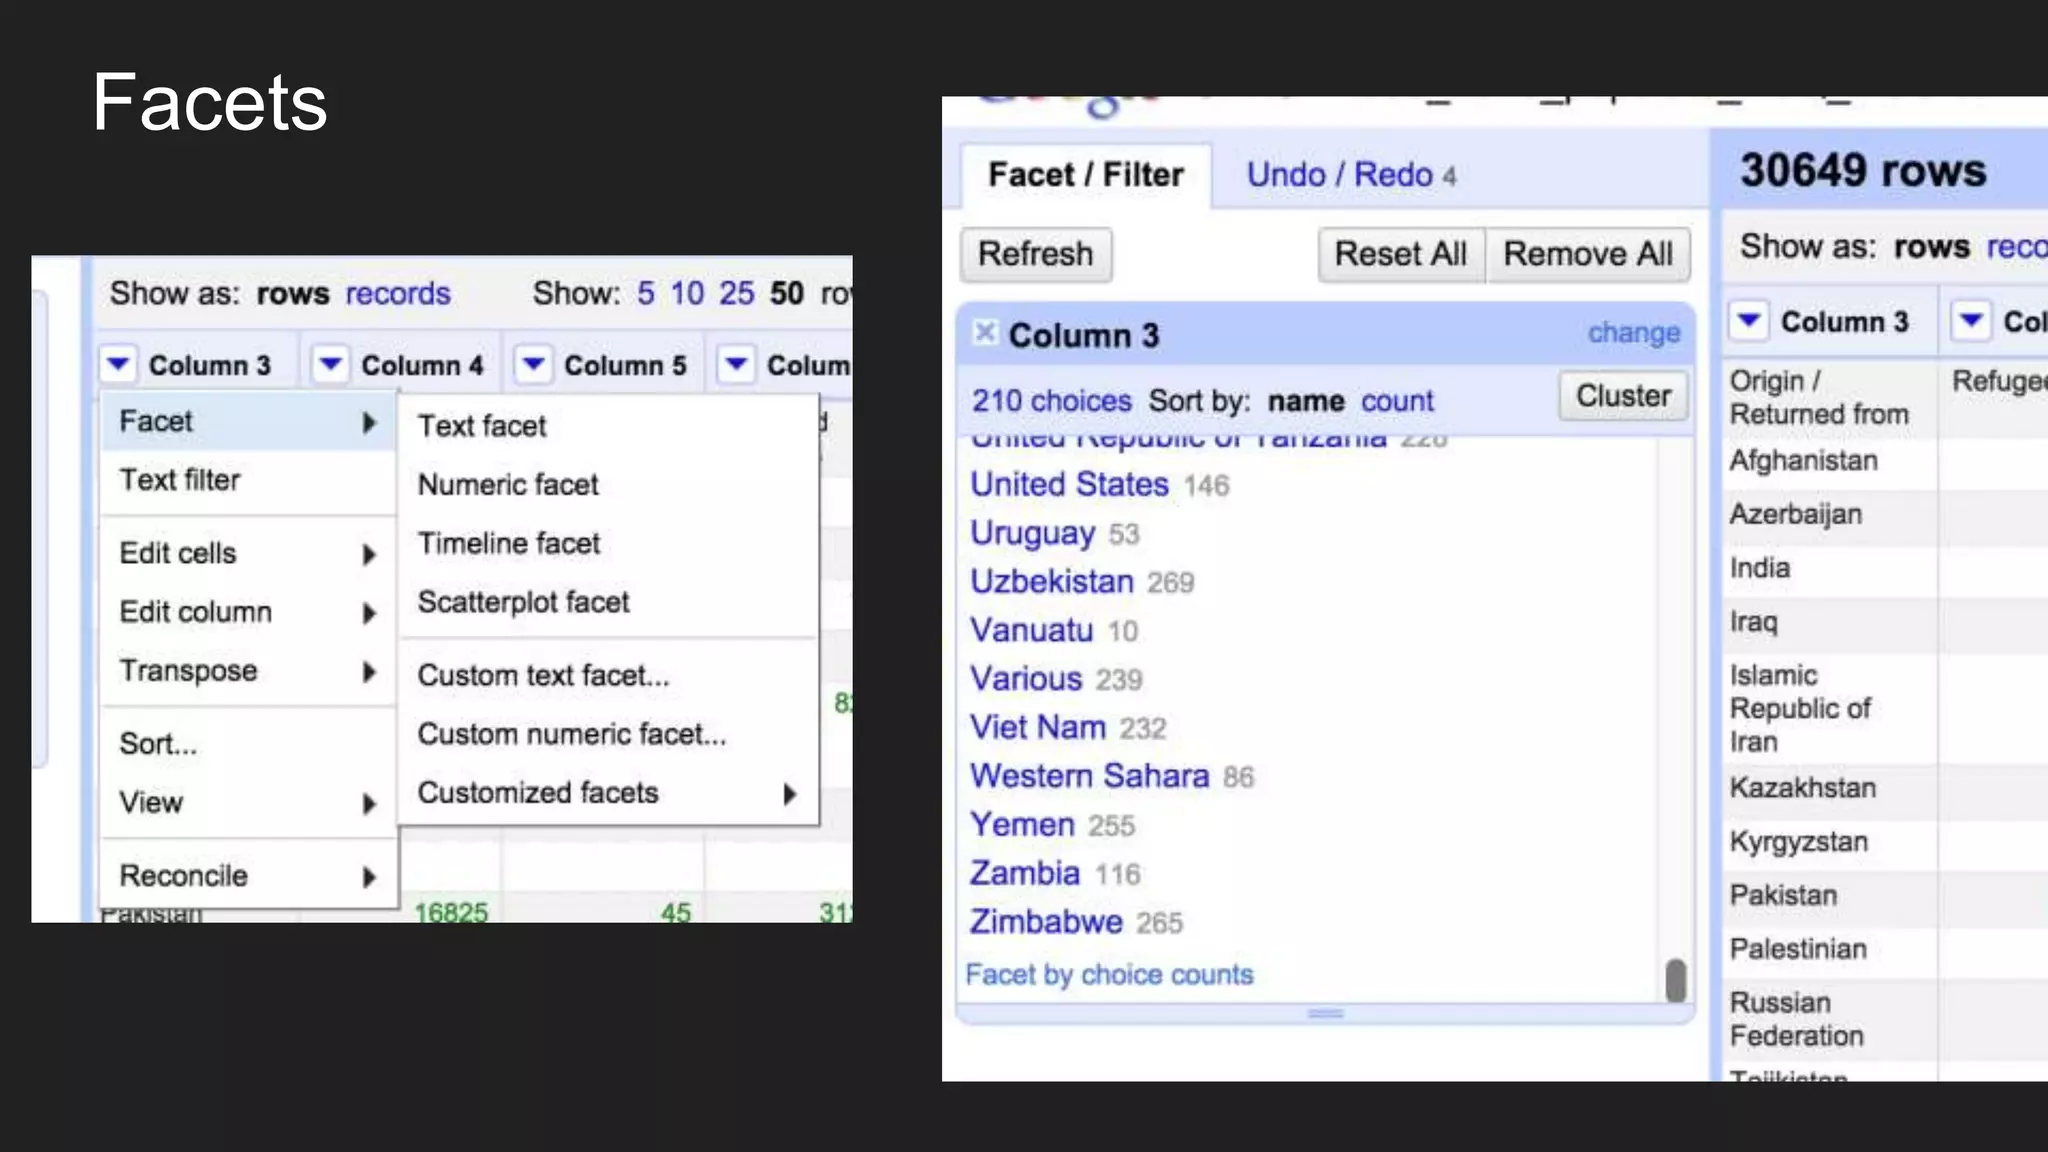
This document provides a comprehensive overview of data cleaning and exploration techniques using Python, OpenRefine, and R. It covers methods for ensuring data consistency, formatting, and handling outliers, as well as tools like pandas and seaborn for data analysis and visualization. Practical coding examples are included to demonstrate the implementation of these techniques.


![[DSC Europe 25] Marko Krstic - Understanding the AI Threat Landscape - Risks,...](https://cdn.slidesharecdn.com/ss_thumbnails/tiyim1ins5jvbrvzpzla-2-251209104645-c69d3553-thumbnail.jpg?width=640&height=640&fit=bounds)
![[DSC Europe 25] Miodrag Pesovic & Vladislav Radonjic - Federated Data Archite...](https://cdn.slidesharecdn.com/ss_thumbnails/gsbe3y5it5uhndi4e08e-1-251212103249-f1008e0c-thumbnail.jpg?width=640&height=640&fit=bounds)

![[DSC Europe 25] Behzad Hosseini - AI Agents in the Wild: Deploying Models tha...](https://cdn.slidesharecdn.com/ss_thumbnails/3qtejajvsjqrzwfept2c-10-251212103250-7f2b1068-thumbnail.jpg?width=640&height=640&fit=bounds)

![[DSC Europe 25] Jovan Bogicevic - Legacy to AI-Driven Defense: Transforming D...](https://cdn.slidesharecdn.com/ss_thumbnails/rsarluadt563hntyfc8q-3-251211083849-3e7bc4c0-thumbnail.jpg?width=640&height=640&fit=bounds)
![[DSC Europe 25] Nikolay Burlutskiy - Best Practices for Building Enterprise M...](https://cdn.slidesharecdn.com/ss_thumbnails/uirvaiuvq8y1w8hzd9tx-7-251212103249-2619edb4-thumbnail.jpg?width=640&height=640&fit=bounds)
![[DSC Europe 25] Debmalya Biswas - Agentification: the art of transforming man...](https://cdn.slidesharecdn.com/ss_thumbnails/r5azlggvtqiaiiusrqdr-4-251212103249-5a12c89b-thumbnail.jpg?width=640&height=640&fit=bounds)
![[DSC Europe 25] Bassam Maharmeh - Artificial Intelligence: Opportunities and ...](https://cdn.slidesharecdn.com/ss_thumbnails/thhfmr2fqpawzj7hsjpg-5-251211083048-2c23204f-thumbnail.jpg?width=640&height=640&fit=bounds)
![[DSC Europe 25] Dusan Nesic - Securing Tomorrow’s Infrastructure: Why Cyber-P...](https://cdn.slidesharecdn.com/ss_thumbnails/qikbszfftyowjm2q6duw-1-251211083848-8f2ead6b-thumbnail.jpg?width=640&height=640&fit=bounds)

