Download to read offline


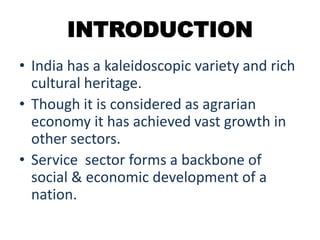
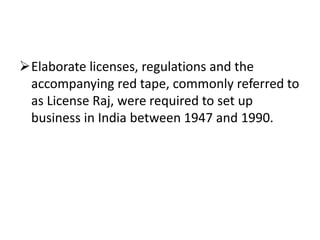
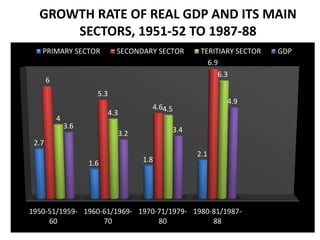
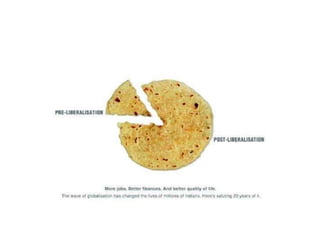
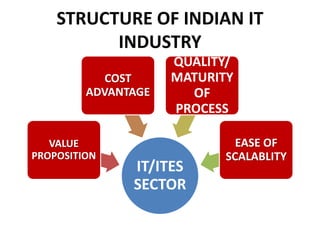
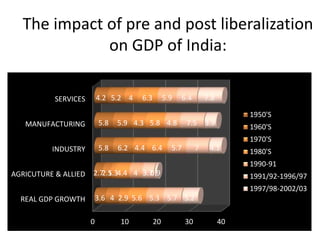
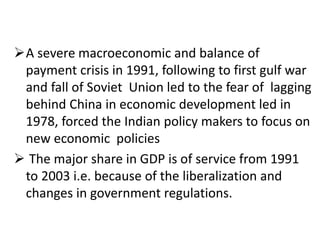

The document discusses the growth of India's service sector, with a focus on the IT/ITES sector. It notes that the service sector now represents over half of India's GDP and is the fastest growing sector. The IT/ITES sector in particular has transformed India's image globally and is a major contributor to the economy. The document traces the history from pre-liberalization policies in the 1950s-1980s that focused on internal markets and public sector dominance to the economic reforms beginning in 1991 that opened the economy and boosted growth. The IT/ITES sector benefited greatly from these reforms and liberalization, growing to become a star performer and global leader, though it faced challenges from the 2008 global economic crisis. Overall the sector remains