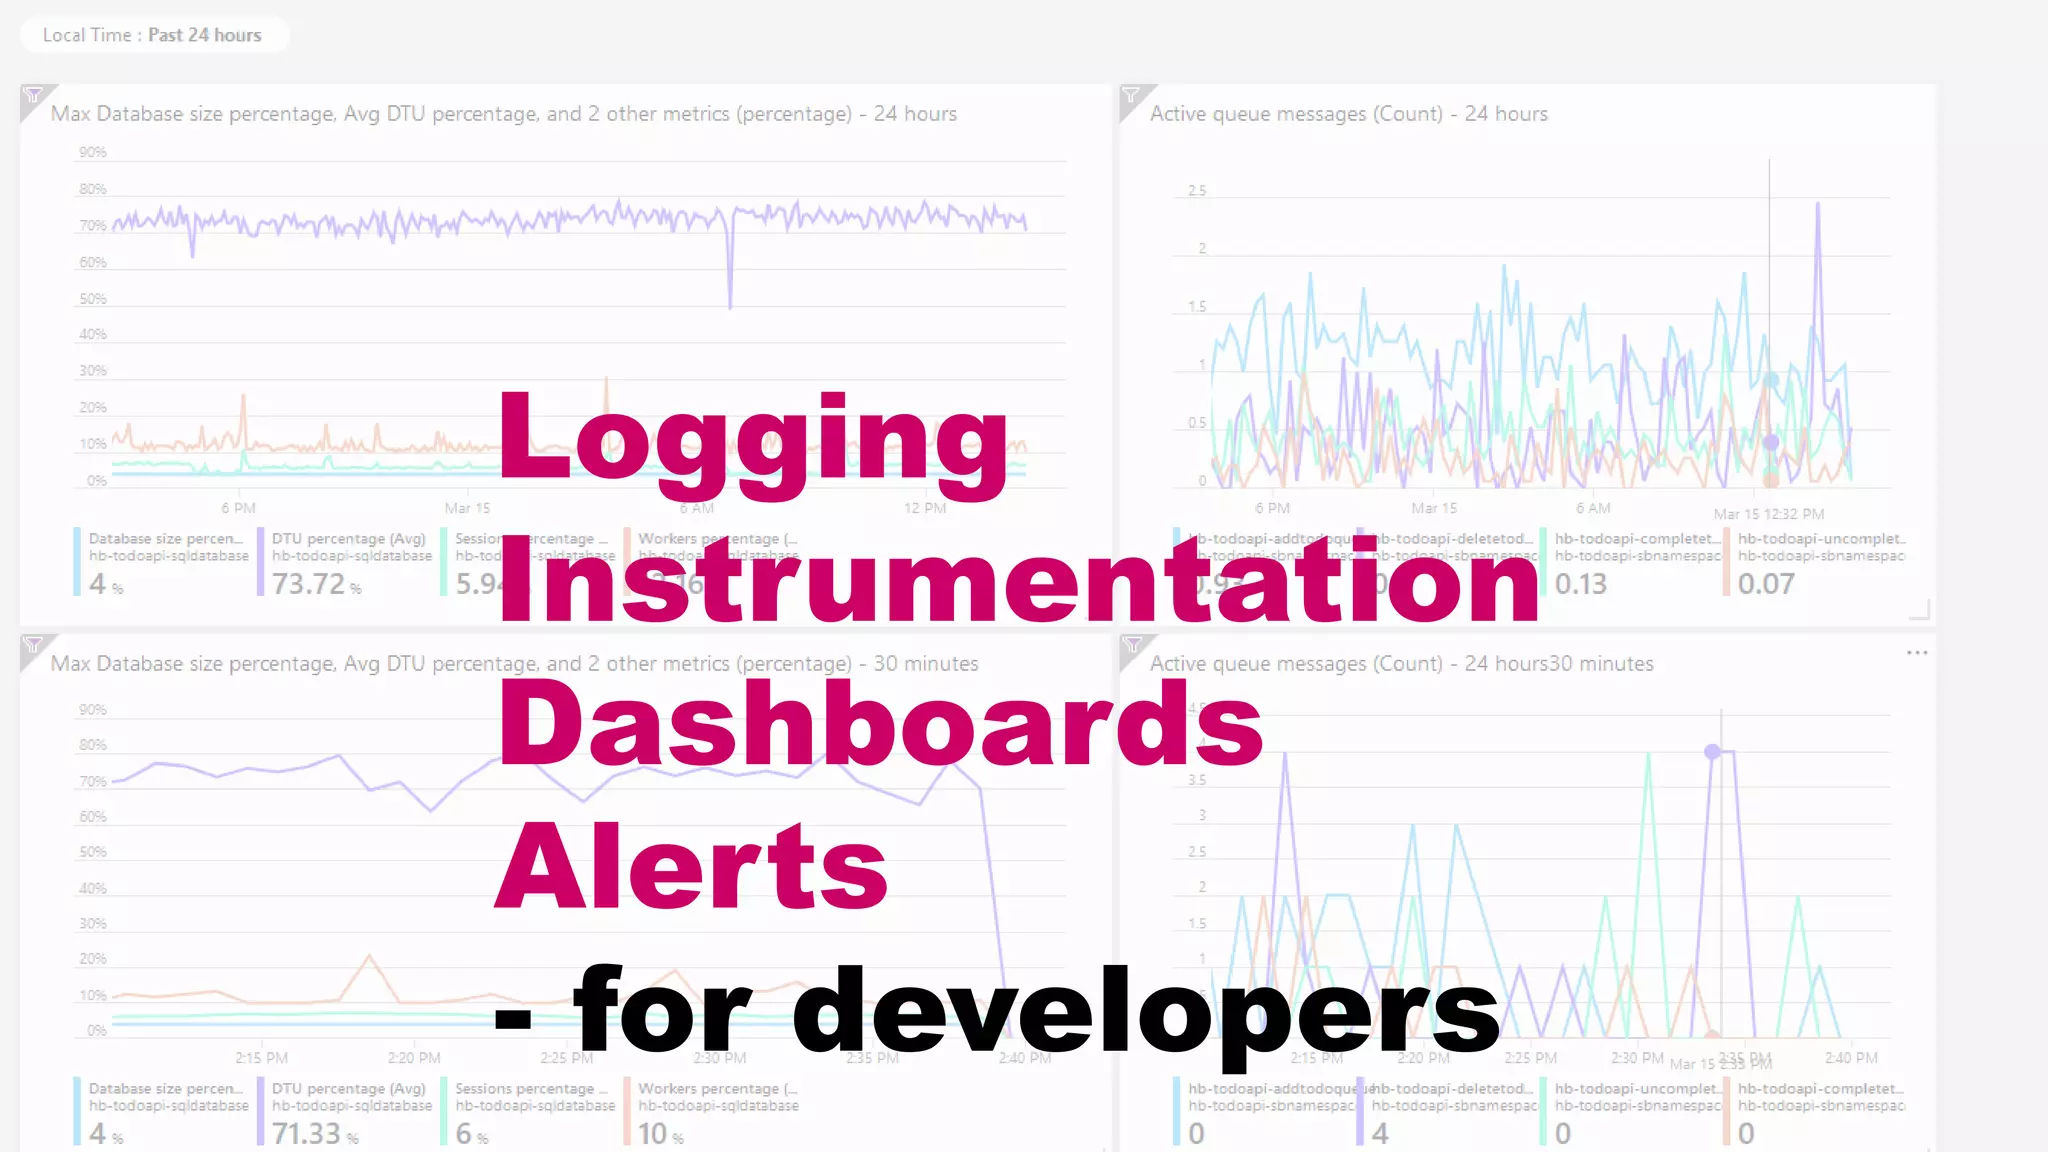
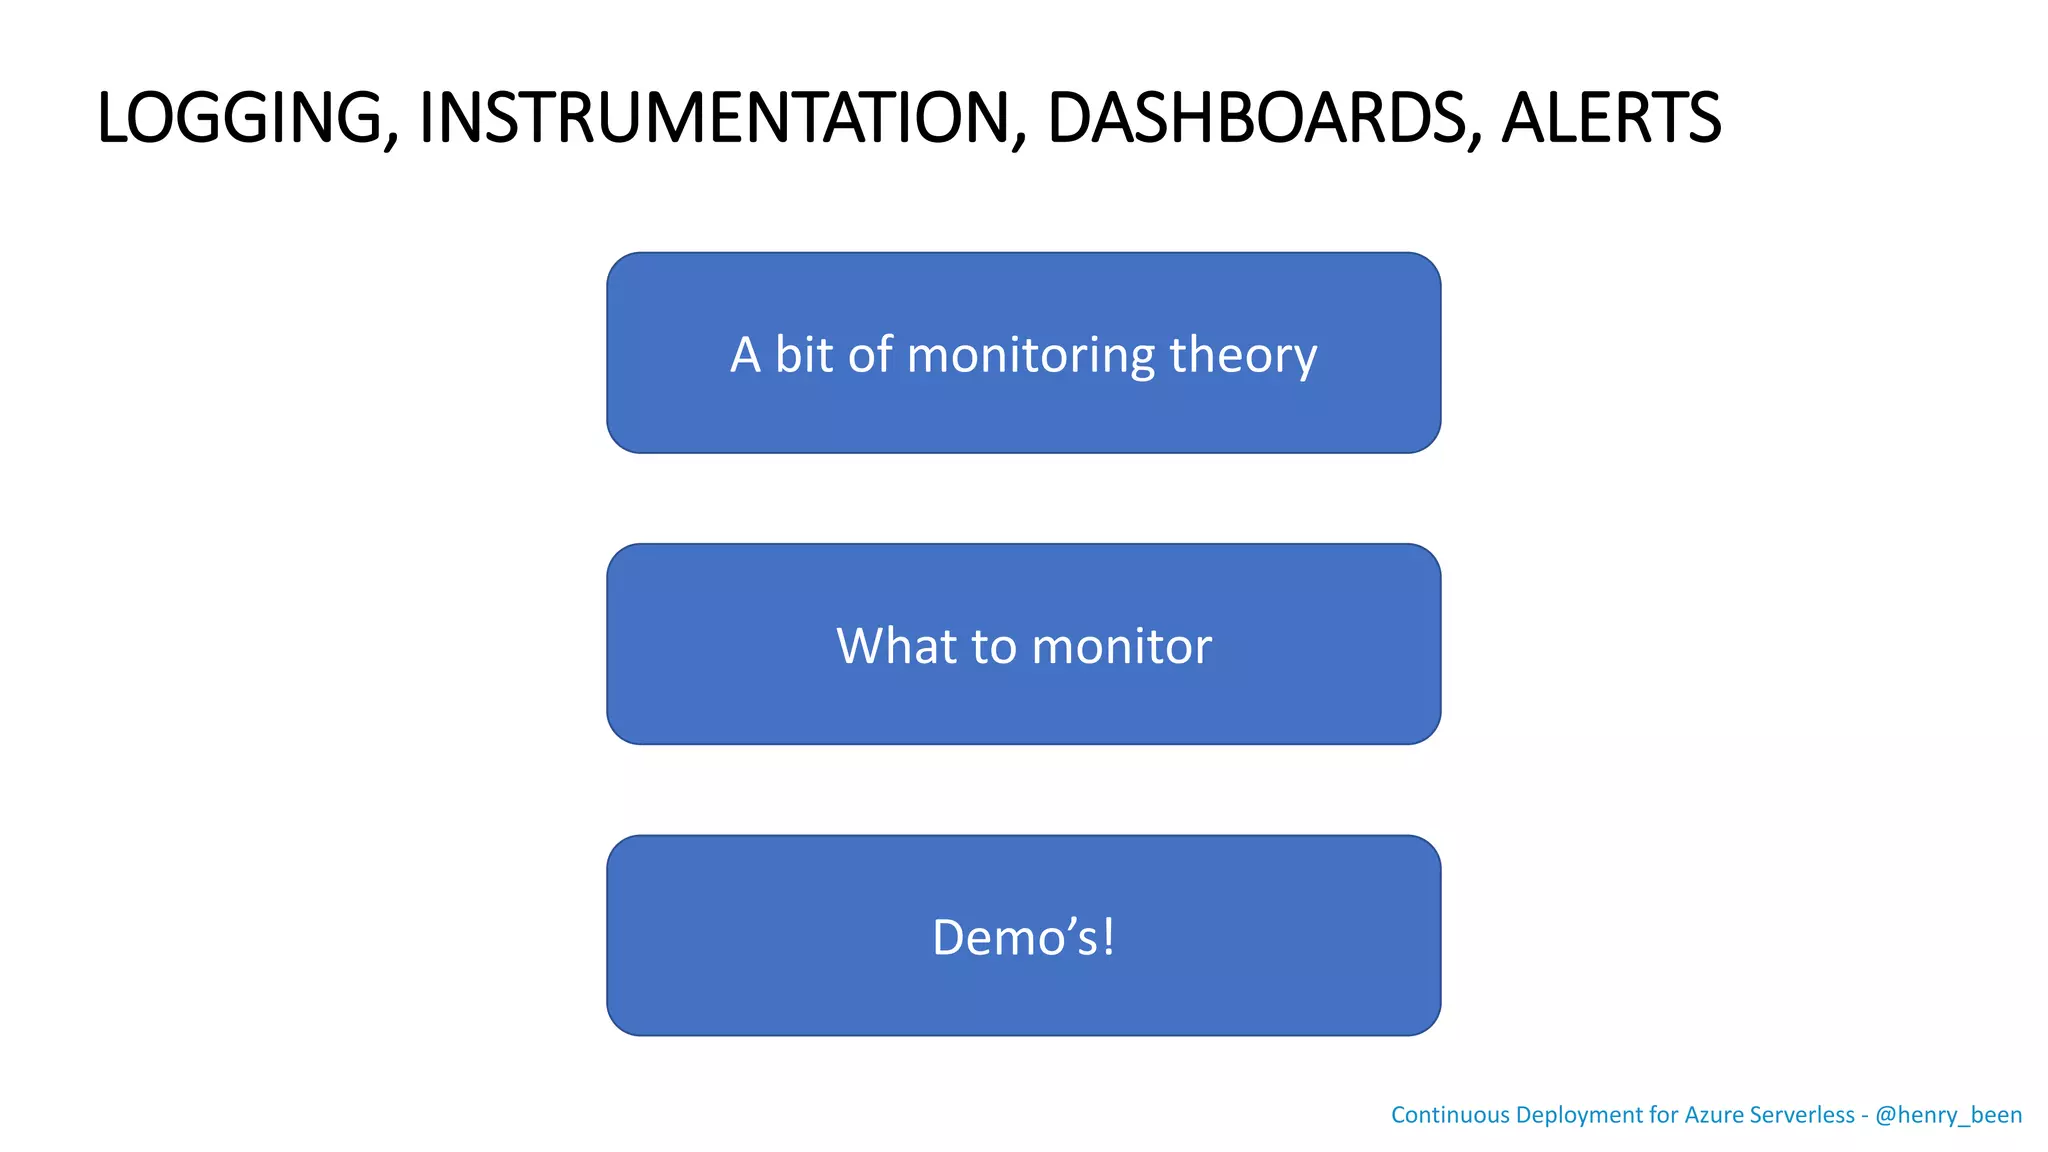
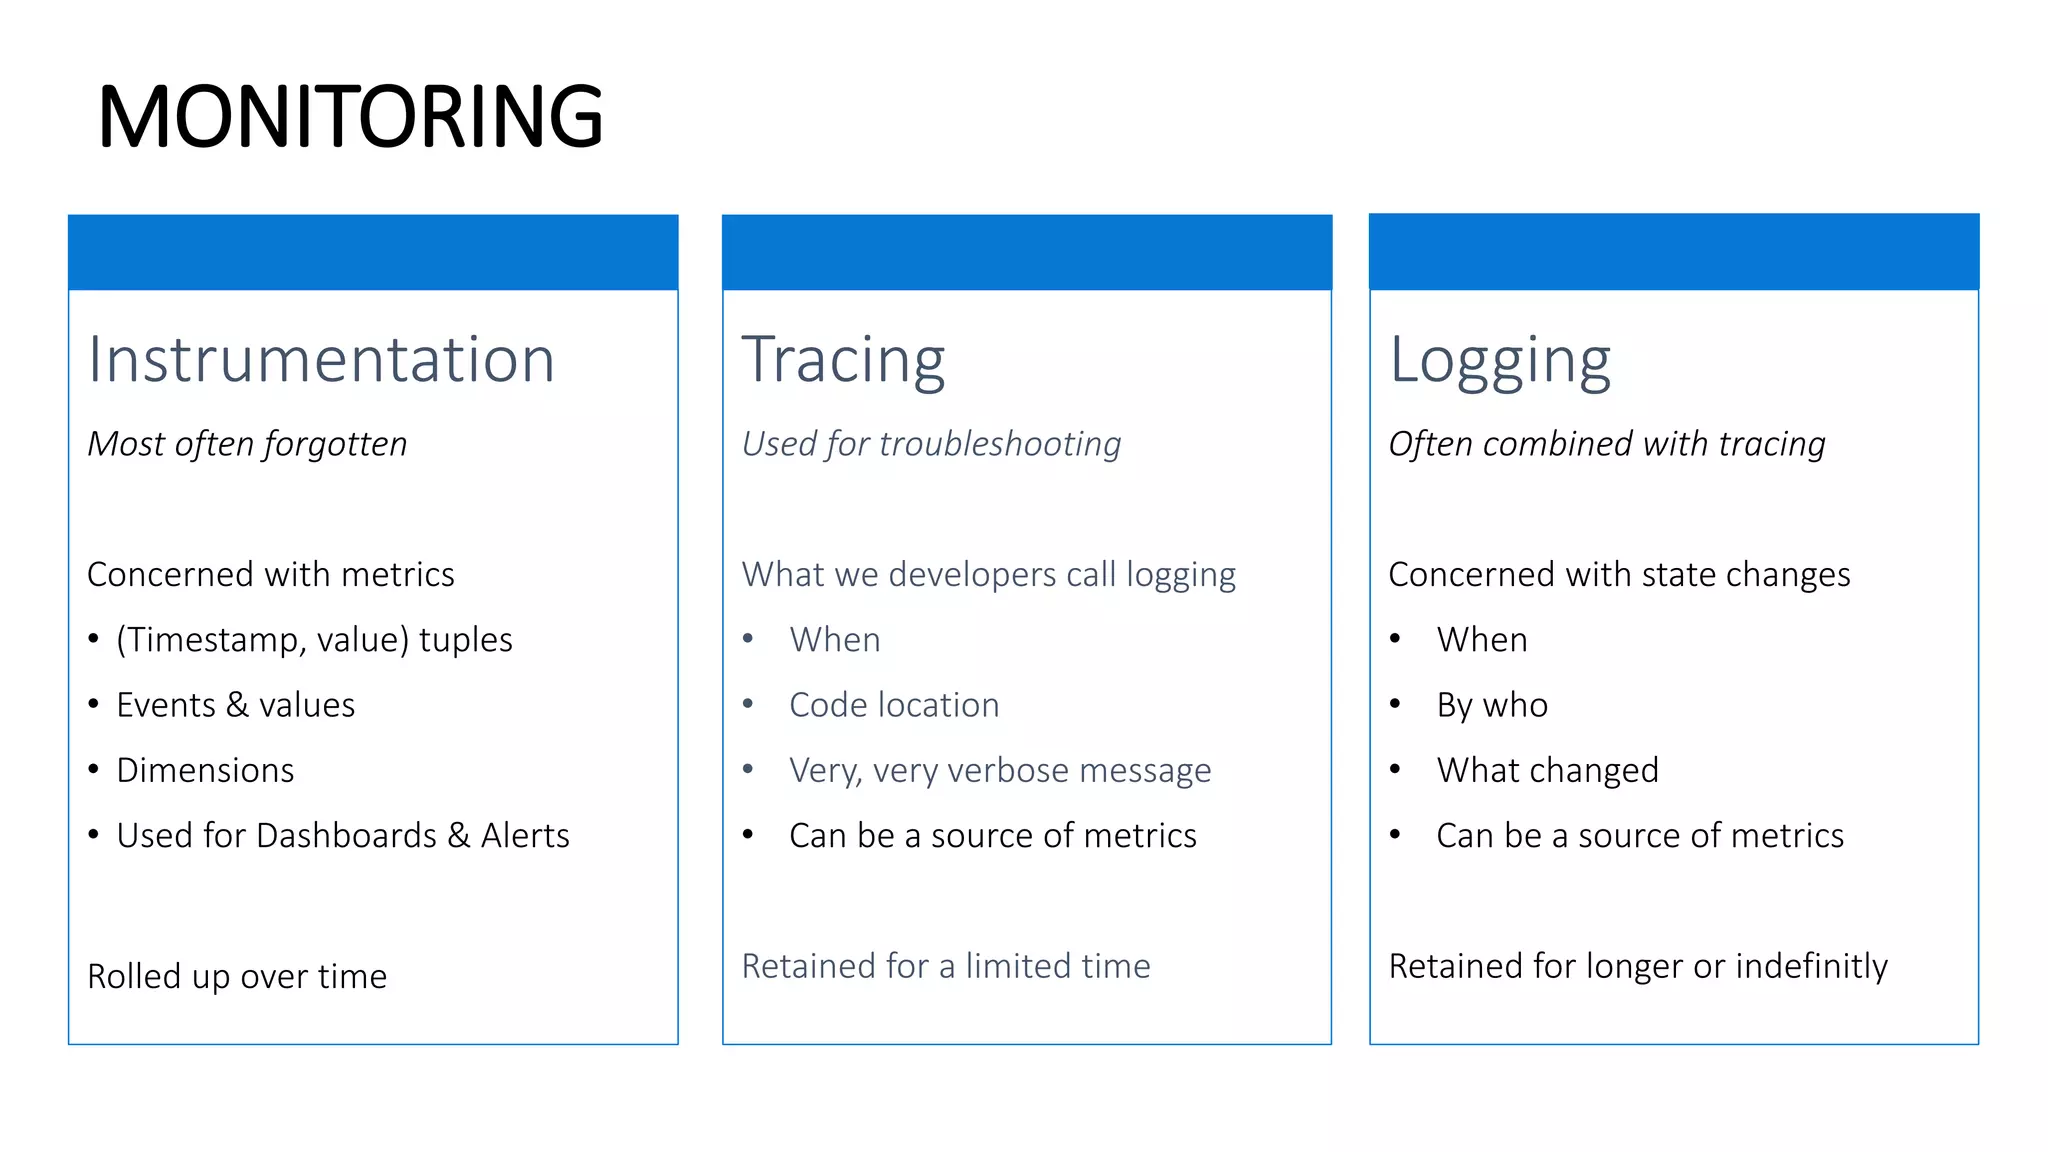
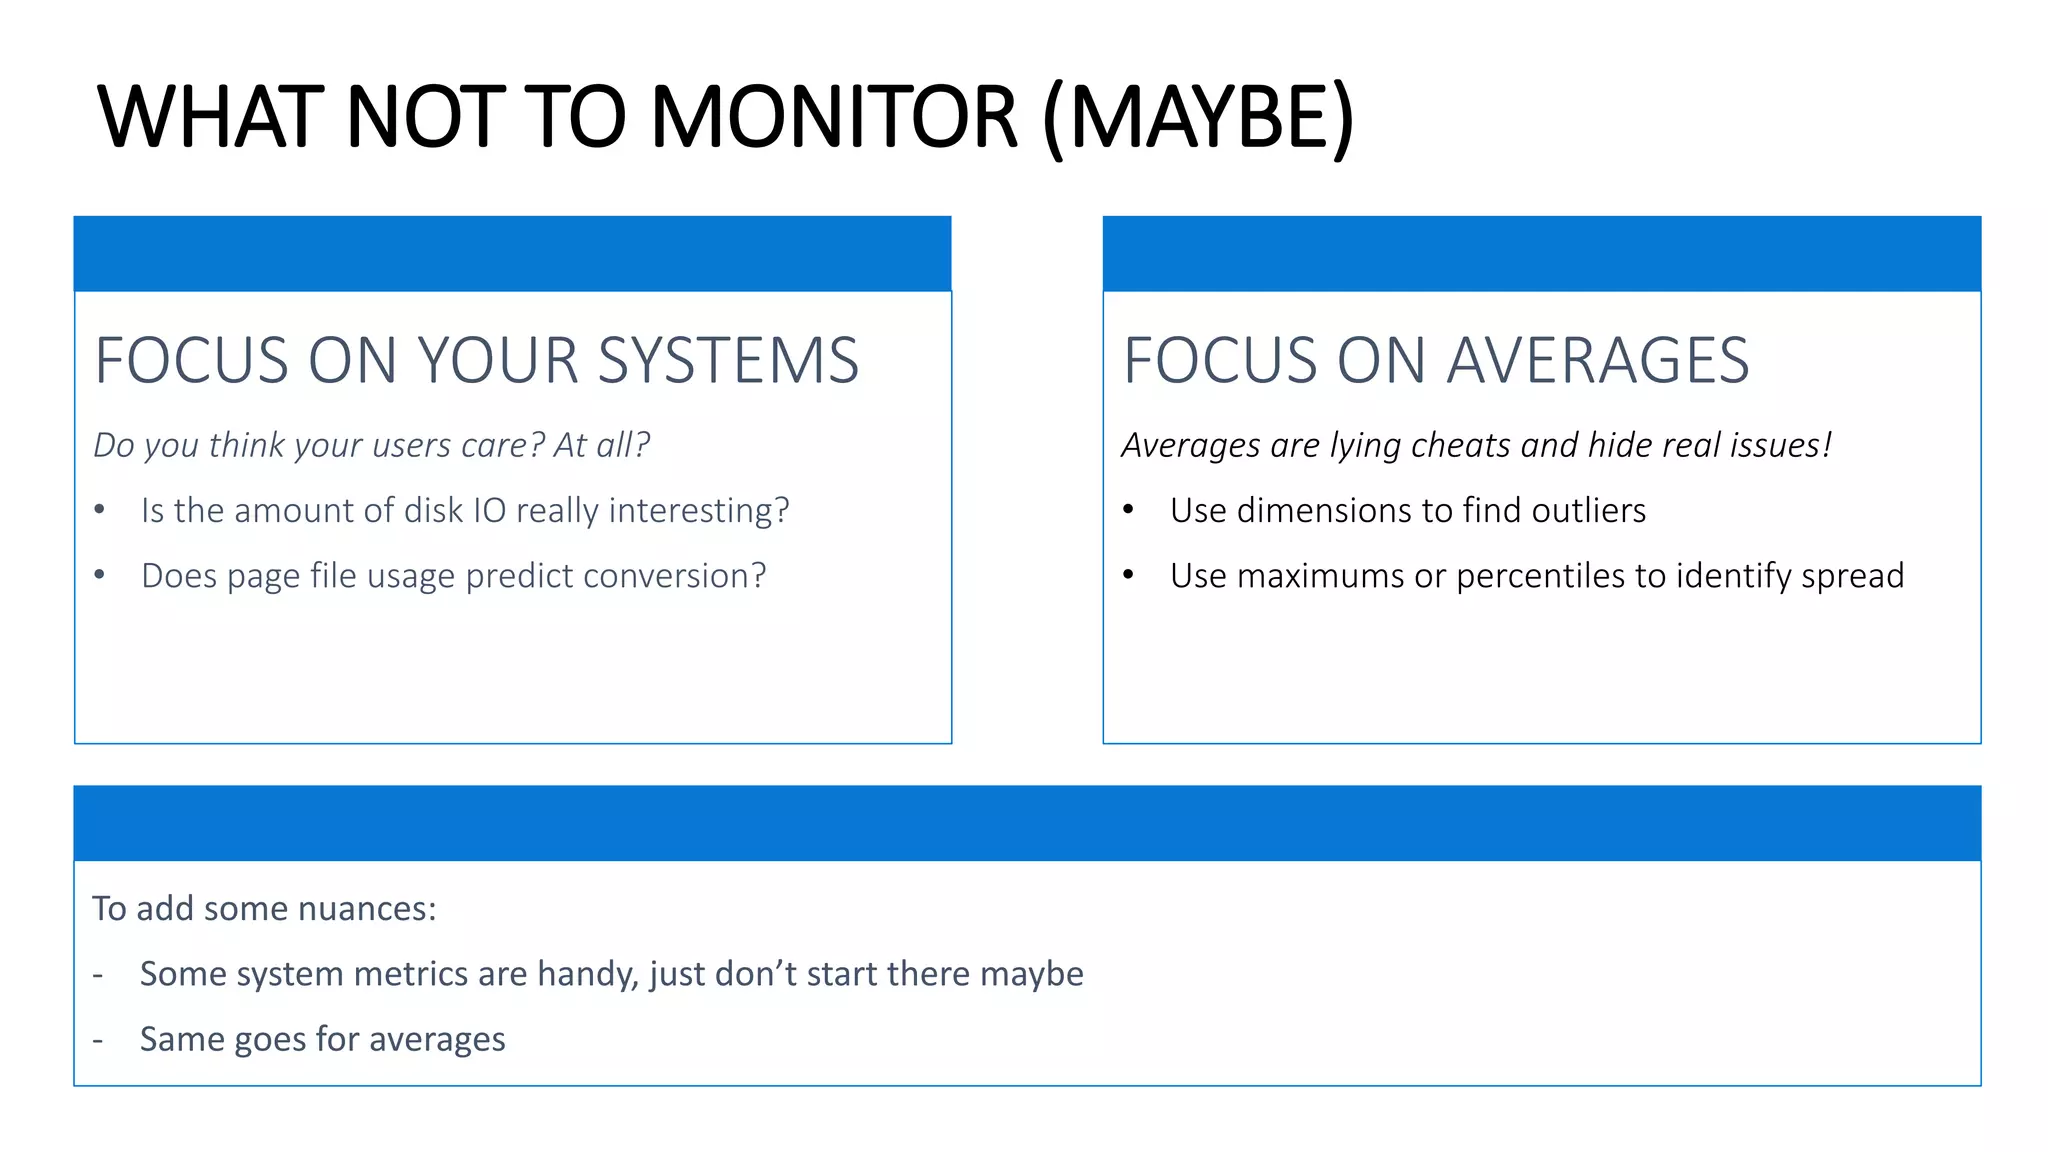
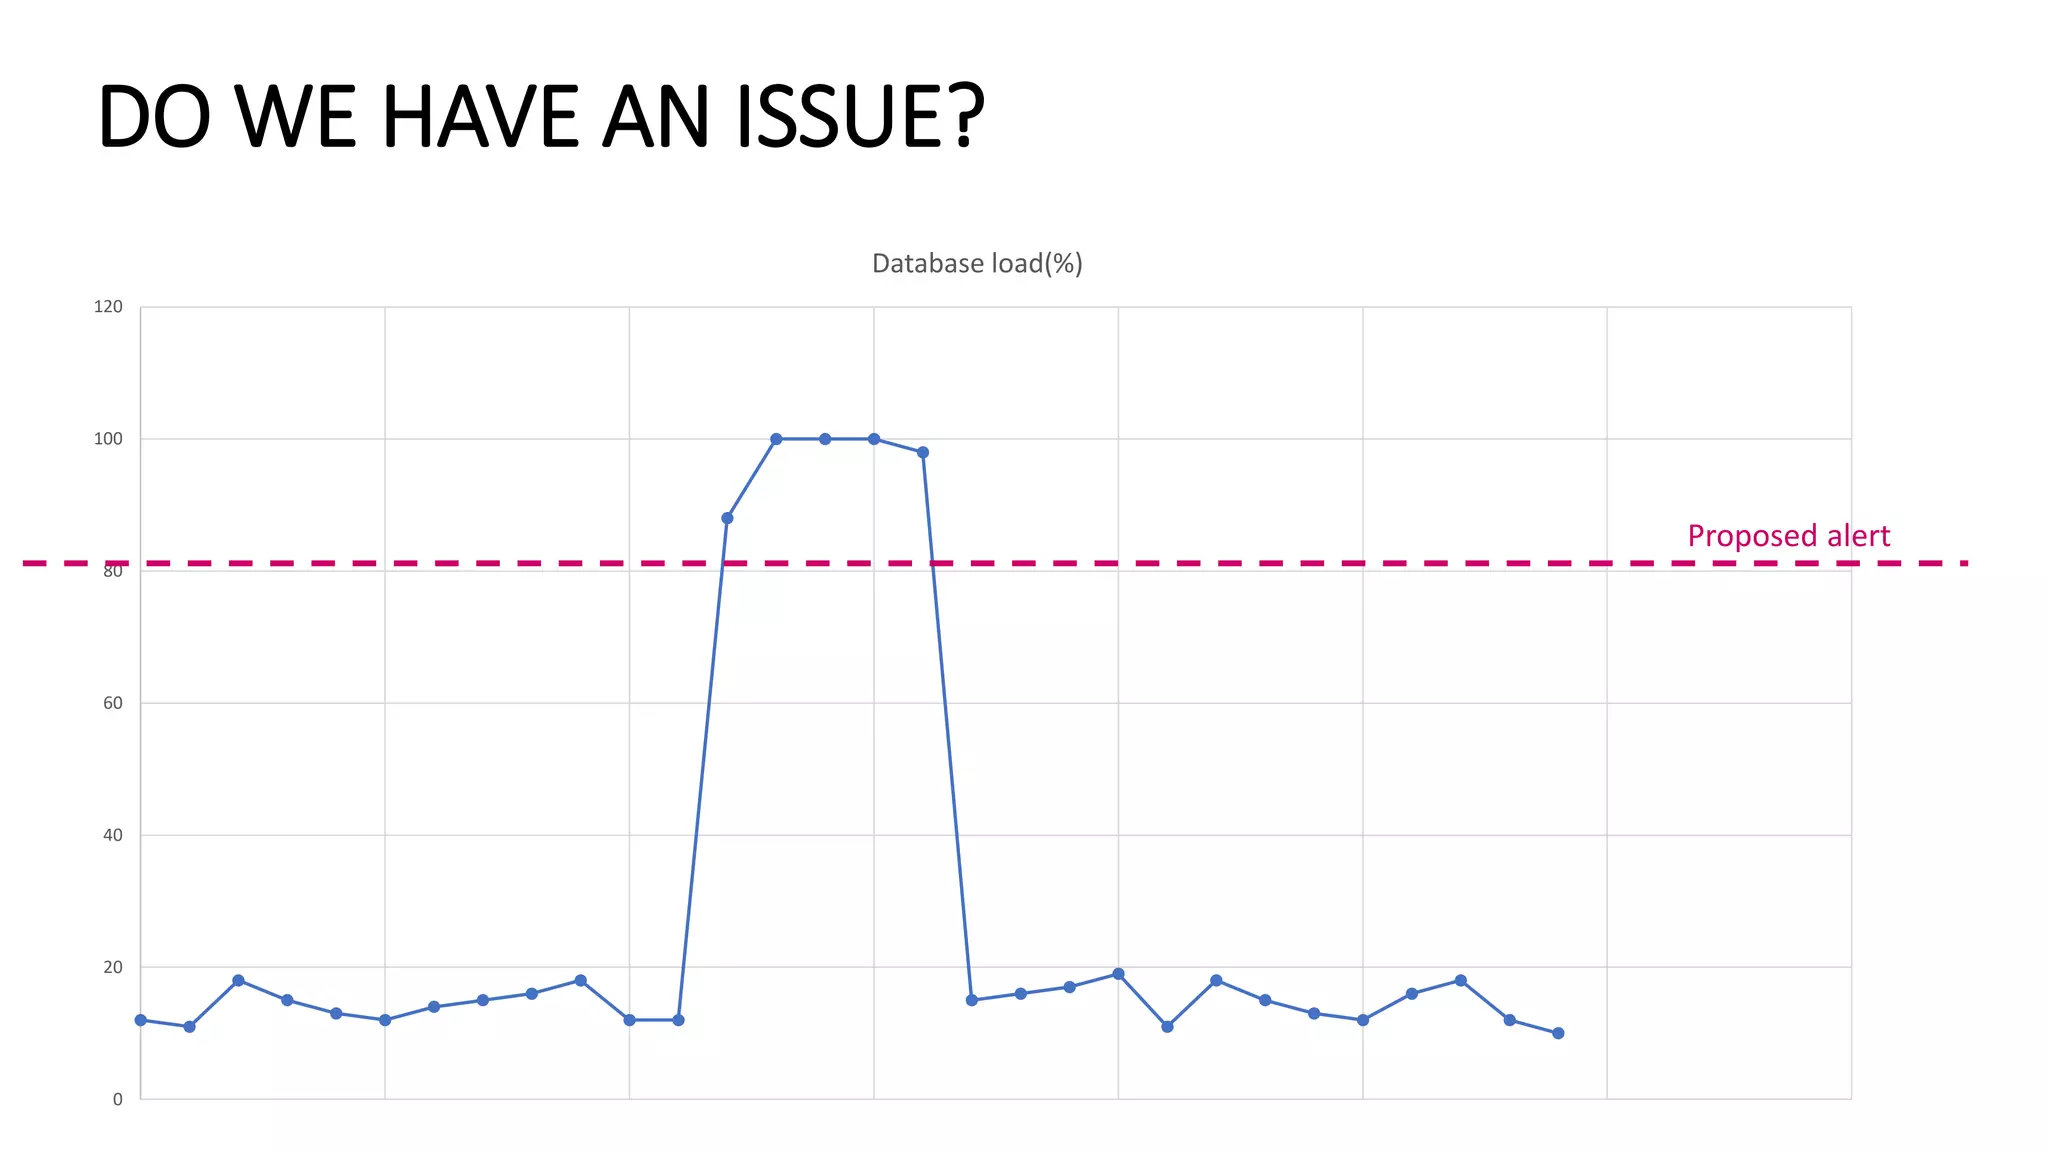
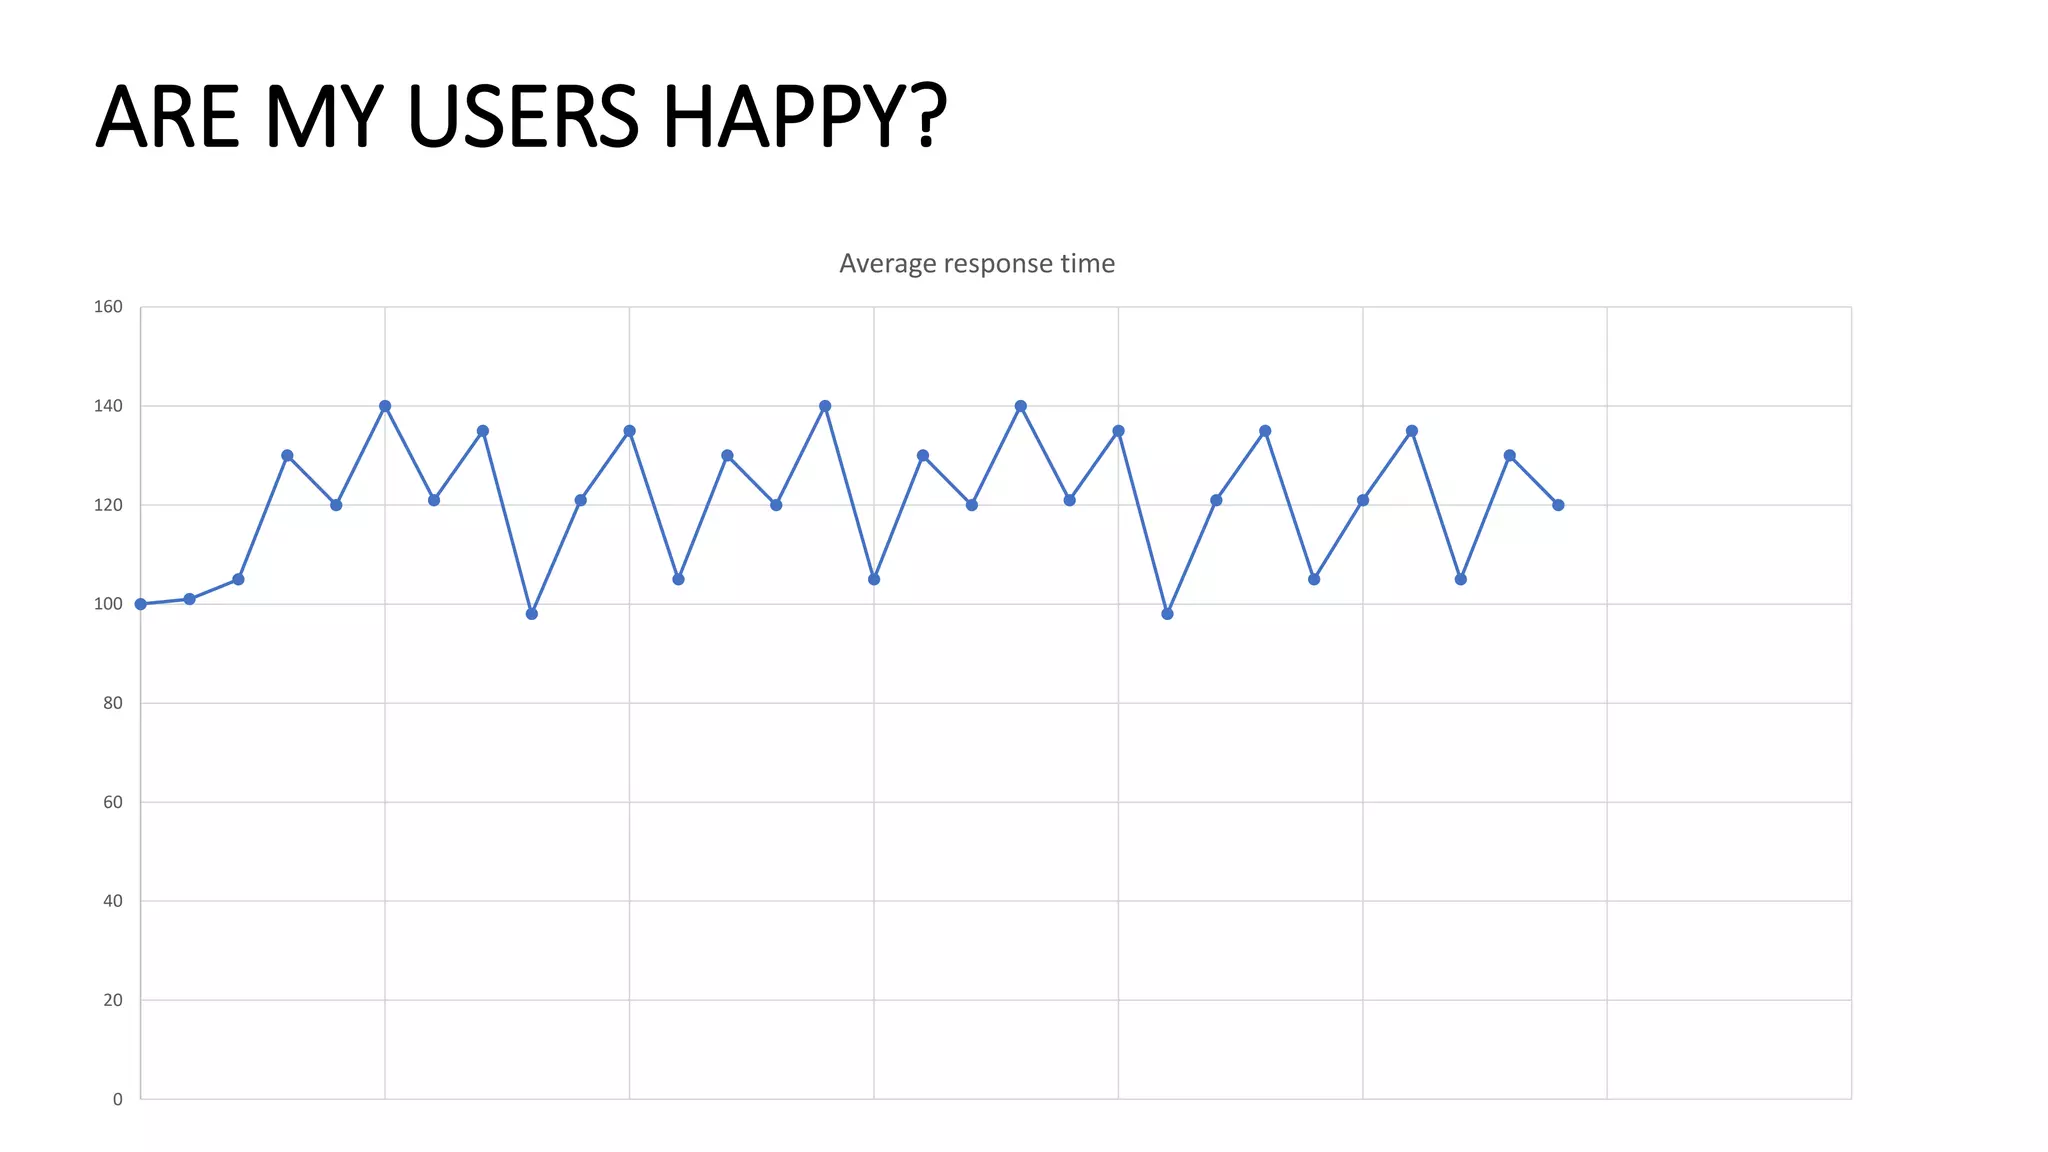
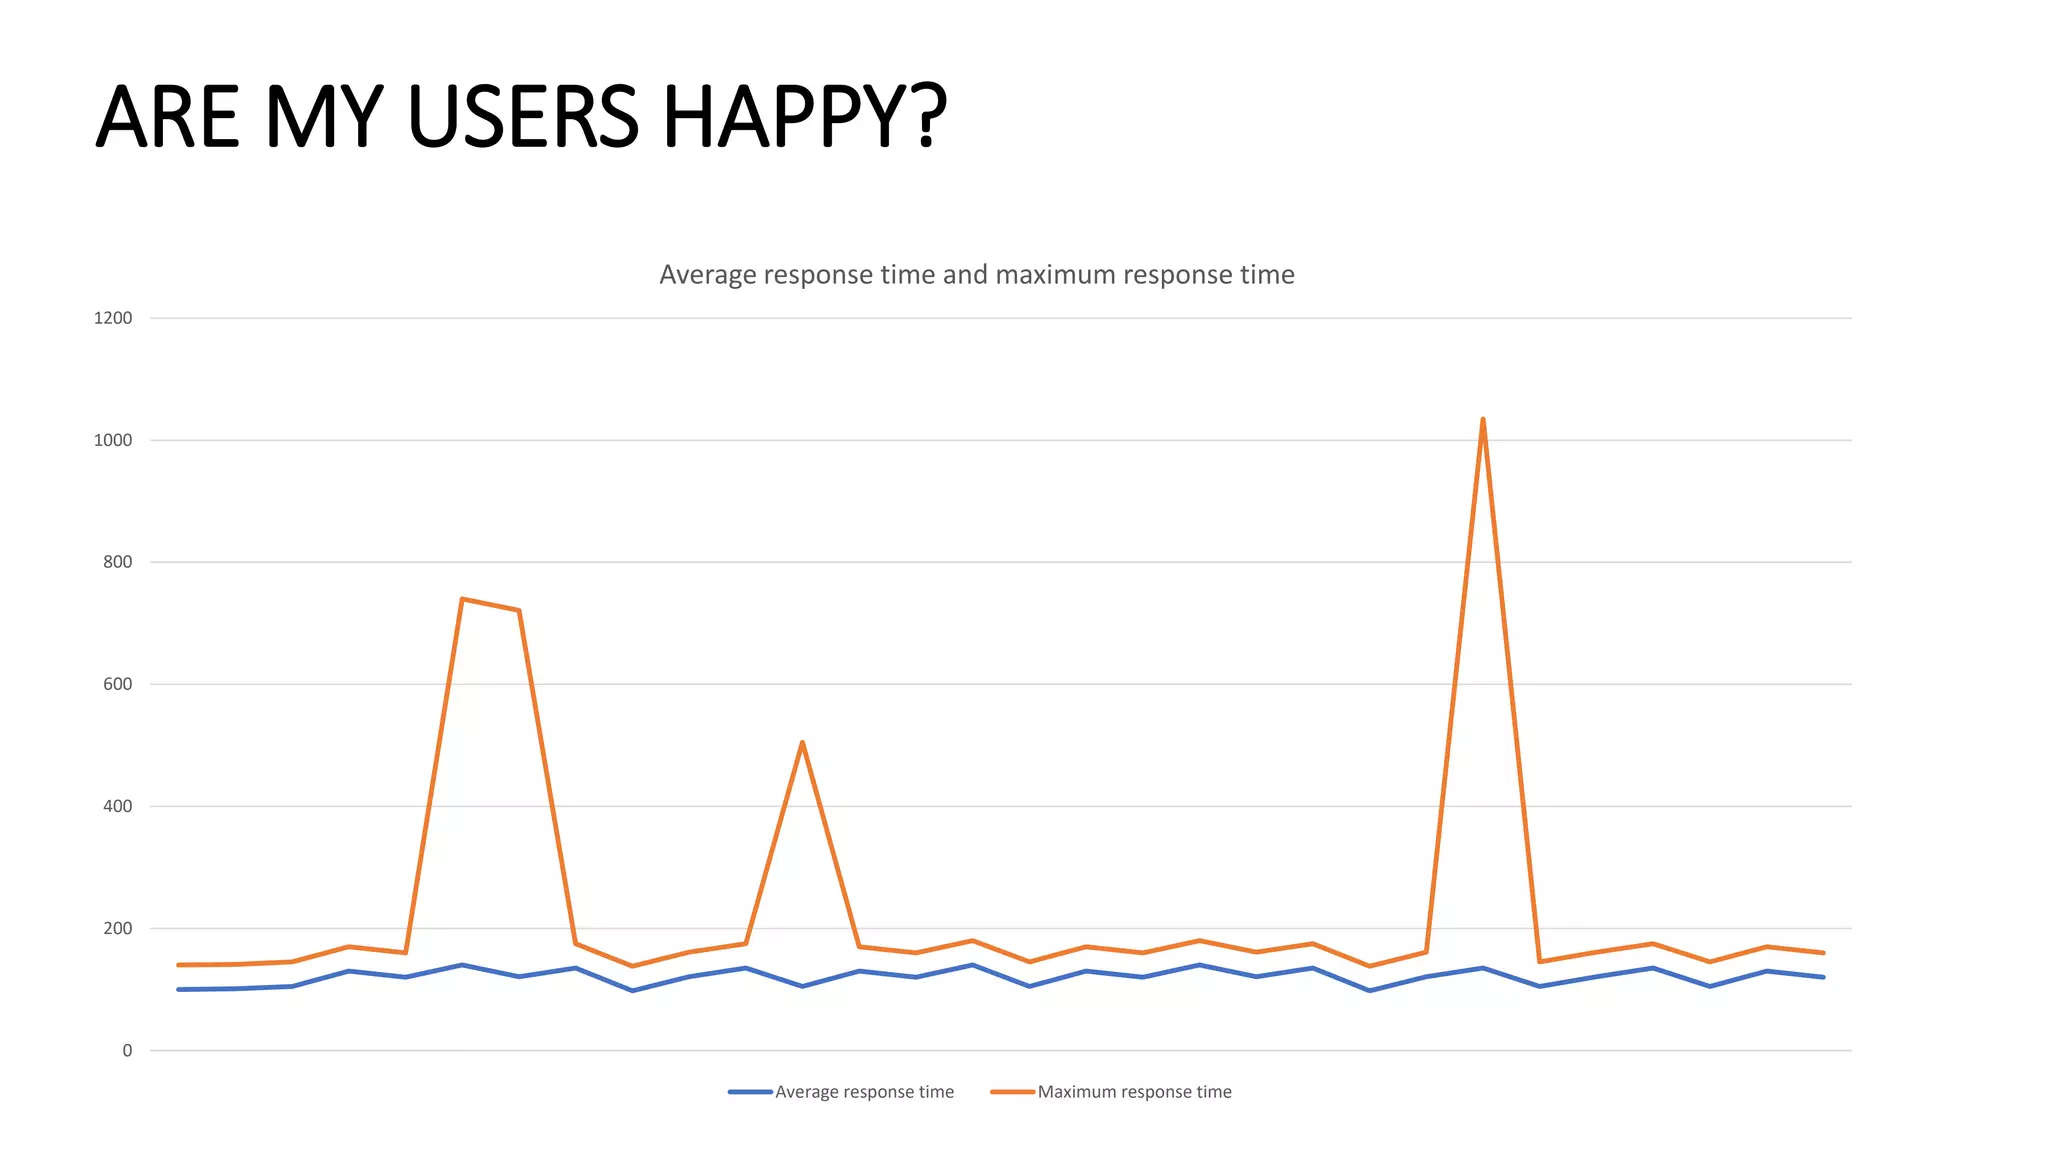
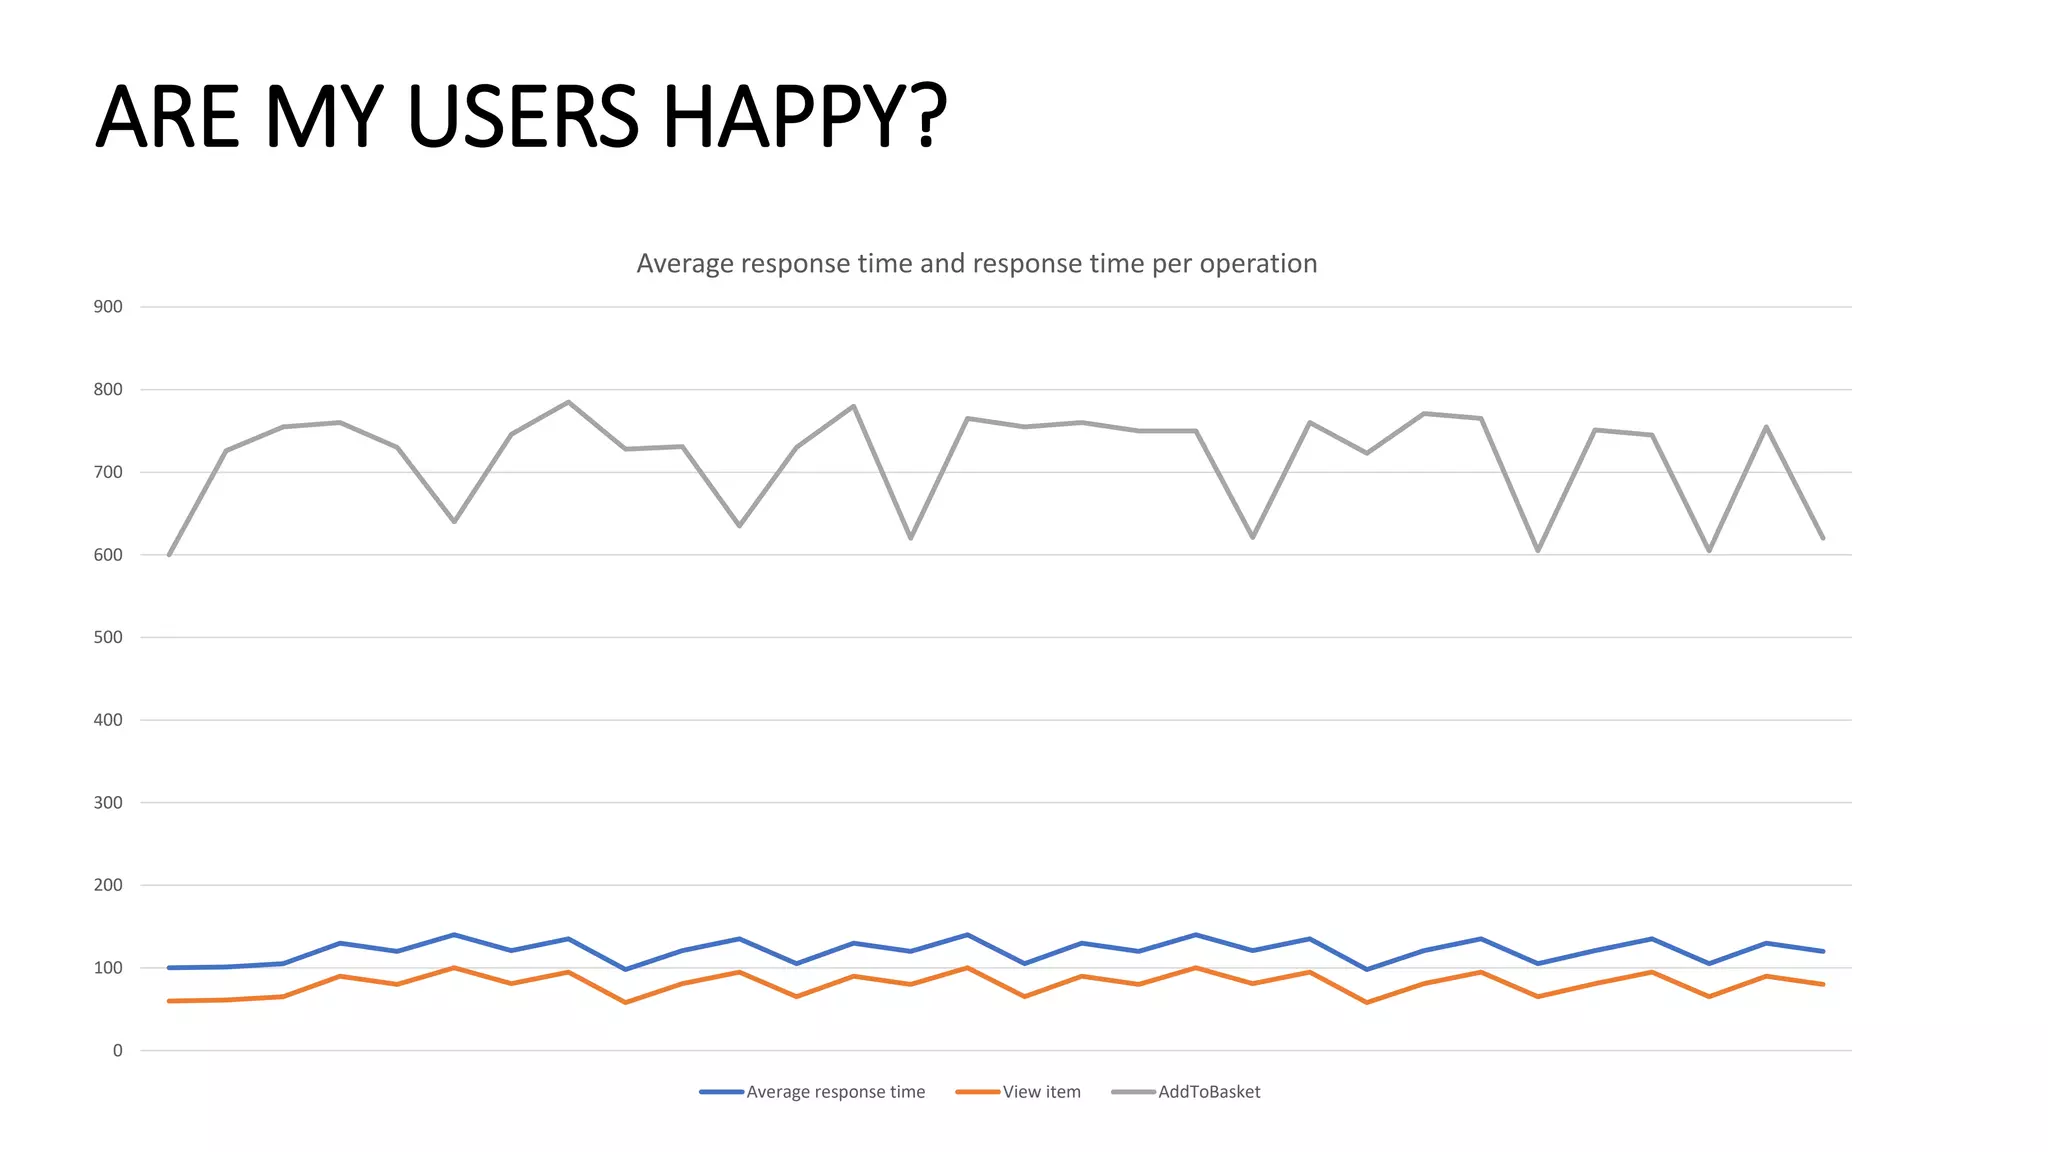
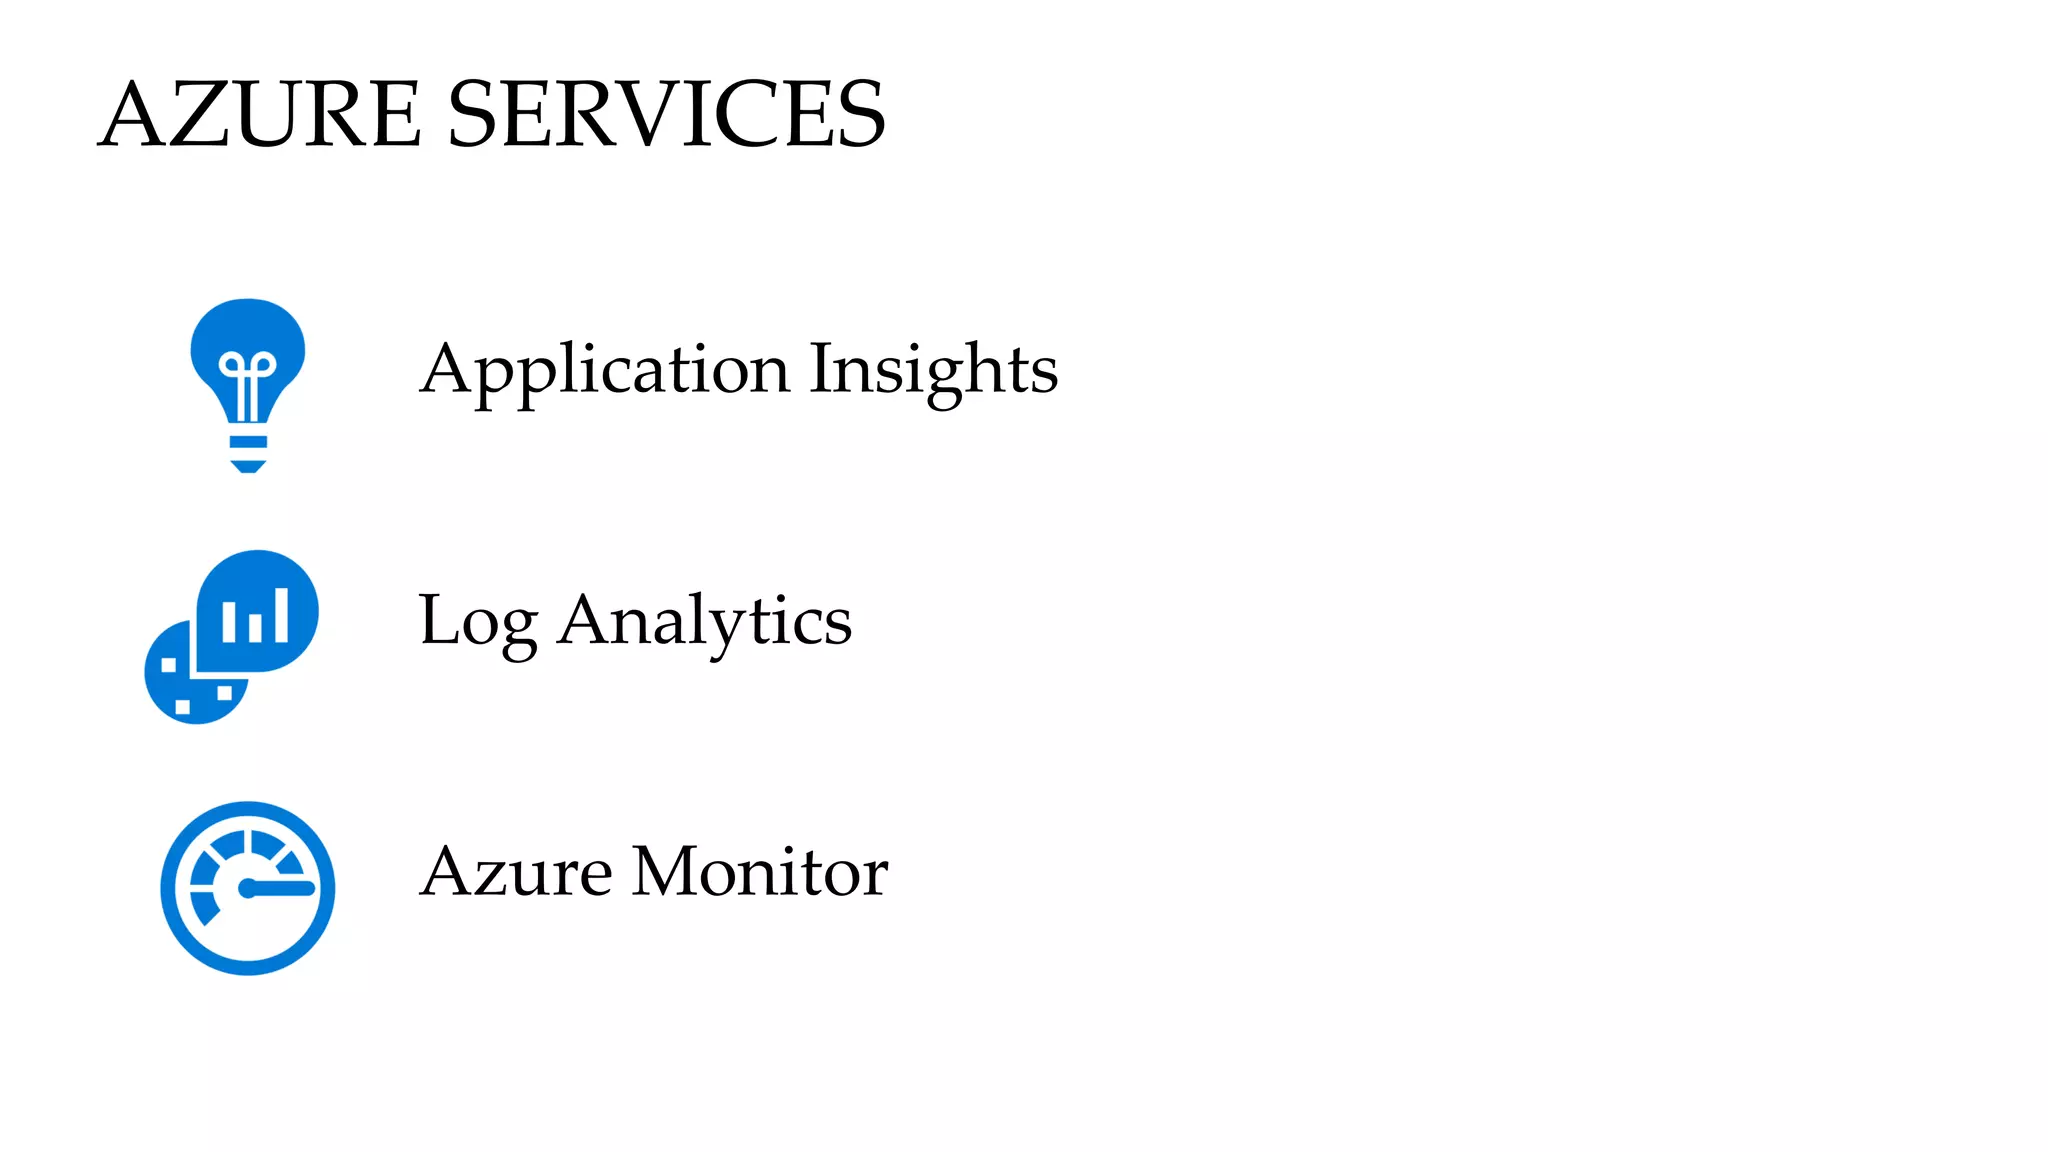
Logging
Instrumentation
Dashboards
Alerts
- for developers
WONDERING WHO
IS THAT GUY?
HENRY BEEN
Independent Devops & Azure Architect
E: henry@azurespecialist.nl
T: @henry_been
L: linkedin.com/in/henrybeen
W: henrybeen.nl
Very boring part
Pretty boring part
Maybe boring part
Amazing part
Really amazing part
Mindblowing part
LOGGING, INSTRUMENTATION, DASHBOARDS & ALERTS
A bit of monitoring theory
What to monitor
Demo’s!
LOGGING, INSTRUMENTATION, DASHBOARDS, ALERTS
Continuous Deployment for Azure Serverless - @henry_been
MONITORING
-or-
KNOWING WHAT BE HAPPENING
Instrumentation
Most often forgotten
Concerned with metrics
• (Timestamp, value) tuples
• Events & values
• Dimensions
• Used for Dashboards & Alerts
Rolled up over time
Logging
Often combined with tracing
Concerned with state changes
• When
• By who
• What changed
• Can be a source of metrics
Retained for longer or indefinitly
Tracing
Used for troubleshooting
What we developers call logging
• When
• Code location
• Very, very verbose message
• Can be a source of metrics
Retained for a limited time
MONITORING
VM / container
Timeseries
Database
Application Instance Agent
SDK
Logging
Database
Https endpoint
Visualization Engine
Your Dashboards
Query Engine
Your Alerts
Streaming Data Engine
BUT HEY THAT STUFF
IS OPERATIONS…
WHY WOULD I CARE?
DEVOPS POWERRRR
• DevOps is the union of people,
process, and products to enable
continuous delivery of value to
your end users.
“
”
DEVOPS
OKAY, OKAY I CARE…
NOW, WHAT TO MONITOR?
OKAY, OKAY I CARE…
NOW, WHAT NOT TO MONITOR?
WHAT NOT TO MONITOR (MAYBE)
FOCUS ON AVERAGES
Averages are lying cheats and hide real issues!
• Use dimensions to find outliers
• Use maximums or percentiles to identify spread
FOCUS ON YOUR SYSTEMS
Do you think your users care? At all?
• Is the amount of disk IO really interesting?
• Does page file usage predict conversion?
To add some nuances:
- Some system metrics are handy, just don’t start there maybe
- Same goes for averages
0
20
40
60
80
100
120
Database load(%)
DO WE HAVE AN ISSUE?
Proposed alert
ARE MY USERS HAPPY?
0
20
40
60
80
100
120
140
160
Average response time
0
200
400
600
800
1000
1200
Average response time and maximum response time
Average response time Maximum response time
ARE MY USERS HAPPY?
0
100
200
300
400
500
600
700
800
900
Average response time and response time per operation
Average response time View item AddToBasket
ARE MY USERS HAPPY?
PERCENTILES!
PERCENTILES!
PERCENTILES!
MEASURE THINGS
THE USER CARES ABOUT
AND THINK IT THROUGH!
Let’s do a
Quick Demo!
Demo
A VERY GOOD BOOK
ALSO QUITE THIN
FOR THOSE USING AZURE
HOW WOULD YOU DO IT?
AZURE SERVICES
Azure Monitor
Application Insights
Log Analytics
AZURE SERVICES
Azure Monitor
AZURE SERVICES
Metrics Logs
Azure Monitor
Platform
Built into (almost) every offering
Fixed metrics
• Different for each offering
• Automatically recorded
Enabled by default and FREE!
Custom
Using Application Insights
Custom metrics
• Self-chosen name
• Double values
• Dimensions disabled by default
Use the TelemetryClient class
Application
Using Application Insights
Well known metrics
• CPU percentage
• Response times
• Memory usage
Install NuGet package, configure
instrumation key and DONE
METRIC - SOURCES
DEMO TIME!
A Todo Application…
ALMOST
POST UrlShortner AddAliasProcessor
SQL Database
GET UrlShortner
VM / container
Timeseries
Database
Application Instance Agent
SDK
Logging
Database
Https endpoint
Visualization Engine
Your Dashboards
Query Engine
Your Alerts
Streaming Data Engine
Two more things
“YOU CAN USE THE DEMOS!”
“AND YOU CAN USE THE DEMOS!”
“EVERYBODY CAN USE THE DEMOS!”
DASHBOARDS
AND ALERTS
AS CODE
DO TRY THIS AT HOME!
HENRY BEEN
Independent Devops & Azure Architect
E: henry@azurespecialist.nl
T: @henry_been
L: linkedin.com/in/henrybeen
W: henrybeen.nl
Questions?
Now is the time!
Serverless computing   henry been - logging instrumentation dashboards alerts

Serverless computing henry been - logging instrumentation dashboards alerts