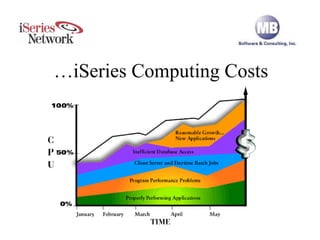
Drive Down iSeries Computing Costs … iSeries Computing Costs
I/O Causing CPU, Memory, Disk Bottlenecks 90% of all system performance issues are caused by excessive, unnecessary I/O performed by application software! High CPU Utilization Memory Faulting Slow Interactive Response Time Long Duration of Batch Jobs High Disk Actuator Arm Activity Application with SQL that Reads 1,000,000 Records to Select 1,000 Records
Tune Application Workload Before Hardware Tuning Don’t Tune Hardware First!  Enhance Efficiency of Applications… Tune Hardware Around Appropriate Workload
Identify Top Causes of Bottlenecks Identify Top Causes of Bottlenecks
Understand Make-up of Workload Understand Make-up of Workload
Create List of Top Priorities Create List of Top Priorities Interactive Threshold Being Exceeded Daytime SQL and Queries Impacting Response Time Nightly Processing Running for 5 Hours Payroll Job Running for 6 hours per Location AR Aging Report Killing System
Interactive Response Time 63%  - Interactive response time is usually OK, but random slowdowns occur.  Can’t find cause – solution appears to be a $100,000 interactive feature card.
Interactive SQL & Queries #1
Interactive SQL & Queries #2
Interactive SQL & Queries #3
Interactive SQL & Queries #4
HA Can’t Keep Up 51%  - Journal receivers are 10 GB per day, HA can’t keep up.
Journal Analyzer #1
Journal Analyzer #2
Journal Analyzer #3
Journal Analyzer #4
Java & JDBC Killing System 46%  - New web app uses Java & JDBC, when web lookup pages are hit, user waits 2 minutes.  System was fine until new app went live.
QJVACMDSRC
Application Analyzer
Job Logs Wasting Resources 32%  - 500,000 pages of job logs generated every day, logs rarely used, wasting disk space, CPU & I/O.
Spool Analyzer #1
Spool Analyzer #2
Spool Analyzer #3
Job Description & End Code
Message Logging
Q&A To receive MB Software’s FREE performance evaluation:  1.   Register at  http://www.mb-software.com   2.   Download and install software on AS/400   3.   Call (800) 713-5034 to schedule your free performance review session What To Expect :  After allowing performance data to accumulate for one full business day, you will log into a secure area of MB Software’s Web site and have a conference call to discuss our findings and how you can gain performance improvements. It’s that easy! Questions & Answers

How to Drive Down iSeries Computing Costs

  • 1.
    Drive Down iSeriesComputing Costs … iSeries Computing Costs
  • 2.
    I/O Causing CPU,Memory, Disk Bottlenecks 90% of all system performance issues are caused by excessive, unnecessary I/O performed by application software! High CPU Utilization Memory Faulting Slow Interactive Response Time Long Duration of Batch Jobs High Disk Actuator Arm Activity Application with SQL that Reads 1,000,000 Records to Select 1,000 Records
  • 3.
    Tune Application WorkloadBefore Hardware Tuning Don’t Tune Hardware First! Enhance Efficiency of Applications… Tune Hardware Around Appropriate Workload
  • 4.
    Identify Top Causesof Bottlenecks Identify Top Causes of Bottlenecks
  • 5.
    Understand Make-up ofWorkload Understand Make-up of Workload
  • 6.
    Create List ofTop Priorities Create List of Top Priorities Interactive Threshold Being Exceeded Daytime SQL and Queries Impacting Response Time Nightly Processing Running for 5 Hours Payroll Job Running for 6 hours per Location AR Aging Report Killing System
  • 7.
    Interactive Response Time63% - Interactive response time is usually OK, but random slowdowns occur. Can’t find cause – solution appears to be a $100,000 interactive feature card.
  • 8.
  • 9.
  • 10.
  • 11.
  • 12.
    HA Can’t KeepUp 51% - Journal receivers are 10 GB per day, HA can’t keep up.
  • 13.
  • 14.
  • 15.
  • 16.
  • 17.
    Java & JDBCKilling System 46% - New web app uses Java & JDBC, when web lookup pages are hit, user waits 2 minutes. System was fine until new app went live.
  • 18.
  • 19.
  • 20.
    Job Logs WastingResources 32% - 500,000 pages of job logs generated every day, logs rarely used, wasting disk space, CPU & I/O.
  • 21.
  • 22.
  • 23.
  • 24.
  • 25.
  • 26.
    Q&A To receiveMB Software’s FREE performance evaluation: 1. Register at http://www.mb-software.com 2. Download and install software on AS/400 3. Call (800) 713-5034 to schedule your free performance review session What To Expect : After allowing performance data to accumulate for one full business day, you will log into a secure area of MB Software’s Web site and have a conference call to discuss our findings and how you can gain performance improvements. It’s that easy! Questions & Answers