Download to read offline


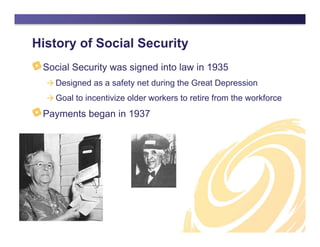
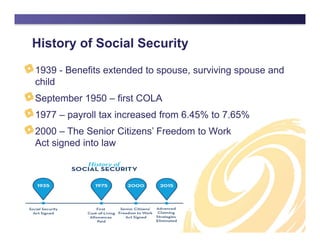
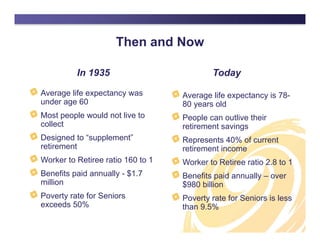
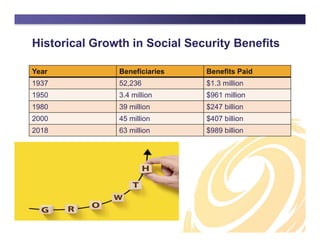
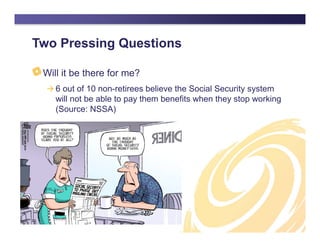
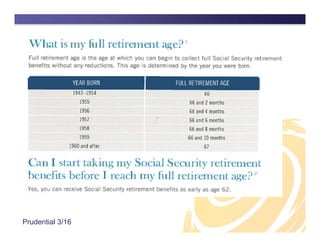

The document outlines the history and evolution of the Social Security system since its inception in 1935, highlighting its purpose as a safety net and its impacts on retirees. It raises concerns about the sustainability of benefits and the complexities of maximizing individual benefits, especially given the declining worker-to-retiree ratio and potential changes to the system. Additionally, it emphasizes the importance of informed claiming strategies to ensure optimal retirement income.


![[ON-DEMAND WEBINAR] COVID 2.0 | Tips To Address New Cases, Mask Mandates, & V...](https://cdn.slidesharecdn.com/ss_thumbnails/covidcrisis2-210806152705-thumbnail.jpg?width=640&height=640&fit=bounds)
![[ON-DEMAND WEBINAR] Revealing The State & Local Tax Considerations Of A Remot...](https://cdn.slidesharecdn.com/ss_thumbnails/saltwebinarthedigitalagejuly72021-final-210709174417-thumbnail.jpg?width=640&height=640&fit=bounds)
![[ON-DEMAND WEBINAR] How To Hire More Employees & Keep Them Happy: Tips To Att...](https://cdn.slidesharecdn.com/ss_thumbnails/employerresourcestoattractretaintoptalent-final-210630155616-thumbnail.jpg?width=640&height=640&fit=bounds)
![[ON-DEMAND WEBINAR] Managed Service Providers vs Managed Security Service Pro...](https://cdn.slidesharecdn.com/ss_thumbnails/20210622mspvmssp-210623184213-thumbnail.jpg?width=640&height=640&fit=bounds)
![[ON-DEMAND WEBINAR] CPA Pros Prepare For The 2020 Medicaid School Program (MSP)](https://cdn.slidesharecdn.com/ss_thumbnails/msp-govt-210610180017-thumbnail.jpg?width=640&height=640&fit=bounds)
![[ON-DEMAND RECORDING] Deep Impact: Is Your Manufacturing Company On A Collisi...](https://cdn.slidesharecdn.com/ss_thumbnails/deepimpactcmmc-final1-210602201540-thumbnail.jpg?width=640&height=640&fit=bounds)
![[ON-DEMAND WEBINAR] Security Wars: Episode 2 | CMMC: Return of The Process Fo...](https://cdn.slidesharecdn.com/ss_thumbnails/securitywarsreturnoftheprocess-final-210506151147-thumbnail.jpg?width=640&height=640&fit=bounds)
![[ON-DEMAND WEBINAR] Construction Companies: Manage Cyber Risk Exposure & Prev...](https://cdn.slidesharecdn.com/ss_thumbnails/areyoumanagingyourcybersecurityriskexposure-finalslides-210428205826-thumbnail.jpg?width=640&height=640&fit=bounds)
![[ON-DEMAND WEBINAR] Covid Vaccine & HIPAA: Can Employers To Receive The COVID...](https://cdn.slidesharecdn.com/ss_thumbnails/navigatingcovidintheworkplace-finalslides-210420203815-thumbnail.jpg?width=640&height=640&fit=bounds)
![[ON-DEMAND RECORDING] Managing Remote Employees, HR Policies, Sales Tax, & Ot...](https://cdn.slidesharecdn.com/ss_thumbnails/pullingbackthelayersofremotework-finalslides-210415165150-thumbnail.jpg?width=640&height=640&fit=bounds)

![[ON-DEMAND WEBINAR] Understanding SOC2: A SOC 2 Guide for Managed Service Pro...](https://cdn.slidesharecdn.com/ss_thumbnails/soc2guideformsps3-210309185410-thumbnail.jpg?width=640&height=640&fit=bounds)
![[ON-DEMAND WEBINAR] Third Annual Construction Industry Kickoff | Rea & Associ...](https://cdn.slidesharecdn.com/ss_thumbnails/3rdannualconstructionkickoff-presentation-210125191902-thumbnail.jpg?width=640&height=640&fit=bounds)
![[ON-DEMAND WEBINAR] New Year, New COVID 19 Vaccine, New Unemployment Rules, N...](https://cdn.slidesharecdn.com/ss_thumbnails/hrwebinar-january132021003-210113202803-thumbnail.jpg?width=640&height=640&fit=bounds)