Chapter 13
Social Security
Jonathan Gruber
Public Finance and Public Policy
Aaron S. Yelowitz - Copyright 2005 © Worth Publishers
Introduction
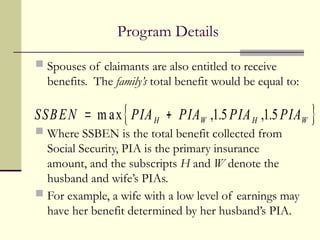
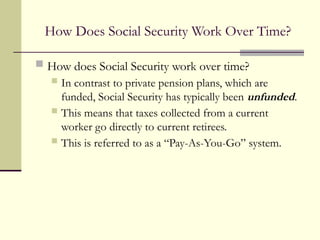
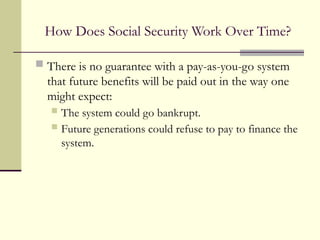
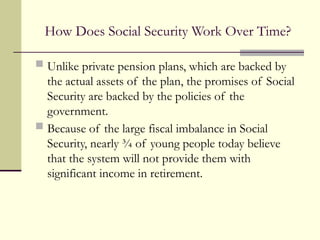
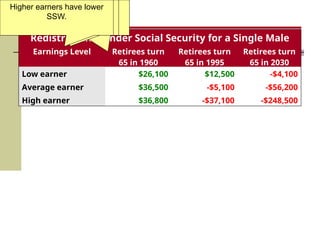
 Social Security is a federal program that taxes
workers to provide income support for the elderly.
 Over the next 75 years, the program has promised
$3.7 trillion more in benefit payments than it plans to
collect in taxes from workers.
Introduction
 There are many directions that Social Security reform could
go in, but little progress has been made.
 Reforming the program is difficult because it is the single
largest income source of the elderly; thus reform suggestions
may bring withering political attacks.
 Social Security is also the largest social insurance program in
the U.S.
 By making payroll tax payments to Social Security, workers
purchase insurance against earnings loss when they die or
retire.
Introduction
 This lesson reviews institutional features of Social
Security, and provides economic motivations for
government intervention.
 It then examines behavioral responses, such as
crowding out of saving and encouraging early
retirement.
 Lastly, we examine potential reforms.
WHAT IS SOCIAL SECURITY AND HOW
DOES IT WORK?
 Social Security began in 1935, during the height of
the Great Depression. The main motivation was to
provide a means of support for this unfortunate
generation of elderly.
 Basic structure is that workers (and employers) pay a
payroll tax, and the money is used to pay benefits to
the current generation of elderly.
Program Details
 There are numerous details to Social Security.
 Social Security is financed through the FICA tax,
which totals 12.4% of gross earnings up to $87,900
in 2004.
 An individual can collect Social Security as early as
age 62, assuming he has paid into the system
through the payroll tax for 10 years.
Program Details
 When eligible, the Social Security claimant receives
an annuity payment, a payment that lasts until the
recipient’s death.
 The payment is a function of average indexed monthly
earnings, or AIME.
 Earnings are calculated from the 35 highest years of
earnings. If the claimant worked less than 35 years,
those years are treated as “0”.
 They are indexed for inflation.
Program Details
 Social Security benefits are then calculated as a
redistributive function of past earnings.
 Low earners get higher relative payments, but lower
absolute payments.
 Figure 1 illustrates the current relationship between
earnings and benefits.
Figure 1
$5,892
$3,689
$1,000 $2,000 $3,000 $4,000 $5,000 $6,000 $7,000 $8,000
$0
Social
Security
Benefits
(PIA)
$0
Average Indexed Monthly Earnings (AIME)
Social Security Benefits as a Function of Earnings
9
0
¢
/
$
32¢/$
15¢/$
0¢/$
$1,865.89
$1,535.44
$550.80
$612
Workers who have monthly earnings
less than $612 receive 90¢ in
benefits for every $1 of earnings.
Thus, a worker earning exactly $612
per month would get 0.90*$612, or
$550.80 in monthly benefits.
The x-axis measures
real monthly earnings,
known as AIME.
The y-axis measures
Social Security benefits
taken at the “normal”
retirement age.
This is the
relationship
between earnings
and benefits.
For the next $3,077 in monthly
earnings beyond the initial $612,
workers receive only 32¢ in benefits
per dollar earnings.
Thus, the total benefit from earning
$3,689 per month is $1535.44, which
equals 0.90*$612 + 0.32*$3,077.
For the next $2,203 in monthly
earnings, benefits increase by just
15¢ for every dollar of earnings.
The corresponding benefit for
someone earning $5,892 (or more)
per month is $1865.89.
For AIME above $5,892, no benefits
are paid because this corresponds to
the level where no payroll taxes are
paid.
Program Details
 The benefit formula is a redistributive function of past
earnings because:
 Workers who earn more get higher benefits
 But the benefits do not rise at nearly as fast as earnings.
 The replacement rate is the ratio of benefits received to
earnings prior to the entitling event.
 For the average earner, the Social Security replacement rate is
40%.
 For low earners, it is closer to 60%.
 For high earners, it is closer to 20%.
Program Details
 How are Social Security benefits paid out?
 Individuals can receive their Primary Insurance Amount (PIA)
starting at age 65, which is the Full Benefits Age (FBA).
 One can collect benefits as early as 62, the Early Entitlement
Age (EEA).
 The FBA is rising to age 67; almost all college students would
need to wait until 67 to collect the PIA.
 If one collects benefits before their FBA, the benefits are
actuarially reduced. The reduction accounts for differing years
of collecting benefits and the time value of money.
 There is a delayed retirement credit (DRC) for those who wait
to collect Social Security after the FBA.
Program Details
 For beneficiaries between 62 and 64, there is an
earnings test of $11,640, meaning any $1 earnings
beyond that point reduces Social Security benefits by
50¢.
 This is not exactly a tax, however, because the
benefits are returned later with interest.
Program Details
 Spouses of claimants are also entitled to receive
benefits. The family’s total benefit would be equal to:
 Where SSBEN is the total benefit collected from
Social Security, PIA is the primary insurance
amount, and the subscripts H and W denote the
husband and wife’s PIAs.
 For example, a wife with a low level of earnings may
have her benefit determined by her husband’s PIA.
 
SSBEN PIA PIA PIA PIA
H W H W
 
m ax , . , .
1 5 1 5
How Does Social Security Work Over Time?
 How does Social Security work over time?
 In contrast to private pension plans, which are
funded, Social Security has typically been unfunded.
 This means that taxes collected from a current
worker go directly to current retirees.
 This is referred to as a “Pay-As-You-Go” system.
How Does Social Security Work Over Time?
 There is no guarantee with a pay-as-you-go system
that future benefits will be paid out in the way one
might expect:
 The system could go bankrupt.
 Future generations could refuse to pay to finance the
system.
How Does Social Security Work Over Time?
 Unlike private pension plans, which are backed by
the actual assets of the plan, the promises of Social
Security are backed by the policies of the
government.
 Because of the large fiscal imbalance in Social
Security, nearly ¾ of young people today believe
that the system will not provide them with
significant income in retirement.
How Does Social Security Work Over Time?
 In reality, Social Security is not a completely
unfunded system; some of today’s payroll
contributions go into the Social Security Trust Fund
to help pay for future retirees.
 Yet, the trust fund is projected to run out of money
by 2042, at which point Social Security becomes a
completely unfunded system.
 The unfunded nature of Social Security creates
redistribution across generations.
 See Table 1.
Table 1
Social Security in a Two-Period World
Period Number
of young
workers
Earnings
per
young
worker
Taxes
paid per
young
worker
Total
taxes paid
Number
of old
retirees
Benefits
to old
retirees
Taxes
paid by
old
retirees
Rate of
return
1 100 $20,000 0 0 0 0 --- ---
2 105 $21,000 $2,100 $220,500 100 $2,205 0 ∞
3 110 $22,050 $2,205 $242,550 105 $2,310 $2,100 10%
4 115 $23,153 $2,315 $266,225 110 $2,420 $2,205 10%
5 121 $24,310 0 0 115 0 $2,315 -∞
Individuals live for two periods, and
then die. They are young in the first
period, and old in the second.
When they are young, they work
and pay a tax to support Social
Security.
When they are old, the collect
Social Security.
The population grows over time, in
this case by 5% per period.
Real wages are assumed to rise at
5% as well, due to increased
productivity.
There is no Social Security program in
year 1. The young do not have to pay
Social Security taxes.
Social Security is started as an
unfunded program in year 2, with a 10%
payroll tax on the current young.
The taxes collected are $220,500;
$2,100 per person x 105 young people.
This is divided among the 100 elderly.
Because the elderly did not pay into
the system, yet they collect benefits,
their rate of return is infinite.
The initial generation (elderly who did
not pay) is the big winner from the
unfunded system.
In year 3, the elderly are those who
were young and paying taxes in year 2.
Recall they paid in $2,100 each.
They now receive $2,310 in benefits,
10% more than they paid in.
This return comes from higher total
tax collections due to wage growth
and population growth.
If population and wage growth are
high, the rate of return to “middle
generations” can be large.
Now imagine that in year 5, the young
workers scrap the system. They pay no
taxes.
The elderly in year 5 (who were young in
year 4) suffer as a consequence. They paid
into the system but got nothing out of it.
How Does Social Security Work Over Time?
 This example illustrates several points.
 The return to “middle generations” depends on the
rates of population and wage growth.
 Unfunded Social Security carries with it a legacy
debt, the debt incurred by the government because
early generations received much more in benefits
than they paid in taxes.
How Does Social Security Work Over Time?
 The example shows how Social Security
redistributes across generations:
 The first generation received a large windfall.
 The middle generations got a rate of return
determined by wage and population growth.
 The final generation was the big loser.
How Does Social Security Redistribute in
Practice?
 How does Social Security redistribute in practice?
 We compute Social Security Wealth (SSW), the expected
PDV of Social Security benefits over a person’s lifetime, minus
the PDV of payroll taxes.
 This involves several steps:
 Calculate the entire future stream of benefits that the person
expects to receive before he or she dies, accounting for
mortality. Use a discount rate to compute PDV of benefits.
 Calculate the entire future stream of payroll taxes. Compute
the PDV of taxes.
 Take the difference between the two to get SSW.
 Table 2 shows the results.
Table 2
Redistribution under Social Security for a Single Male
Earnings Level Retirees turn
65 in 1960
Retirees turn
65 in 1995
Retirees turn
65 in 2030
Low earner $26,100 $12,500 -$4,100
Average earner $36,500 -$5,100 -$56,200
High earner $36,800 -$37,100 -$248,500
Moving across the columns
examines successively
younger generations.
Younger generations have
lower SSW than older
generations.
Moving down the rows looks
at higher earners.
Higher earners have lower
SSW.
How Does Social Security Redistribute in
Practice?
 The redistribution to the oldest generation occurs
for the kinds of reasons we saw in the previous
table.
 They did not pay into the system for much of their
working lives, but received benefits over their whole
retirement.
 In addition, not only was there population growth
and wage growth, but also growth in the actual
payroll tax rate.
How Does Social Security Redistribute in
Practice?
 For more recent retirees (the 1995 cohort), Social
Security has generally become a losing proposition.
 They paid into the system for their entire working
lives.
 The growth in the payroll tax rate has slowed.
 There has been a significant slowdown in wage
growth and population growth.
How Does Social Security Redistribute in
Practice?
 For future retirees (the 2030 cohort), the outcome is
the worst of all.
 Payroll taxes are not rising at all.
 Wage and population growth are slow.
How Does Social Security Redistribute in
Practice?
 In addition, the system has shifted from one that
favors the rich in earlier generations to one that
favors the poor.
 The reason is for this change is that higher-income
earners pay more money into the system through
payroll taxes; but when the returns to Social Security
are low, the higher-income earner has more money
of his or her own in an underperforming asset.
How Does Social Security Redistribute in
Practice?
 Finally, Social Security redistributes in other ways.
 It pays an annuity until death; therefore groups with
shorter life expectancies (men, the poor, minorities,
smokers) tend to lose under such a system.
 It provides survivorship benefits; this redistributes
toward married couples relative to single individuals.
 It adjusts the benefit level by 50% for married
households with a single earner; this redistributes
toward single-earner married households.
 It generally redistributes from the rich to the poor,
even with adjustments for life expectancy.
CONSUMPTION SMOOTHING BENEFITS OF
SOCIAL SECURITY:
Rationales for Social Security
 On the surface, it is not clear why there is
government involvement in Social Security, since
retirement is an anticipated event that is largely an
individual decision.
 There are a number of rationales for government
involvement, however.
Rationales for Social Security
 First, there may be market failures in the annuities
market that Social Security solves.
 This market is subject to adverse selection, where the
“high risks” are the ones who live a long time.
 Finkelstein and Poterba (2004) find compelling
evidence for such adverse selection.
Rationales for Social Security
 Second, paternalism comes into play: policymakers
believe that individuals won’t save enough for their
own retirement.
 In 1991, for example, the median American aged 51-
61 had $107,000 in future Social Security wealth, but
only $16,000 in private pension wealth and $3,000 in
other personal retirement assets.
Does Social Security Smooth Consumption?
 Regardless of the reason, Social Security’s existence
is motivated by consumption smoothing.
 The question then becomes does it?
 The existing evidence shows that it does help
smooth consumption.
Does Social Security Smooth Consumption?
 The evidence comes in several forms:
 Private savings behavior
 Consumption at retirement
 Living standards of the elderly
Does Social Security Smooth Consumption?
 Existing research suggests that each $1 of Social
Security wealth crowds out 30¢ to 40¢ of private
savings.
 This is important, but not full crowd-out.
 Assessing the evidence in the U.S. is difficult because
Social Security is a nationally uniform program,
which makes it difficult to find good treatment and
control groups.
 Other countries, such as Italy and the U.K., have had
changes that lend credence to the magnitude of
crowding out.
Does Social Security Smooth Consumption?
 Another approach is to look directly at
consumption. A model with diminishing marginal
utility would imply smooth consumption over time.
 Bernheim, Skinner, and Weinberg (2001) found that
consumption falls more than 30% when individuals
retire.
 This finding is consistent with only a partial
crowding-out of private savings by the Social
Security system.
Does Social Security Smooth Consumption?
 A third piece of evidence examines the poverty rates
of the elderly.
 The poverty rate is defined as:
 The number of elderly with income less than the
poverty threshold divided by the total number of
elderly.
 Figure 2 shows the results.
Elderly Poverty Rate and SS Over Time
0
8
16
24
32
40
1959 1965 1971 1977 1983 1989 1995 2001
Year
Pov
e
rty
R
a
te
for
6
5+
(%
)
2.0
2.5
3.0
3.5
4.0
4.5
SS
Spe
nding
(%
of
GD
P)
SS Spending
Elderly Poverty Rate
While Social Security
spending has gone up.
The fraction of elderly living in
poverty has fallen
dramatically over time.
Figure 2
Does Social Security Smooth Consumption?
 The decline in poverty rates for the elderly during
the 1960s and 1970s coincided with the time when
the Social Security program grew the fastest.
 Engelhardt and Gruber (2004) analyze how poverty
fell for birth cohorts that benefited from expansion
in Social Security, relative to those that did not, and
conclude that Social Security can explain the entire
time trend reduction in poverty among the elderly
over this period.
SOCIAL SECURITY AND RETIREMENT:
Theory
 The design of Social Security naturally leads to the
issue of whether it encourages early retirement.
 Social Security may encourage early retirement
through:
 Implicit taxation, acting as a “substitution effect.”
 Redistribution, acting as an “income effect.”
Theory
 The “implicit tax” takes account of the fact that a worker at
the early entitlement age can choose to work another year.
 If so, SSW changes because:
 One more year of payroll taxes is paid.
 One year of Social Security benefits is given up.
 The benefit level goes up because of actuarial adjustment.
 The year of work usually replaces a low earnings year
with a high earnings year.
 Higher implicit taxes should lead to earlier retirement.
 The redistributive effects were discussed early, and act as an
income effect.
Evidence
 There are three sources of evidence that suggest
Social Security encourages retirement:
 Time series evidence
 The retirement hazard rate
 International comparisons
Evidence
 Figure 3 illustrates time series evidence. It shows
the labor force participation of males, plotted
against Social Security spending.
 The time series for females is clouded by the general
upward trend in female labor force participation
since World War II.
Figure 3
Elderly Labor Force Participation and SS Over Time
10
12
14
16
18
20
22
1959 1965 1971 1977 1983 1989 1995 2001
Year
Labor
Force
Participation
Rate
(%
of
65+
in
labor
force)
1.5
2.0
2.5
3.0
3.5
4.0
4.5
SS
Spending
(%
of
GDP)
SS Spending
Labor Force Participation
While Social Security
spending has gone up.
The fraction of elderly men
who are working has fallen
dramatically.
Evidence
 The second piece of evidence comes from
examining the age pattern at retirement.
 The retirement hazard rate is the percentage of
working people who retire at a given age.
 Figure 4 shows the results.
0
0.05
0.10
0.15
0.20
0.25
Age
Retirement
Hazard
Rate
SS EEA
SS FBA
55 60 65 70
62
The hazard rate again
spikes at 65, the FBA.
The hazard rate falls at
ages 63 and 64.
The hazard rate is less
than 10% through age 61.
The hazard rate spikes up
at age 62, which is also
the early entitlement age.
Figure 4
Evidence
 The hazard rates in Figure 4 are suggestive, but not
necessarily conclusive about the impact of Social
Security.
 Figure 5 shows similar hazard rates in 1960 (before
the EEA), 1970, and 1980.
Retirement
Hazard
Rate
0
0.05
0.10
0.15
0.20
0
0.05
0.10
0.15
0.20
0
0.05
0.10
0.15
0.20
Age
55 65 70
1960
1970
1980
62
SS EEA
SS FBA
There was no spike in the
hazard rate in 1960, before
the EEA was introduced.
The spike grew slowly over
time, after the EEA was
introduced.
Figure 5
Evidence
 A third type of evidence, and perhaps most
compelling, is to make international comparisons.
 There are spikes in other countries too, at the EEA
and FBA, even when those ages differ from that in
the United States.
 Figure 6 shows retirement patterns in France.
50 55 60 65 70
0
0.1
Retirement
Hazard
Rate
Age
-0.1
0.2
0.3
0.4
0.5
0.6
0.7 SS EEA & FBA
There is an enormous spike in the
hazard rate in France at age 60,
which is both the EEA and FBA.
60% of those working when they
turn 60 retire during the next year.
Moreover, when the “age 60”
retirement age was not an option in
France, the hazard rate was 10%.
Figure 6
Evidence
 Figure 7 shows evidence from Germany, which
lowered its retirement age in the early 1970s.
58
59
60
61
62
63
64
1968 1972 1976 1980 1984 1988 1992
EEA Introduced
in 1973
Year
Mean
Retirement
Age
Germany lowered the early
retirement age from 65 to 60 in
1973.
Within 7 years, the average age at
which individuals retire had fallen
from 63 to 58.
Figure 7
Implicit Social Security
taxes and retirement behavior
 Finally, Gruber and Wise (1999) present data from a
series of counties on the implicit tax rates from
Social Security and the decision not to work.
 The results show a strong positive relationship
between retirement rates and tax rates.
 Figure 8 shows their results.
Application
Figure 8
20
-0.5 0 0.5 1.0 1.5 2.0 2.5
30
40
50
60
70
Disincentive to work
Nonworking
Elderly
R2
= 0.82
Japan
US
Canada
Sweden
Spain
UK
France
Germany
Belgium
Italy
Netherlands
In nations like the United States,
Sweden, and especially Japan,
there is little implicit tax.
These countries also have higher
percentages of elderly working.
Other countries, like the
Netherlands, Belgium, France, and
Italy, have high taxes.
They also have lower percentages
of elderly working.
The horizontal axis measures the
“implicit tax” to working at older
ages.
For example, the measure takes
into account the extra payroll taxes
paid by working another year.
It also takes into account any
upward adjustments to benefit
levels for delaying retirement.
And it accounts for the fact that
average earnings tend to be higher
by delaying retirement.
Implicit Social Security
taxes and retirement behavior
 In summary, the evidence suggests that Social
Security systems that penalize work beyond the
retirement age have led to increased retirements.
Application
SOCIAL SECURITY REFORM
 The Social Security system, in its current form, is
unsustainable.
 The number of elderly that need to be supported by
workers continues to grow over time.
 See Figure 9.
Ratio of Elderly to Working Age Population
0
5
10
15
20
25
30
35
40
1950 1960 1970 1980 1990 2000 2010 2020 2030 2040 2050
Year
Number
of
elderly
per
100
working
age
people
The number of elderly,
relative to workers,
has grown over time.
By 2025, there will be
a larger share of
elderly in the U.S. than
there are in Florida
currently.
Figure 9
SOCIAL SECURITY REFORM
 Also, over the next 75 years, the PDV of the
program’s obligations exceed the PDV of the taxes
it will collect by $3.7 trillion.
 Three factors cause this imbalance:
 Improvements in life expectancy
 A reduction in birth rates
 The growth in wages has slowed dramatically.
Reform Round I: The Greenspan
Commission
 With impending financial problems, the Greenspan
Commission in 1983 recommended a number of
changes that took place:
 Speeding up increases in the payroll tax.
 Cutting benefits.
 These policy changes staved off Social Security’s
financing problems to some extent, but did not
solve them.
Incremental Reforms
 There are a number of approaches that build on the
current system:
 Raise payroll taxes further: An increase from 12.4% to
14.3% solves financing problems for the next 75
years; raising it to 15.9% solves it forever.
 Extend the base of taxable wages: Some workers are not
covered by Social Security, and would represent a net
gain in the financial position of the program.
 Raise the retirement age: The FBA has not moved up in
lock-step with life expectancy.
Incremental Reforms
 Lower benefits: Lower rates at which the AIME is
translated into the PIA. Alternatively, the
government could adjust the indexation rate.
 Means-test the program: Another possibility would be
to tax benefits for higher income households.
Fundamental Reforms
 In addition to the “incremental reforms” discussed,
there are some more fundamental reforms that have
been posed as a solution to Social Security’s financial
imbalance:
 Invest the trust fund in stocks
 Privatization
Fundamental Reforms
 Investing the trust fund in stocks–100% of the assets of the
Social Security Trust Fund are held in bonds.
 A slow investment of the trust fund in the stock market
could lead to a higher rate of return and cover half of the
projected 75-year deficit.
 This runs into the problem that politicians may simply
take these higher returns and use them for government
spending.
 Also, there is concern the government might abuse its
position to manipulate capital markets for its own good.
Fundamental Reforms
 A more radical alternative is privatization–allowing
individuals to invest their payroll taxes in various
assets through individually controlled accounts.
 The capital would then truly be “off-budget” to
politicians, unlike the Social Security Trust Fund.
 It would also respect consumer sovereignty with
respect to investment decisions.
Fundamental Reforms
 The transition to such a system is the most difficult
problem–how do we let individuals save money for
their own retirement, while at the same time
supporting the existing generation of retirees?
 Once the need to pay back this legacy debt is
accounted for, a privatized Social Security system
would not provide a higher rate of return.
Fundamental Reforms
 Such a privatized system could also have higher
administrative costs; the current system’s costs are
only 0.19% of the program’s asset balances.
 For example, the administrative costs of the U.K.
and Chile, two countries with privatized systems, are
more than 100 basis points higher, which over the
course of many years substantially lowers wealth
levels.
Fundamental Reforms
 A final issue with privatization is that policy makers
may not want to respect consumer sovereignty with
respect to retirement savings.
 In private 401(k) accounts, for example, company
stock makes up 1/6th
of aggregate assets. This
option almost never makes sense.
Recap of Social Security
 What is Social Security and how does it work?
 Consumption smoothing benefits of Social Security
 Social Security and Retirement
 Social Security Reform

Jonathan Gruber_Ch. 13 Social Security.pptx

  • 1.
    Chapter 13 Social Security JonathanGruber Public Finance and Public Policy Aaron S. Yelowitz - Copyright 2005 © Worth Publishers
  • 2.
    Introduction  Social Securityis a federal program that taxes workers to provide income support for the elderly.  Over the next 75 years, the program has promised $3.7 trillion more in benefit payments than it plans to collect in taxes from workers.
  • 3.
    Introduction  There aremany directions that Social Security reform could go in, but little progress has been made.  Reforming the program is difficult because it is the single largest income source of the elderly; thus reform suggestions may bring withering political attacks.  Social Security is also the largest social insurance program in the U.S.  By making payroll tax payments to Social Security, workers purchase insurance against earnings loss when they die or retire.
  • 4.
    Introduction  This lessonreviews institutional features of Social Security, and provides economic motivations for government intervention.  It then examines behavioral responses, such as crowding out of saving and encouraging early retirement.  Lastly, we examine potential reforms.
  • 5.
    WHAT IS SOCIALSECURITY AND HOW DOES IT WORK?  Social Security began in 1935, during the height of the Great Depression. The main motivation was to provide a means of support for this unfortunate generation of elderly.  Basic structure is that workers (and employers) pay a payroll tax, and the money is used to pay benefits to the current generation of elderly.
  • 6.
    Program Details  Thereare numerous details to Social Security.  Social Security is financed through the FICA tax, which totals 12.4% of gross earnings up to $87,900 in 2004.  An individual can collect Social Security as early as age 62, assuming he has paid into the system through the payroll tax for 10 years.
  • 7.
    Program Details  Wheneligible, the Social Security claimant receives an annuity payment, a payment that lasts until the recipient’s death.  The payment is a function of average indexed monthly earnings, or AIME.  Earnings are calculated from the 35 highest years of earnings. If the claimant worked less than 35 years, those years are treated as “0”.  They are indexed for inflation.
  • 8.
    Program Details  SocialSecurity benefits are then calculated as a redistributive function of past earnings.  Low earners get higher relative payments, but lower absolute payments.  Figure 1 illustrates the current relationship between earnings and benefits.
  • 9.
    Figure 1 $5,892 $3,689 $1,000 $2,000$3,000 $4,000 $5,000 $6,000 $7,000 $8,000 $0 Social Security Benefits (PIA) $0 Average Indexed Monthly Earnings (AIME) Social Security Benefits as a Function of Earnings 9 0 ¢ / $ 32¢/$ 15¢/$ 0¢/$ $1,865.89 $1,535.44 $550.80 $612 Workers who have monthly earnings less than $612 receive 90¢ in benefits for every $1 of earnings. Thus, a worker earning exactly $612 per month would get 0.90*$612, or $550.80 in monthly benefits. The x-axis measures real monthly earnings, known as AIME. The y-axis measures Social Security benefits taken at the “normal” retirement age. This is the relationship between earnings and benefits. For the next $3,077 in monthly earnings beyond the initial $612, workers receive only 32¢ in benefits per dollar earnings. Thus, the total benefit from earning $3,689 per month is $1535.44, which equals 0.90*$612 + 0.32*$3,077. For the next $2,203 in monthly earnings, benefits increase by just 15¢ for every dollar of earnings. The corresponding benefit for someone earning $5,892 (or more) per month is $1865.89. For AIME above $5,892, no benefits are paid because this corresponds to the level where no payroll taxes are paid.
  • 10.
    Program Details  Thebenefit formula is a redistributive function of past earnings because:  Workers who earn more get higher benefits  But the benefits do not rise at nearly as fast as earnings.  The replacement rate is the ratio of benefits received to earnings prior to the entitling event.  For the average earner, the Social Security replacement rate is 40%.  For low earners, it is closer to 60%.  For high earners, it is closer to 20%.
  • 11.
    Program Details  Howare Social Security benefits paid out?  Individuals can receive their Primary Insurance Amount (PIA) starting at age 65, which is the Full Benefits Age (FBA).  One can collect benefits as early as 62, the Early Entitlement Age (EEA).  The FBA is rising to age 67; almost all college students would need to wait until 67 to collect the PIA.  If one collects benefits before their FBA, the benefits are actuarially reduced. The reduction accounts for differing years of collecting benefits and the time value of money.  There is a delayed retirement credit (DRC) for those who wait to collect Social Security after the FBA.
  • 12.
    Program Details  Forbeneficiaries between 62 and 64, there is an earnings test of $11,640, meaning any $1 earnings beyond that point reduces Social Security benefits by 50¢.  This is not exactly a tax, however, because the benefits are returned later with interest.
  • 13.
    Program Details  Spousesof claimants are also entitled to receive benefits. The family’s total benefit would be equal to:  Where SSBEN is the total benefit collected from Social Security, PIA is the primary insurance amount, and the subscripts H and W denote the husband and wife’s PIAs.  For example, a wife with a low level of earnings may have her benefit determined by her husband’s PIA.   SSBEN PIA PIA PIA PIA H W H W   m ax , . , . 1 5 1 5
  • 14.
    How Does SocialSecurity Work Over Time?  How does Social Security work over time?  In contrast to private pension plans, which are funded, Social Security has typically been unfunded.  This means that taxes collected from a current worker go directly to current retirees.  This is referred to as a “Pay-As-You-Go” system.
  • 15.
    How Does SocialSecurity Work Over Time?  There is no guarantee with a pay-as-you-go system that future benefits will be paid out in the way one might expect:  The system could go bankrupt.  Future generations could refuse to pay to finance the system.
  • 16.
    How Does SocialSecurity Work Over Time?  Unlike private pension plans, which are backed by the actual assets of the plan, the promises of Social Security are backed by the policies of the government.  Because of the large fiscal imbalance in Social Security, nearly ¾ of young people today believe that the system will not provide them with significant income in retirement.
  • 17.
    How Does SocialSecurity Work Over Time?  In reality, Social Security is not a completely unfunded system; some of today’s payroll contributions go into the Social Security Trust Fund to help pay for future retirees.  Yet, the trust fund is projected to run out of money by 2042, at which point Social Security becomes a completely unfunded system.  The unfunded nature of Social Security creates redistribution across generations.  See Table 1.
  • 18.
    Table 1 Social Securityin a Two-Period World Period Number of young workers Earnings per young worker Taxes paid per young worker Total taxes paid Number of old retirees Benefits to old retirees Taxes paid by old retirees Rate of return 1 100 $20,000 0 0 0 0 --- --- 2 105 $21,000 $2,100 $220,500 100 $2,205 0 ∞ 3 110 $22,050 $2,205 $242,550 105 $2,310 $2,100 10% 4 115 $23,153 $2,315 $266,225 110 $2,420 $2,205 10% 5 121 $24,310 0 0 115 0 $2,315 -∞ Individuals live for two periods, and then die. They are young in the first period, and old in the second. When they are young, they work and pay a tax to support Social Security. When they are old, the collect Social Security. The population grows over time, in this case by 5% per period. Real wages are assumed to rise at 5% as well, due to increased productivity. There is no Social Security program in year 1. The young do not have to pay Social Security taxes. Social Security is started as an unfunded program in year 2, with a 10% payroll tax on the current young. The taxes collected are $220,500; $2,100 per person x 105 young people. This is divided among the 100 elderly. Because the elderly did not pay into the system, yet they collect benefits, their rate of return is infinite. The initial generation (elderly who did not pay) is the big winner from the unfunded system. In year 3, the elderly are those who were young and paying taxes in year 2. Recall they paid in $2,100 each. They now receive $2,310 in benefits, 10% more than they paid in. This return comes from higher total tax collections due to wage growth and population growth. If population and wage growth are high, the rate of return to “middle generations” can be large. Now imagine that in year 5, the young workers scrap the system. They pay no taxes. The elderly in year 5 (who were young in year 4) suffer as a consequence. They paid into the system but got nothing out of it.
  • 19.
    How Does SocialSecurity Work Over Time?  This example illustrates several points.  The return to “middle generations” depends on the rates of population and wage growth.  Unfunded Social Security carries with it a legacy debt, the debt incurred by the government because early generations received much more in benefits than they paid in taxes.
  • 20.
    How Does SocialSecurity Work Over Time?  The example shows how Social Security redistributes across generations:  The first generation received a large windfall.  The middle generations got a rate of return determined by wage and population growth.  The final generation was the big loser.
  • 21.
    How Does SocialSecurity Redistribute in Practice?  How does Social Security redistribute in practice?  We compute Social Security Wealth (SSW), the expected PDV of Social Security benefits over a person’s lifetime, minus the PDV of payroll taxes.  This involves several steps:  Calculate the entire future stream of benefits that the person expects to receive before he or she dies, accounting for mortality. Use a discount rate to compute PDV of benefits.  Calculate the entire future stream of payroll taxes. Compute the PDV of taxes.  Take the difference between the two to get SSW.  Table 2 shows the results.
  • 22.
    Table 2 Redistribution underSocial Security for a Single Male Earnings Level Retirees turn 65 in 1960 Retirees turn 65 in 1995 Retirees turn 65 in 2030 Low earner $26,100 $12,500 -$4,100 Average earner $36,500 -$5,100 -$56,200 High earner $36,800 -$37,100 -$248,500 Moving across the columns examines successively younger generations. Younger generations have lower SSW than older generations. Moving down the rows looks at higher earners. Higher earners have lower SSW.
  • 23.
    How Does SocialSecurity Redistribute in Practice?  The redistribution to the oldest generation occurs for the kinds of reasons we saw in the previous table.  They did not pay into the system for much of their working lives, but received benefits over their whole retirement.  In addition, not only was there population growth and wage growth, but also growth in the actual payroll tax rate.
  • 24.
    How Does SocialSecurity Redistribute in Practice?  For more recent retirees (the 1995 cohort), Social Security has generally become a losing proposition.  They paid into the system for their entire working lives.  The growth in the payroll tax rate has slowed.  There has been a significant slowdown in wage growth and population growth.
  • 25.
    How Does SocialSecurity Redistribute in Practice?  For future retirees (the 2030 cohort), the outcome is the worst of all.  Payroll taxes are not rising at all.  Wage and population growth are slow.
  • 26.
    How Does SocialSecurity Redistribute in Practice?  In addition, the system has shifted from one that favors the rich in earlier generations to one that favors the poor.  The reason is for this change is that higher-income earners pay more money into the system through payroll taxes; but when the returns to Social Security are low, the higher-income earner has more money of his or her own in an underperforming asset.
  • 27.
    How Does SocialSecurity Redistribute in Practice?  Finally, Social Security redistributes in other ways.  It pays an annuity until death; therefore groups with shorter life expectancies (men, the poor, minorities, smokers) tend to lose under such a system.  It provides survivorship benefits; this redistributes toward married couples relative to single individuals.  It adjusts the benefit level by 50% for married households with a single earner; this redistributes toward single-earner married households.  It generally redistributes from the rich to the poor, even with adjustments for life expectancy.
  • 28.
    CONSUMPTION SMOOTHING BENEFITSOF SOCIAL SECURITY: Rationales for Social Security  On the surface, it is not clear why there is government involvement in Social Security, since retirement is an anticipated event that is largely an individual decision.  There are a number of rationales for government involvement, however.
  • 29.
    Rationales for SocialSecurity  First, there may be market failures in the annuities market that Social Security solves.  This market is subject to adverse selection, where the “high risks” are the ones who live a long time.  Finkelstein and Poterba (2004) find compelling evidence for such adverse selection.
  • 30.
    Rationales for SocialSecurity  Second, paternalism comes into play: policymakers believe that individuals won’t save enough for their own retirement.  In 1991, for example, the median American aged 51- 61 had $107,000 in future Social Security wealth, but only $16,000 in private pension wealth and $3,000 in other personal retirement assets.
  • 31.
    Does Social SecuritySmooth Consumption?  Regardless of the reason, Social Security’s existence is motivated by consumption smoothing.  The question then becomes does it?  The existing evidence shows that it does help smooth consumption.
  • 32.
    Does Social SecuritySmooth Consumption?  The evidence comes in several forms:  Private savings behavior  Consumption at retirement  Living standards of the elderly
  • 33.
    Does Social SecuritySmooth Consumption?  Existing research suggests that each $1 of Social Security wealth crowds out 30¢ to 40¢ of private savings.  This is important, but not full crowd-out.  Assessing the evidence in the U.S. is difficult because Social Security is a nationally uniform program, which makes it difficult to find good treatment and control groups.  Other countries, such as Italy and the U.K., have had changes that lend credence to the magnitude of crowding out.
  • 34.
    Does Social SecuritySmooth Consumption?  Another approach is to look directly at consumption. A model with diminishing marginal utility would imply smooth consumption over time.  Bernheim, Skinner, and Weinberg (2001) found that consumption falls more than 30% when individuals retire.  This finding is consistent with only a partial crowding-out of private savings by the Social Security system.
  • 35.
    Does Social SecuritySmooth Consumption?  A third piece of evidence examines the poverty rates of the elderly.  The poverty rate is defined as:  The number of elderly with income less than the poverty threshold divided by the total number of elderly.  Figure 2 shows the results.
  • 36.
    Elderly Poverty Rateand SS Over Time 0 8 16 24 32 40 1959 1965 1971 1977 1983 1989 1995 2001 Year Pov e rty R a te for 6 5+ (% ) 2.0 2.5 3.0 3.5 4.0 4.5 SS Spe nding (% of GD P) SS Spending Elderly Poverty Rate While Social Security spending has gone up. The fraction of elderly living in poverty has fallen dramatically over time. Figure 2
  • 37.
    Does Social SecuritySmooth Consumption?  The decline in poverty rates for the elderly during the 1960s and 1970s coincided with the time when the Social Security program grew the fastest.  Engelhardt and Gruber (2004) analyze how poverty fell for birth cohorts that benefited from expansion in Social Security, relative to those that did not, and conclude that Social Security can explain the entire time trend reduction in poverty among the elderly over this period.
  • 38.
    SOCIAL SECURITY ANDRETIREMENT: Theory  The design of Social Security naturally leads to the issue of whether it encourages early retirement.  Social Security may encourage early retirement through:  Implicit taxation, acting as a “substitution effect.”  Redistribution, acting as an “income effect.”
  • 39.
    Theory  The “implicittax” takes account of the fact that a worker at the early entitlement age can choose to work another year.  If so, SSW changes because:  One more year of payroll taxes is paid.  One year of Social Security benefits is given up.  The benefit level goes up because of actuarial adjustment.  The year of work usually replaces a low earnings year with a high earnings year.  Higher implicit taxes should lead to earlier retirement.  The redistributive effects were discussed early, and act as an income effect.
  • 40.
    Evidence  There arethree sources of evidence that suggest Social Security encourages retirement:  Time series evidence  The retirement hazard rate  International comparisons
  • 41.
    Evidence  Figure 3illustrates time series evidence. It shows the labor force participation of males, plotted against Social Security spending.  The time series for females is clouded by the general upward trend in female labor force participation since World War II.
  • 42.
    Figure 3 Elderly LaborForce Participation and SS Over Time 10 12 14 16 18 20 22 1959 1965 1971 1977 1983 1989 1995 2001 Year Labor Force Participation Rate (% of 65+ in labor force) 1.5 2.0 2.5 3.0 3.5 4.0 4.5 SS Spending (% of GDP) SS Spending Labor Force Participation While Social Security spending has gone up. The fraction of elderly men who are working has fallen dramatically.
  • 43.
    Evidence  The secondpiece of evidence comes from examining the age pattern at retirement.  The retirement hazard rate is the percentage of working people who retire at a given age.  Figure 4 shows the results.
  • 44.
    0 0.05 0.10 0.15 0.20 0.25 Age Retirement Hazard Rate SS EEA SS FBA 5560 65 70 62 The hazard rate again spikes at 65, the FBA. The hazard rate falls at ages 63 and 64. The hazard rate is less than 10% through age 61. The hazard rate spikes up at age 62, which is also the early entitlement age. Figure 4
  • 45.
    Evidence  The hazardrates in Figure 4 are suggestive, but not necessarily conclusive about the impact of Social Security.  Figure 5 shows similar hazard rates in 1960 (before the EEA), 1970, and 1980.
  • 46.
    Retirement Hazard Rate 0 0.05 0.10 0.15 0.20 0 0.05 0.10 0.15 0.20 0 0.05 0.10 0.15 0.20 Age 55 65 70 1960 1970 1980 62 SSEEA SS FBA There was no spike in the hazard rate in 1960, before the EEA was introduced. The spike grew slowly over time, after the EEA was introduced. Figure 5
  • 47.
    Evidence  A thirdtype of evidence, and perhaps most compelling, is to make international comparisons.  There are spikes in other countries too, at the EEA and FBA, even when those ages differ from that in the United States.  Figure 6 shows retirement patterns in France.
  • 48.
    50 55 6065 70 0 0.1 Retirement Hazard Rate Age -0.1 0.2 0.3 0.4 0.5 0.6 0.7 SS EEA & FBA There is an enormous spike in the hazard rate in France at age 60, which is both the EEA and FBA. 60% of those working when they turn 60 retire during the next year. Moreover, when the “age 60” retirement age was not an option in France, the hazard rate was 10%. Figure 6
  • 49.
    Evidence  Figure 7shows evidence from Germany, which lowered its retirement age in the early 1970s.
  • 50.
    58 59 60 61 62 63 64 1968 1972 19761980 1984 1988 1992 EEA Introduced in 1973 Year Mean Retirement Age Germany lowered the early retirement age from 65 to 60 in 1973. Within 7 years, the average age at which individuals retire had fallen from 63 to 58. Figure 7
  • 51.
    Implicit Social Security taxesand retirement behavior  Finally, Gruber and Wise (1999) present data from a series of counties on the implicit tax rates from Social Security and the decision not to work.  The results show a strong positive relationship between retirement rates and tax rates.  Figure 8 shows their results. Application
  • 52.
    Figure 8 20 -0.5 00.5 1.0 1.5 2.0 2.5 30 40 50 60 70 Disincentive to work Nonworking Elderly R2 = 0.82 Japan US Canada Sweden Spain UK France Germany Belgium Italy Netherlands In nations like the United States, Sweden, and especially Japan, there is little implicit tax. These countries also have higher percentages of elderly working. Other countries, like the Netherlands, Belgium, France, and Italy, have high taxes. They also have lower percentages of elderly working. The horizontal axis measures the “implicit tax” to working at older ages. For example, the measure takes into account the extra payroll taxes paid by working another year. It also takes into account any upward adjustments to benefit levels for delaying retirement. And it accounts for the fact that average earnings tend to be higher by delaying retirement.
  • 53.
    Implicit Social Security taxesand retirement behavior  In summary, the evidence suggests that Social Security systems that penalize work beyond the retirement age have led to increased retirements. Application
  • 54.
    SOCIAL SECURITY REFORM The Social Security system, in its current form, is unsustainable.  The number of elderly that need to be supported by workers continues to grow over time.  See Figure 9.
  • 55.
    Ratio of Elderlyto Working Age Population 0 5 10 15 20 25 30 35 40 1950 1960 1970 1980 1990 2000 2010 2020 2030 2040 2050 Year Number of elderly per 100 working age people The number of elderly, relative to workers, has grown over time. By 2025, there will be a larger share of elderly in the U.S. than there are in Florida currently. Figure 9
  • 56.
    SOCIAL SECURITY REFORM Also, over the next 75 years, the PDV of the program’s obligations exceed the PDV of the taxes it will collect by $3.7 trillion.  Three factors cause this imbalance:  Improvements in life expectancy  A reduction in birth rates  The growth in wages has slowed dramatically.
  • 57.
    Reform Round I:The Greenspan Commission  With impending financial problems, the Greenspan Commission in 1983 recommended a number of changes that took place:  Speeding up increases in the payroll tax.  Cutting benefits.  These policy changes staved off Social Security’s financing problems to some extent, but did not solve them.
  • 58.
    Incremental Reforms  Thereare a number of approaches that build on the current system:  Raise payroll taxes further: An increase from 12.4% to 14.3% solves financing problems for the next 75 years; raising it to 15.9% solves it forever.  Extend the base of taxable wages: Some workers are not covered by Social Security, and would represent a net gain in the financial position of the program.  Raise the retirement age: The FBA has not moved up in lock-step with life expectancy.
  • 59.
    Incremental Reforms  Lowerbenefits: Lower rates at which the AIME is translated into the PIA. Alternatively, the government could adjust the indexation rate.  Means-test the program: Another possibility would be to tax benefits for higher income households.
  • 60.
    Fundamental Reforms  Inaddition to the “incremental reforms” discussed, there are some more fundamental reforms that have been posed as a solution to Social Security’s financial imbalance:  Invest the trust fund in stocks  Privatization
  • 61.
    Fundamental Reforms  Investingthe trust fund in stocks–100% of the assets of the Social Security Trust Fund are held in bonds.  A slow investment of the trust fund in the stock market could lead to a higher rate of return and cover half of the projected 75-year deficit.  This runs into the problem that politicians may simply take these higher returns and use them for government spending.  Also, there is concern the government might abuse its position to manipulate capital markets for its own good.
  • 62.
    Fundamental Reforms  Amore radical alternative is privatization–allowing individuals to invest their payroll taxes in various assets through individually controlled accounts.  The capital would then truly be “off-budget” to politicians, unlike the Social Security Trust Fund.  It would also respect consumer sovereignty with respect to investment decisions.
  • 63.
    Fundamental Reforms  Thetransition to such a system is the most difficult problem–how do we let individuals save money for their own retirement, while at the same time supporting the existing generation of retirees?  Once the need to pay back this legacy debt is accounted for, a privatized Social Security system would not provide a higher rate of return.
  • 64.
    Fundamental Reforms  Sucha privatized system could also have higher administrative costs; the current system’s costs are only 0.19% of the program’s asset balances.  For example, the administrative costs of the U.K. and Chile, two countries with privatized systems, are more than 100 basis points higher, which over the course of many years substantially lowers wealth levels.
  • 65.
    Fundamental Reforms  Afinal issue with privatization is that policy makers may not want to respect consumer sovereignty with respect to retirement savings.  In private 401(k) accounts, for example, company stock makes up 1/6th of aggregate assets. This option almost never makes sense.
  • 66.
    Recap of SocialSecurity  What is Social Security and how does it work?  Consumption smoothing benefits of Social Security  Social Security and Retirement  Social Security Reform