Season 4 [Free OpManager training] Part5 - Network Maps, Reports & Best Practices
•
1 like•101 views

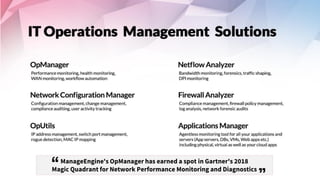
ManageEngine's OpManager network monitoring software has been recognized in Gartner's 2018 Magic Quadrant for Network Performance Monitoring and Diagnostics. This document outlines an OpManager training session that covered topics like network mapping, dashboard customization, network reports, mobile apps, and best practices. The agenda included discussions on layer 2 maps, business views, Google maps integration, building racks/floor views, dashboards, the NOC view, standard and customized reports, and data archiving best practices.

Recommended
Recommended
More Related Content
Similar to Season 4 [Free OpManager training] Part5 - Network Maps, Reports & Best Practices
Similar to Season 4 [Free OpManager training] Part5 - Network Maps, Reports & Best Practices (20)
More from ManageEngine, Zoho Corporation
More from ManageEngine, Zoho Corporation (20)
Recently uploaded
Recently uploaded (20)
Season 4 [Free OpManager training] Part5 - Network Maps, Reports & Best Practices
- 1. ManageEngine's OpManager has earned a spot in Gartner's 2018 Magic Quadrant for Network Performance Monitoring and Diagnostics
- 2. Can you hear me? Can you see the presentation? Please confirm by commenting in the webinar chat panel
- 3. Welcome to a free OpManager training session
- 4. Trainer Suresh Bagavathy Evangelist for ManageEngine's ITOM suite 10 years' experience
- 5. Training schedule Week Module Date Schedule Status 1st Discovery and classification May 2nd 11:30am EDT Completed 2nd Server performance monitoring May 9th 11:30am EDT Completed 3rd Network performance monitoring May 16th 11:30am EDT Completed 4th Effective fault management and IT automation May 23rd 11:30am EDT Completed 5th Network maps; reports and best practices May 30th 11:30am EDT In progress www.opmanager.com/training.html
- 6. Week 5 Network maps; reports; and best practices
- 7. Agenda Network maps Network management Network reports Mobile apps Best practice
- 8. Network Maps
- 9. • Know how the devices are interconnected with each other • Keep the map up-to-date by scanning it periodically • Import the devices to monitor the performance #1 Layer 2 maps
- 10. #2 Business views • Group devices based on geographical site or department or business service • Add link between devices and monitor the link connectivity • Add shortcuts in a business view for branch offices • Restrict user access based on business view groups
- 11. 1. Download the zip file from the link below and save it to your desktop (http://www.manageengine.com/network-monitoring/GMaps_12300.zip) 2. Extract the downloaded zip and open maps.html file in any script editor 3. Visit the following page and generate the google API key (https://developers.google.com/maps/documentation/javascript/get-api-key) 4. Update the Google API key as shown below and save the file o <script type='text/javascript' src='//maps.googleapis.com/maps/api/js?sensor=false&language=en&key=YOUR_API_KEY'></script> 5. Upload the updated maps.html #3 Google maps
- 13. #5 Building 3D floor view
- 15. • Customizing dashboard #1 Dashboards and widgets • Widget : Embed OpManager widgets into other web pages 1. Total network traffic across all servers 2. Devices which are using high % of their CPU and Memory 3. All active alarms 4. Downtime report for all devices and services 5. IT summary
- 16. #2 Noc view
- 17. Network reports
- 18. • Standard reports • Customized reports • Generating reports from Inventory page • Converting reports into a widget Network reports 1. Threshold details report 2. Notification profile assigned report 3. Audit report 4. Inventory report Examples
- 19. Mobile apps
- 20. iOS Android
- 21. Best practice
- 22. Best practice 1. Bulk configuration Settings > Configuration > Quick configuration wizard 2. Monthly web server maintenance Settings > Configuration > Downtime schedules 3. Customize data archiving settings Settings > Basic settings > Database maintenance 4. Limiting transaction logs (MSSQL) https://pitstop.manageengine.com/portal/kb/articles/mssql-transaction-logs-full 5. Backup & restore 6. Self monitoring Settings > Basic settings > Self monitoring
- 23. youtube.com/opmanagertechvideos help.opmanager.com opmanager-support@manageengine.com +1 888 720 9500 / +1 408 916 9400 Need more help? forums.manageengine.com/opmanager
- 24. Gartner Magic Quadrant - 2018
- 25. Questions?