
Download to read offline

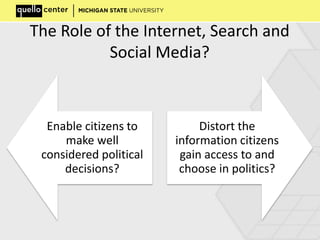
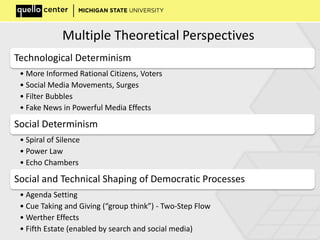
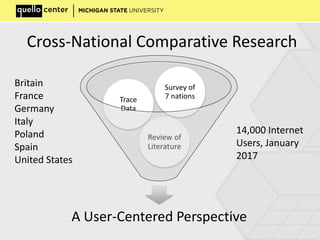
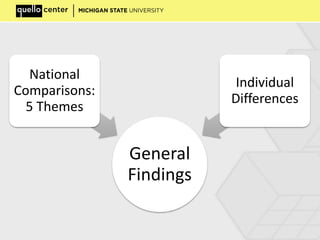
The document discusses the impact of fake news, filter bubbles, and echo chambers on political opinion and democratic processes, emphasizing the central role of search engines and social media in shaping information access. It presents findings from a study involving 14,000 internet users across seven nations, revealing diverse information-seeking behaviors and the perceived reliability of various news sources. Key themes include the importance of checking information, the frequency of encountering differing viewpoints, and the need for digital literacy to mitigate misinformation risks.


