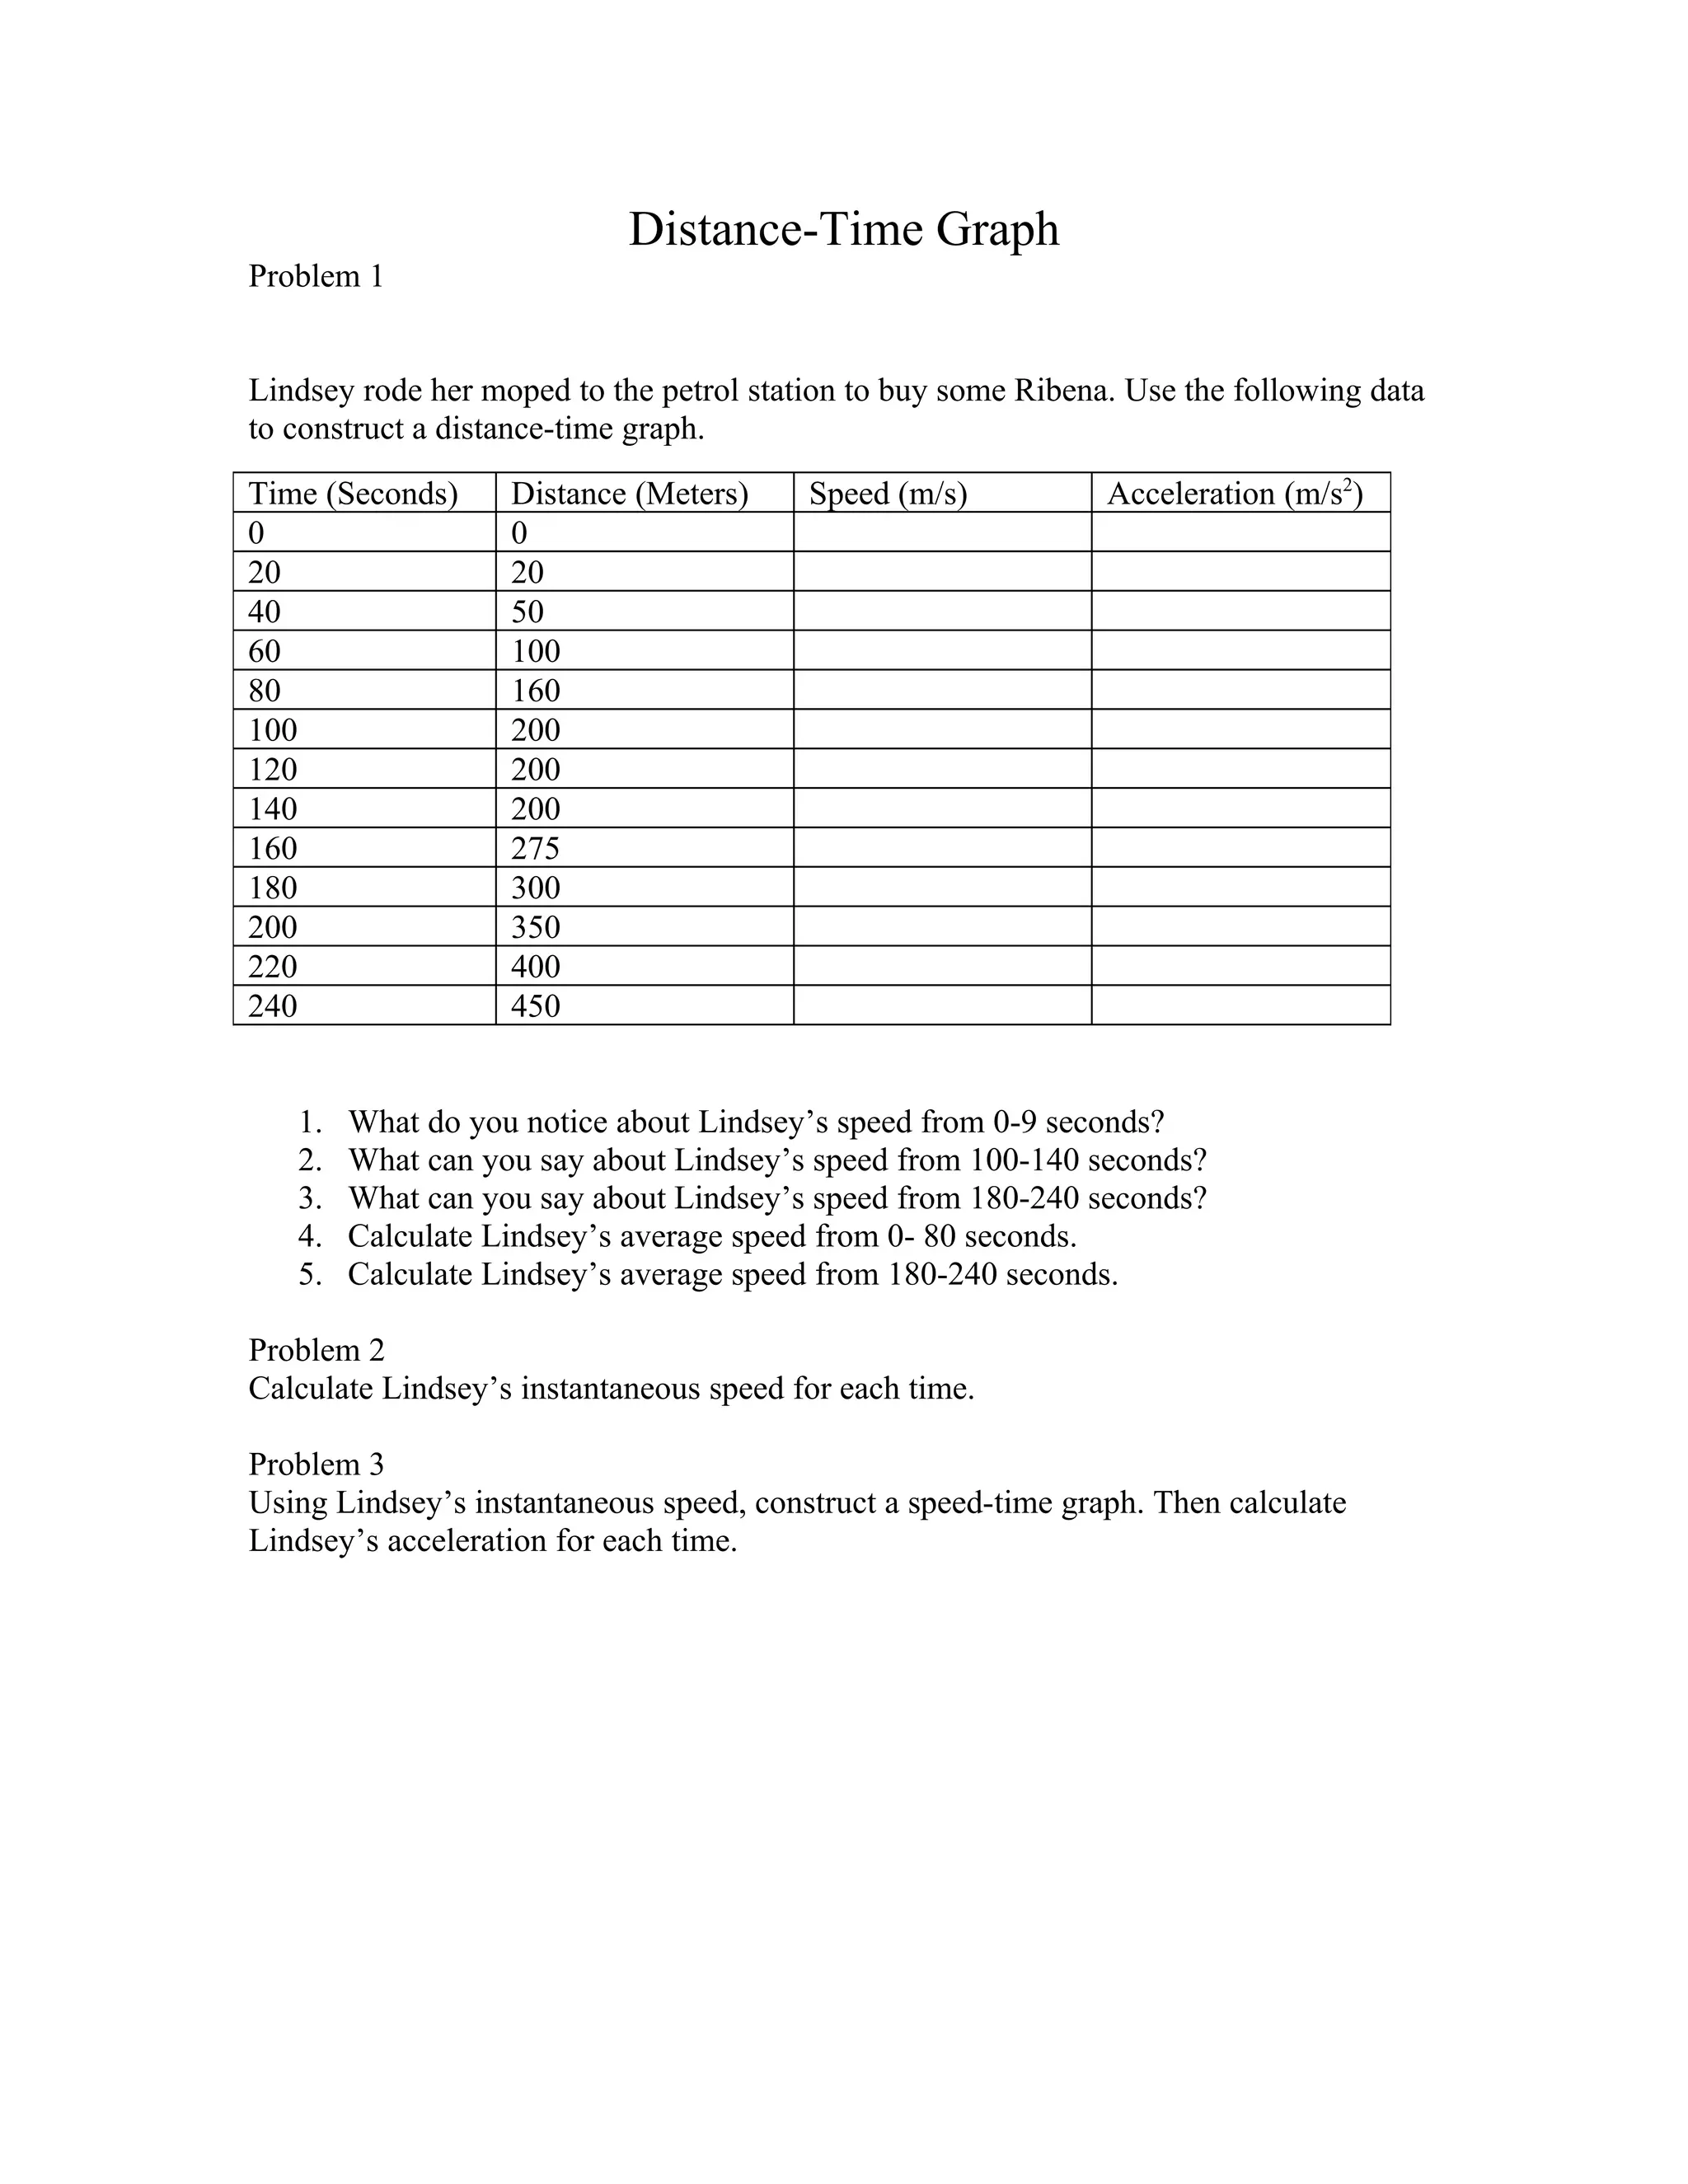
Lindsey rode her moped to the store and her distance and time were recorded. The data shows her distance increased linearly from 0 to 20 seconds, indicating she traveled at a constant speed. From 100 to 140 seconds her distance remained constant at 200 meters, meaning her speed was zero. From 180 to 240 seconds her distance increased linearly again, suggesting constant speed. The graph and calculations would show Lindsey's changing speed and acceleration over time based on the distance and time data collected.