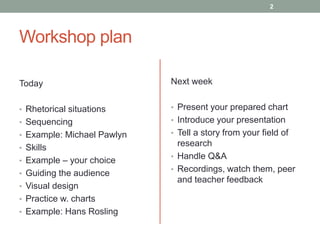
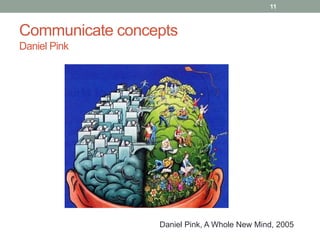
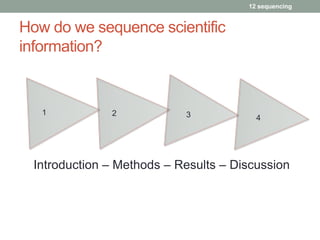
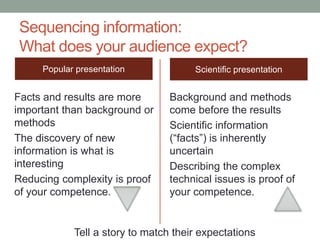
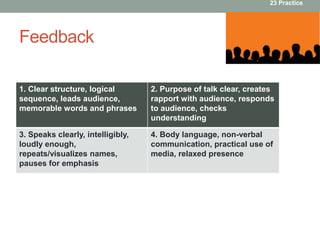
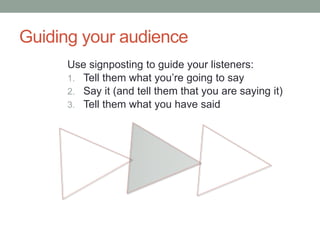
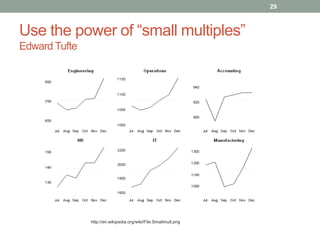
This document provides an overview of a workshop on presenting science to peers. It discusses rhetorical situations, sequencing information logically, and using stories and examples from research. It emphasizes skills like guiding the audience and using visual design principles. Specific techniques are exemplified, like Hans Rosling's use of "small multiples" to efficiently convey trends in data. Participants will practice summarizing research, visualizing findings, and telling stories from their own fields. Feedback will be provided on presentation skills.
1. PRESENTING SCIENCE
TO YOUR PEERS
FHI 14 October 2014
Anne Hodgson anne.hodgson@t-online.de
2. Today
• Rhetorical situations
• Sequencing
• Example: Michael Pawlyn
• Skills
• Example – your choice
• Guiding the audience
• Visual design
• Practice w. charts
• Example: Hans Rosling
Next week
2
• Present your prepared chart
• Introduce your presentation
• Tell a story from your field of
research
• Handle Q&A
• Recordings, watch them, peer
and teacher feedback
Workshop plan
6. 6 Rhetorical situations
What causes you anxiety? Why?
• Introducing yourself to a group
• Introducing someone else
• Presenting research to professors for assessment
• Interrupting a lecturer
• Asking a question in Q&A
• Teaching non-experts or younger students
• Pitching: Selling your concept to sponsors
8. Stories about research
8
Michael Pawlyn
Eden Project bubble dome, biomimicry specialist
TED Salon 2010:
Using nature’s genius in architecture
Watch the first minutes and answer:
• What examples does he begin with?
• What details does he highlight? Why?
• How does he follow up to lead into his presentation?
9. 9 Sequencing
Michael Pawlyn:
Using nature’s genius in architecture
http://youtu.be/3QZp6smeSQA
12. How do we sequence scientific
information?
12 sequencing
1
3 4 2
Introduction – Methods – Results – Discussion
13. Sequencing information:
What does your audience expect?
Scientific presentation
Background and methods
come before the results
Scientific information
(“facts”) is inherently
uncertain
Describing the complex
technical issues is proof of
your competence.
Popular presentation
Facts and results are more
important than background or
methods
The discovery of new
information is what is
interesting
Reducing complexity is proof
of your competence.
13 Tell a story to match their expectations
16. Story cycles
Robert McKee
1. Build tension:
the problem
2. Provide release:
the solution
3. Celebrate the release
the results
4. Repeat
16
17. 17 Skills
The communication funnel
What you plan to say
What you actually say
What they really hear
What they understand
What they remember
18. 18
Fill the funnel wisely
We remember:
• words at the beginning and end
• repeated words and phrases
• contextually unusual words
We are influenced by:
• consistently scientific facts and methods
• authentic authority and charisma
• our shared common sense
19. Telling a story about research
19
Watch a presenter on TED (ca. 18 minutes)
• What areas does he/she explore in the presentation?
• What makes them relevant?
• What is his/her perspective?
• What specific questions does he/she ask?
• What are his/her findings?
• Note down examples.
• How is all of this relevant?
20. Your choice
20
Watch a presenter on TED (ca. 18 minutes)
• Ralf Dunbar, geoscientist: Discovering ancient climates in
oceans and ice
• Michel Laberge, plasma physicist: How synchronized
hammer strikes could generate nuclear fusion
• Angela Belcher, head of the Biomolecular Materials Group
at MIT: Using nature to grow batteries
• Jonathan Trent, nanotechnologist at NASA: Energy from
floating algae pods
21. Storytelling: Summarize research
21
• What (often: three) areas does the speaker explore?
• Why are they relevant?
• What approach/ perspective does he/she take?
• What are his/her specific questions?
• What are his/her findings in general?
• Can you give an example?
• How is this relevant?
23. Feedback
23 Practice
1. Clear structure, logical
sequence, leads audience,
memorable words and phrases
2. Purpose of talk clear, creates
rapport with audience, responds
to audience, checks
understanding
3. Speaks clearly, intelligibly,
loudly enough,
repeats/visualizes names,
pauses for emphasis
4. Body language, non-verbal
communication, practical use of
media, relaxed presence
24. Guiding your audience
Use signposting to guide your listeners:
1. Tell them what you’re going to say
2. Say it (and tell them that you are saying it)
3. Tell them what you have said
24
25. Signpost in the introduction
25 Practice
Ok, let‘s get started
Morning, everyone
Today I‘m going to tell you about...
What I want to do today is...
We‘re going to look at...
As you know,...
So I‘ll begin by outlining....
First I‘ll give you an overview of...
And then I‘ll go on to highlight...
After that we‘ll discuss/ look at...
Finally we‘ll explore the question of
whether...
The talk will take about...
I‘ll be happy to answer your questions at the end OR anytime during my talk.
26. Signal during the presentation
To move on To turn to To go back
To expand on To elaborate on To digress for a
moment
To summarize To recap To conclude
26 Practice
What do you say if you want
to go into more depth?
to follow a tangent?
to move to a different part?
to review?
to end?
“Let me just expand on that”; “To elaborate on that,”
“To digress for a moment,…”
“To turn to…”; “Now let’s move on (to…)”;
“To go back to what I was saying earlier”
“Let me recap:…”; “So, to summarize”
“To conclude, …”
27. Visual design
27
Visual
Story
Delivery
Presentation
Ecosystem
context
theme
structure
stories
words to pictures
fonts, colors…
graphic design
interact
adjust pace
switch to board
handouts
eye flow
Message
28. 28
Reduce cognitive load
We process
only 120-150
words per minute
Use information-rich
images
instead
29. Use the power of “small multiples”
Edward Tufte
29
http://en.wikipedia.org/wiki/File:Smallmult.png
30. Back up all assertions with visual evidence
Michael Alley
30
Michael Alley
The Craft of Scientific Presentations
Springer 2003
Rethinking the Design of Powerpoint Slides
http://www.writing.engr.psu.edu/slides.html
31. 31
KISS
Headline 44 pt
Caption at least 16 pt
Use sans serif font
Show one or contrast 2 images
Label legibly
Acknowledge sources in 10 pt
Source: The Oceanographic Society
Scientifically Speaking. 2005.
http://www.tos.org/pdfs/sci_speaking.pdf
32. Practice referring to visuals
32
Have a look at...
You may notice that...
As you can see from...
I‘d like to draw your attention to one or two interesting details here.
What you can tell when you compare the two is that...
You‘ll notice that...
Take a closer look and you will see that...
And down here you‘ll see...
It seems quite clear from this that...
The x-axis shows…
If you compare the two you will see that…
34. 34
Conveying meaning
Hans Rosling: 200 countries, 200 years, 4 minutes
http://www.youtube.com/watch?v=jbkSRLYSojo
35. How does Hans Rosling do it?
1. How many points of reference
on the axes?
2. What are his variables?
3. Does he introduce and
describe each variable?
4. How does he help us process
the information?
5. How does he reinforce the
graphic?
6. How does he link the past and
the future?
7. What does he explain verbally?
35
36. How does Hans Rosling do it?
1. How many points of reference
on the axes?
2. What are his variables?
3. Does he introduce and
describe each variable?
4. How does he help us process
the information?
5. How does he reinforce the
graphic?
6. How does he link the past and
the future?
7. What does he explain verbally?
36
Six points
country, life expectancy, income,
population, and time
yes
takes 'snapshots' of the data
body language 'mirrors' the graphic
summarizes findings, shows trends
lets the data 'speak' for itself,
explains the causes and effects
37. Task: Visualize a key assertion
Consider:
• Your audience and situation/ media?
• Scientific objective/problem, method of solution?
• Findings: Assertion, evidence/ chart?
• Example/ story?
To do:
• Design a slide
• Prepare an introduction
• Tell a story about the research
37
38. Tell a story from a field of research
• What area does your paper explore?
• What makes this relevant?
• What is the chosen perspective and method?
• What specific questions do the authors ask?
• What are their findings?
• Note down examples and points for discussion.
• How is all of this relevant?
38
39. Literature
Scientific Communication
• Abela, Andrew (2008). Advanced presentations by design: Creating communication that drives action. San
Francisco, CA: Pfeiffer; http://www.extremepresentation.com/
• Alley, Michael (2013/2) The Craft of Scientific Presentations. Springer.
• Duarte, Nancy (2010) resonate: Present Visual Stories that Transform Audiences. Wiley.
• Duarte, Nancy (2008) slide:ology: The Art and Science of Creating Great Presentations. O'Reilly Media.
• McKee, Robert & Fryer, Bronwyn (2003) Storytelling That Moves People. Harvard Business Review June. Reprint
R0306B http://hbr.org/2003/06/storytelling-that-moves-people/
• Reynolds, Garr (2011, 2nd edition) Presentation Zen. Simple Ideas on Presentation Design and Delivery. New
Riders; http://www.presentationzen.com/presentationzen/
• Reynolds, Garr (2011) The Naked Presenter: Delivering Powerful Presentations With or Without Slides. New Riders.
• Tufte, Edward (2001, 2nd edition) The Visual Display of Quantitative Information. Graphics Press.
Improve your academic English
• McCarthy, Michael/ O’Dell, Felicity (2008) Academic Vocabulary in Use. Cambridge University Press.
• Academic English Online http://aeo.sllf.qmul.ac.uk/index.html/
• Andy Gillett’s Using English for Academic Purposes (UEFAP): http://www.uefap.com/
• Purdue Online Writing Lab (OWL) http://owl.english.purdue.edu/owl/section/1/2/
• Monah University Writing in Science: http://www.monash.edu.au/lls/llonline/writing/science/index.xml
• MacMillan Dictionary http://www.macmillandictionary.com/
• Open corpora: https://the.sketchengine.co.uk/open/
• Just the word http://www.just-the-word.com/
• Netspeak http://www.netspeak.org/
39
Editor's Notes
Performance
to impress
judgment
monologue
pre-written, read out
long clauses
acting / learn by heart
Literacy
Communication
to inform, persuade, entertain
pragmatic + social objectives
dialogue / interactive
pre-structured, spoken
short clauses
outline / keywords
Orality
Shifting to communication can overcome anxiety
Interact and engage
observe audience reactions to your approach
answer audience questions
focus audience attention
present multidimensional data you couldn’t otherwise
introduce information to a new target group
At TEDSalon in London, Michael Pawlyn describes three habits of nature that could transform architecture and society: radical resource efficiency, closed loops, and drawing energy from the sun.
Examples?
Details? Why?
Follow-up and bridge to 3-point structure: