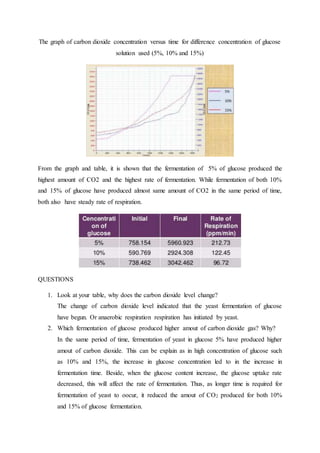
FACULTY OF SCIENCE AND MATHEMATICS
AT 11- IJAZAH SARJANA MUDA PENDIDIKAN
BIOLOGI DENGAN KEPUJIAN
SBI 3013:
INFORMATION AND COMMUNICATION
TECHNOLOGY IN BIOLOGY
ASSIGNMENT 2:
DATA LOGGER: ANAEROBIC RESPIRATION
(FERMENTATION)
LECTURER: ENCIK AZMI BIN IBRAHIM
NAME MATRIC NO.
NUR SYAFIDAH BINTI JOHAN D20162076163
NURSYAKIKA BINTI HASAN D20162076164
AZILAH BINTI HASAN D20162076165
LEC. GROUP :
GROUP A
CONTENT
NO. DESCRIPTION PAGES
1 INTRODUCTION
2 ENGAGE, EMPOWER, AND ENHANCE
3 ADVANTAGES AND DISADVANTAGES
4 CONCLUSION
5 REFERENCES
INTRODUCTION
A data logger, is an electronic instrument that records measurements at set intervals
over a period of time. Depending on the particular data logger, measurements can include: air
temperature, relative humidity, AC/DC current and voltage, differential pressure, time-of-use
(lights, motors, etc.), light intensity, water temperature, water level, dissolved oxygen, soil
moisture, rainfall, wind speed and direction, leaf wetness, pulse signals, room occupancy,
plug load, and many more.
Data loggers are typically compact, battery-powered devices equipped with an internal
microprocessor, data storage, and one or more sensors. They can be deployed indoors,
outdoors, and underwater, and can record data for up to months at a time, unattended. A data
logger may be a single-unit, stand-alone device with internal sensors, which fits in the palm of
a hand, or it may be a multi-channel data collection instrument equipped with one or more
external sensors.
How does a data logger work?. First, the data logger is connected to a computer via a
USB interface. Next, accompanying data logger software is used to select logging parameters
(sampling intervals, start time, etc.) and activate the logger. The logger is then disconnected
and deployed in the desired location, where it records each measurement and stores it in
memory along with the time and date. Bluetooth Smart loggers can be configured and
launched wirelessly, after deployment.
After the desired monitoring period, the data logger is then reconnected to the
computer and the software is used again to read out the data and display the measurements in
graphs that show profiles over time. Tabular data can be viewed as well, or exported to a
spreadsheet for further manipulation.
In the case of web-based data logging systems, data are pushed to the Internet for
access; with wireless data nodes, data are transmitted to a central receiver; and with Bluetooth
Smart loggers, data are downloaded directly to your mobile device.
Data loggers are used in a broad range of indoor, outdoor, underwater and temperature-
controlled environments – essentially anywhere data is needed and the convenience of battery
power is preferred.
The four main types of data loggers are: stand-alone data loggers, web-based data
logging systems, wireless data nodes, and Bluetooth Low Energy (BLE) data loggers.
Stand-alone USB data loggers are compact, reusable, and portable, and offer low cost
and easy setup and deployment. Internal-sensor models are used for monitoring at the logger
location, while external-sensor models (with flexible input channels for a range of external
sensors) can be used for monitoring at some distance from the logger. Most stand-alone
loggers communicate with a computer via a USB interface. For greater convenience, a data
shuttle device can be used to offload data from the logger for transport back to a computer.
Web-based data logging systems enable remote, around-the-clock Internet-based
access to data via GSM cellular, WI-FI, or Ethernet communications. These systems can be
configured with a variety of external plug-in sensors and transmit collected data to a secure
web server for accessing the data.
Wireless data nodes transmit real-time data from dozens of points to a central
computer, eliminating the need to manually retrieve and offload data from individual data
loggers.
Bluetooth Low Energy data loggers measure and transmit data wirelessly to mobile
devices over a 100-foot range
ENGAGE, EMPOWER, AND ENHANCE
ANAEROBIC RESPIRATION (FERMENTATION)
Anaerobic respiration occurs in condition of limited oxygen supply or in absence of
oxygen. In absence of oxygen, yeast will undergo anaerobic respiration. Yeast converts
glucose into ethanol and carbon dioxide. So the carbon dioxide given out reflect the rate of
anaerobic respiration. Glucose was fermented because this sugar can pass rapidly into the cell
and enter directly into metabolic pathways.
š¶6 š»12 š‘‚6 2š¶2 š»5 š‘‚š» + 2š¶š‘‚2 + 2ATP
ENGAGE (SET INDUCTION)
In this experiment, our problem statement is as stated as below:
1. What are the important ingredient do you need to make a bun?
2. What makes the dough expand and becomes bigger?
3. How to control the bun expand and becomes bigger in the shortest time?
EMPOWER (CARRIED OUT AN EXPERIMENT)
An experiment was been carried out by using carbon dioxide sensor to detect the
carbon dioxide release by the yeast during fermentation. Different concentration of glucose
was used to observed the difference in carbon dioxide concentration collected. Data logger
will collect time data and plot a graph.
PROCEDURE:
1. Measure 4 grams of yeast by the electronic balance.
2. Prepare 3 different concentration of glucose solutions which are 5%, 10% and 15%.
3. Boil all the glucose solutions under the Bunsen flame to evaporate any dissolve
oxygen in the solution.
4. Cool down the glucose solutions by the ice to prevent the heat produce killed the yeast
during the fermentation.
5. Connect the carbon dioxide sensor with the data logger.
6. Mix the glucose solutions with the yeast in the reagent bottle under the water bath with
temperature 30 š‘œ
š¶ .
7. Add a layer of oil on the top of the solutions to prevent gas trap on the solution.
8. Seal the carbon dioxide sensor to the reagent bottle of the mixed solution.
9. Put the reagent bottle under the water bath for 10 minutes.
10. Record the amount of carbon dioxide at each 10 second interval.
11. Step 4 to 11 repeated but the concentration of glucose solution is changed to 10% and
15% respectively.
RESULT
Table of production of carbon dioxide gas of fermentation of different concentration of
glucose solution.
The graph of carbon dioxide concentration versus time for difference concentration of glucose
solution used (5%, 10% and 15%)
From the graph and table, it is shown that the fermentation of 5% of glucose produced the
highest amount of CO2 and the highest rate of fermentation. While fermentation of both 10%
and 15% of glucose have produced almost same amount of CO2 in the same period of time,
both also have steady rate of respiration.
QUESTIONS
1. Look at your table, why does the carbon dioxide level change?
The change of carbon dioxide level indicated that the yeast fermentation of glucose
have begun. Or anaerobic respiration respiration has initiated by yeast.
2. Which fermentation of glucose produced higher amout of carbon dioxide gas? Why?
In the same period of time, fermentation of yeast in glucose 5% have produced higher
amout of carbon dioxide. This can be explain as in high concentration of glucose such
as 10% and 15%, the increase in glucose concentration led to in the increase in
fermentation time. Beside, when the glucose content increase, the glucose uptake rate
decreased, this will affect the rate of fermentation. Thus, as longer time is required for
fermentation of yeast to oocur, it reduced the amout of CO2 produced for both 10%
and 15% of glucose fermentation.
3. What does the graph tell you about the change in carbon dioxide level during
fermentation.
Fermentation of different concentration of glucose will have differet rate of
fermentation and different amount of end product in fixed time.
4. What is the end product of fermentation? State the equation of yeast fermentation.
Ethanol, carbon dioxide and energy. š¶6 š»12 š‘‚6 2š¶2 š»5 š‘‚š» + 2š¶š‘‚2 + 2ATP
DISCUSSION
1. The fermentation of glucose, which occurs primarily when the glucose concentration
is high or when oxygen is not avaible.
2. The cells have a low energy yield of only about 2 ATP per mole of glucose
metabolized. The stoichiometry of this reaction is
š¶6 š»12 š‘‚6 2š¶2 š»5 š‘‚š» + 2š¶š‘‚2 + 2ATP
Where represents chemical energy utilized in the growth processes.
3. The influence of difference glucose concentration on metabolic activities of yeast was
evaluated by the overall amout of CO2 and rate of reaction.
4. In high concentration of glucose such as 10% and 15%, the increase in glucose
concentration led to in the oncrease in fermentation time.
5. Besides, when the glucose content increased, the glucose uptake rate decreased, this
will affect the rate of fermentation.
6. Thus, as longer time is required foe fermentation of yeast to occur, it have reduced the
amout of CO2 produced for both 10% and 15% of glucose fermentation.
7. Conversely, for the same reason which mentioned above, fermentation of 5% glucose
have produced the higher amount of CO2 and with the higest rate of fermentation.
ENHANCE (QUESTIONING)
In the production of ftuit wine , most fruits have natural sugar in them and without adding
extra sugar, these can be turned into a wine of about 4% to 6% volume alcohol. This is a low
alcohol content. How high alcohol content of fruit wine is produced? To make a stronger wine
about 12% - 17% sugar is needed to bring the alcohol content up to level high enough. The
increase in glucose concentration led to in the increase in fermentation time. Besides, when
the glucose content increased, the glucose uptake rate decreased, this will affect the rate of
fermentation process, resulting in higher amount of by produces in times, thus producing fruit
wine with alcohol content.
Figure of example wine product from fruit
UNIQUE FEATURE OF THIS ACTIVITY
1. Amount of carbon dioxide produced can be detected and measured accurately. We can
measured in every 10 seconds and the data can be recorded up to three decimal places.
2. Less work need to be done by the students. For example, student do not need to be with
the experiment all the tie as the result will be recorded automatically during that period of
time.
3. The pattern of amount of CO2 production changes can be observe along with the
experiment.
4. The change of the data in table and graph can be observed immediately, allowing us to
halt and repeat the experiment easily.
ADVANTAGES AND DISADVANTAGES
Advantages of data logging that data logging can be used in remote or dangerous
situations. Data logging also can be carried out 24 hours a day, 365 days of the year. Time
interval for collecting data can be very frequent and regular, for example, hundreds of
measurements per second. Data logging can be set up to start at a time in the future and there
no need to have a person present.
Data logging is often more accurate because there is no likelihood of human error.
Measurements are always taken at the right time. Unlike a human the computer will not forget
to take a reading or take a reading too late or too early. Mistakes are not made in reading the
results. Humans can make errors. For example it is quite easy to misread the temperature
using the scale on a thermometer. Data logging devices can be sent to places that humans
cannot easily get to like to the planet Mars, into the bottom of a volcano, or onto a roof of a
tall building to get to a weather station
Data logging also have better processing and presentation of the results. The data
collected from the experiment can be processed by specialist software or put into spreadsheet.
Line, pie or bar graphs can be generated. A table of value can be displayed. The can be
exported to a desktop publishing (DTP) package. Text can be added explaining the
experiment and results shown. Clip art can be imported to provide a visual outline and shown
the experiment. The report can then be save and widely distributed in different ways, like
email, post or fax.
Disadvantages of data logging that if the data logging equipment breaks down or
malfunction, some data could be lost or not recorded. The equipment can be expensive for
small tasks and will only take readings at the logging interval which has been set up, if
something unexpected happens between recordings, the data will not be collected. The sensor
also must be carefully calibrated otherwise they could not taking the wrong readings.
CONCLUSION
The integration of data logging in school will solve the problem of mechanical aspects
of measuring, recording and reporting. These in turn enhance the time spent on the
observation and discussion. Data logging technology gives out effective learning and
achievement of learning outcomes.
Fermented food order us health benefit such as it can help to reduce high cholesterol
level in our blood, it strengthens and supports our digestive and immune systems.
REFERENCES
Data logger. Accessed on 19 March 2017 from
https://en.wikipedia.org/wiki/Data_logger#Examples
The data logging process. Accessed on 19 March 2017 from
http://www.bbc.co.uk/schools/gcsebitesize/ict/measurecontrol/3dataloggingrev1.shtml
Data Logging: Advantages and Disadvantages. Accessed on 19 March 2017 from
http://www.thomastallis.greenwich.sch.uk/gcse/gcseict3/online/artdlpc.htm
Data logger. Accessed on 20 March 2017 from https://www.dataq.com/data-logger/ and
http://www.dataloggerinc.com/

Sbi3013 data logger

  • 1.
    FACULTY OF SCIENCEAND MATHEMATICS AT 11- IJAZAH SARJANA MUDA PENDIDIKAN BIOLOGI DENGAN KEPUJIAN SBI 3013: INFORMATION AND COMMUNICATION TECHNOLOGY IN BIOLOGY ASSIGNMENT 2: DATA LOGGER: ANAEROBIC RESPIRATION (FERMENTATION) LECTURER: ENCIK AZMI BIN IBRAHIM NAME MATRIC NO. NUR SYAFIDAH BINTI JOHAN D20162076163 NURSYAKIKA BINTI HASAN D20162076164 AZILAH BINTI HASAN D20162076165 LEC. GROUP : GROUP A
  • 2.
    CONTENT NO. DESCRIPTION PAGES 1INTRODUCTION 2 ENGAGE, EMPOWER, AND ENHANCE 3 ADVANTAGES AND DISADVANTAGES 4 CONCLUSION 5 REFERENCES
  • 3.
    INTRODUCTION A data logger,is an electronic instrument that records measurements at set intervals over a period of time. Depending on the particular data logger, measurements can include: air temperature, relative humidity, AC/DC current and voltage, differential pressure, time-of-use (lights, motors, etc.), light intensity, water temperature, water level, dissolved oxygen, soil moisture, rainfall, wind speed and direction, leaf wetness, pulse signals, room occupancy, plug load, and many more. Data loggers are typically compact, battery-powered devices equipped with an internal microprocessor, data storage, and one or more sensors. They can be deployed indoors, outdoors, and underwater, and can record data for up to months at a time, unattended. A data logger may be a single-unit, stand-alone device with internal sensors, which fits in the palm of a hand, or it may be a multi-channel data collection instrument equipped with one or more external sensors. How does a data logger work?. First, the data logger is connected to a computer via a USB interface. Next, accompanying data logger software is used to select logging parameters (sampling intervals, start time, etc.) and activate the logger. The logger is then disconnected and deployed in the desired location, where it records each measurement and stores it in memory along with the time and date. Bluetooth Smart loggers can be configured and launched wirelessly, after deployment. After the desired monitoring period, the data logger is then reconnected to the computer and the software is used again to read out the data and display the measurements in graphs that show profiles over time. Tabular data can be viewed as well, or exported to a spreadsheet for further manipulation. In the case of web-based data logging systems, data are pushed to the Internet for access; with wireless data nodes, data are transmitted to a central receiver; and with Bluetooth Smart loggers, data are downloaded directly to your mobile device. Data loggers are used in a broad range of indoor, outdoor, underwater and temperature- controlled environments – essentially anywhere data is needed and the convenience of battery power is preferred. The four main types of data loggers are: stand-alone data loggers, web-based data logging systems, wireless data nodes, and Bluetooth Low Energy (BLE) data loggers.
  • 4.
    Stand-alone USB dataloggers are compact, reusable, and portable, and offer low cost and easy setup and deployment. Internal-sensor models are used for monitoring at the logger location, while external-sensor models (with flexible input channels for a range of external sensors) can be used for monitoring at some distance from the logger. Most stand-alone loggers communicate with a computer via a USB interface. For greater convenience, a data shuttle device can be used to offload data from the logger for transport back to a computer. Web-based data logging systems enable remote, around-the-clock Internet-based access to data via GSM cellular, WI-FI, or Ethernet communications. These systems can be configured with a variety of external plug-in sensors and transmit collected data to a secure web server for accessing the data. Wireless data nodes transmit real-time data from dozens of points to a central computer, eliminating the need to manually retrieve and offload data from individual data loggers. Bluetooth Low Energy data loggers measure and transmit data wirelessly to mobile devices over a 100-foot range ENGAGE, EMPOWER, AND ENHANCE ANAEROBIC RESPIRATION (FERMENTATION) Anaerobic respiration occurs in condition of limited oxygen supply or in absence of oxygen. In absence of oxygen, yeast will undergo anaerobic respiration. Yeast converts glucose into ethanol and carbon dioxide. So the carbon dioxide given out reflect the rate of anaerobic respiration. Glucose was fermented because this sugar can pass rapidly into the cell and enter directly into metabolic pathways. š¶6 š»12 š‘‚6 2š¶2 š»5 š‘‚š» + 2š¶š‘‚2 + 2ATP ENGAGE (SET INDUCTION) In this experiment, our problem statement is as stated as below: 1. What are the important ingredient do you need to make a bun? 2. What makes the dough expand and becomes bigger? 3. How to control the bun expand and becomes bigger in the shortest time?
  • 5.
    EMPOWER (CARRIED OUTAN EXPERIMENT) An experiment was been carried out by using carbon dioxide sensor to detect the carbon dioxide release by the yeast during fermentation. Different concentration of glucose was used to observed the difference in carbon dioxide concentration collected. Data logger will collect time data and plot a graph. PROCEDURE: 1. Measure 4 grams of yeast by the electronic balance. 2. Prepare 3 different concentration of glucose solutions which are 5%, 10% and 15%. 3. Boil all the glucose solutions under the Bunsen flame to evaporate any dissolve oxygen in the solution. 4. Cool down the glucose solutions by the ice to prevent the heat produce killed the yeast during the fermentation. 5. Connect the carbon dioxide sensor with the data logger. 6. Mix the glucose solutions with the yeast in the reagent bottle under the water bath with temperature 30 š‘œ š¶ . 7. Add a layer of oil on the top of the solutions to prevent gas trap on the solution. 8. Seal the carbon dioxide sensor to the reagent bottle of the mixed solution. 9. Put the reagent bottle under the water bath for 10 minutes. 10. Record the amount of carbon dioxide at each 10 second interval. 11. Step 4 to 11 repeated but the concentration of glucose solution is changed to 10% and 15% respectively. RESULT Table of production of carbon dioxide gas of fermentation of different concentration of glucose solution.
  • 6.
    The graph ofcarbon dioxide concentration versus time for difference concentration of glucose solution used (5%, 10% and 15%) From the graph and table, it is shown that the fermentation of 5% of glucose produced the highest amount of CO2 and the highest rate of fermentation. While fermentation of both 10% and 15% of glucose have produced almost same amount of CO2 in the same period of time, both also have steady rate of respiration. QUESTIONS 1. Look at your table, why does the carbon dioxide level change? The change of carbon dioxide level indicated that the yeast fermentation of glucose have begun. Or anaerobic respiration respiration has initiated by yeast. 2. Which fermentation of glucose produced higher amout of carbon dioxide gas? Why? In the same period of time, fermentation of yeast in glucose 5% have produced higher amout of carbon dioxide. This can be explain as in high concentration of glucose such as 10% and 15%, the increase in glucose concentration led to in the increase in fermentation time. Beside, when the glucose content increase, the glucose uptake rate decreased, this will affect the rate of fermentation. Thus, as longer time is required for fermentation of yeast to oocur, it reduced the amout of CO2 produced for both 10% and 15% of glucose fermentation.
  • 7.
    3. What doesthe graph tell you about the change in carbon dioxide level during fermentation. Fermentation of different concentration of glucose will have differet rate of fermentation and different amount of end product in fixed time. 4. What is the end product of fermentation? State the equation of yeast fermentation. Ethanol, carbon dioxide and energy. š¶6 š»12 š‘‚6 2š¶2 š»5 š‘‚š» + 2š¶š‘‚2 + 2ATP DISCUSSION 1. The fermentation of glucose, which occurs primarily when the glucose concentration is high or when oxygen is not avaible. 2. The cells have a low energy yield of only about 2 ATP per mole of glucose metabolized. The stoichiometry of this reaction is š¶6 š»12 š‘‚6 2š¶2 š»5 š‘‚š» + 2š¶š‘‚2 + 2ATP Where represents chemical energy utilized in the growth processes. 3. The influence of difference glucose concentration on metabolic activities of yeast was evaluated by the overall amout of CO2 and rate of reaction. 4. In high concentration of glucose such as 10% and 15%, the increase in glucose concentration led to in the oncrease in fermentation time. 5. Besides, when the glucose content increased, the glucose uptake rate decreased, this will affect the rate of fermentation. 6. Thus, as longer time is required foe fermentation of yeast to occur, it have reduced the amout of CO2 produced for both 10% and 15% of glucose fermentation. 7. Conversely, for the same reason which mentioned above, fermentation of 5% glucose have produced the higher amount of CO2 and with the higest rate of fermentation. ENHANCE (QUESTIONING) In the production of ftuit wine , most fruits have natural sugar in them and without adding extra sugar, these can be turned into a wine of about 4% to 6% volume alcohol. This is a low alcohol content. How high alcohol content of fruit wine is produced? To make a stronger wine about 12% - 17% sugar is needed to bring the alcohol content up to level high enough. The increase in glucose concentration led to in the increase in fermentation time. Besides, when the glucose content increased, the glucose uptake rate decreased, this will affect the rate of
  • 8.
    fermentation process, resultingin higher amount of by produces in times, thus producing fruit wine with alcohol content. Figure of example wine product from fruit UNIQUE FEATURE OF THIS ACTIVITY 1. Amount of carbon dioxide produced can be detected and measured accurately. We can measured in every 10 seconds and the data can be recorded up to three decimal places. 2. Less work need to be done by the students. For example, student do not need to be with the experiment all the tie as the result will be recorded automatically during that period of time. 3. The pattern of amount of CO2 production changes can be observe along with the experiment. 4. The change of the data in table and graph can be observed immediately, allowing us to halt and repeat the experiment easily.
  • 9.
    ADVANTAGES AND DISADVANTAGES Advantagesof data logging that data logging can be used in remote or dangerous situations. Data logging also can be carried out 24 hours a day, 365 days of the year. Time interval for collecting data can be very frequent and regular, for example, hundreds of measurements per second. Data logging can be set up to start at a time in the future and there no need to have a person present. Data logging is often more accurate because there is no likelihood of human error. Measurements are always taken at the right time. Unlike a human the computer will not forget to take a reading or take a reading too late or too early. Mistakes are not made in reading the results. Humans can make errors. For example it is quite easy to misread the temperature using the scale on a thermometer. Data logging devices can be sent to places that humans cannot easily get to like to the planet Mars, into the bottom of a volcano, or onto a roof of a tall building to get to a weather station Data logging also have better processing and presentation of the results. The data collected from the experiment can be processed by specialist software or put into spreadsheet. Line, pie or bar graphs can be generated. A table of value can be displayed. The can be exported to a desktop publishing (DTP) package. Text can be added explaining the experiment and results shown. Clip art can be imported to provide a visual outline and shown the experiment. The report can then be save and widely distributed in different ways, like email, post or fax. Disadvantages of data logging that if the data logging equipment breaks down or malfunction, some data could be lost or not recorded. The equipment can be expensive for small tasks and will only take readings at the logging interval which has been set up, if something unexpected happens between recordings, the data will not be collected. The sensor also must be carefully calibrated otherwise they could not taking the wrong readings.
  • 10.
    CONCLUSION The integration ofdata logging in school will solve the problem of mechanical aspects of measuring, recording and reporting. These in turn enhance the time spent on the observation and discussion. Data logging technology gives out effective learning and achievement of learning outcomes. Fermented food order us health benefit such as it can help to reduce high cholesterol level in our blood, it strengthens and supports our digestive and immune systems. REFERENCES Data logger. Accessed on 19 March 2017 from https://en.wikipedia.org/wiki/Data_logger#Examples The data logging process. Accessed on 19 March 2017 from http://www.bbc.co.uk/schools/gcsebitesize/ict/measurecontrol/3dataloggingrev1.shtml Data Logging: Advantages and Disadvantages. Accessed on 19 March 2017 from http://www.thomastallis.greenwich.sch.uk/gcse/gcseict3/online/artdlpc.htm Data logger. Accessed on 20 March 2017 from https://www.dataq.com/data-logger/ and http://www.dataloggerinc.com/