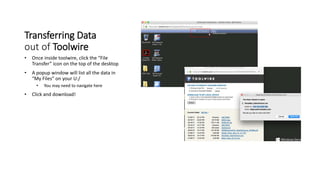
Download to read offline

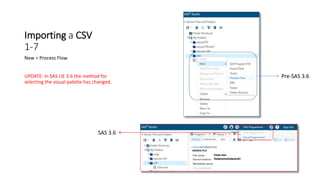
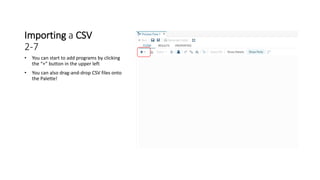
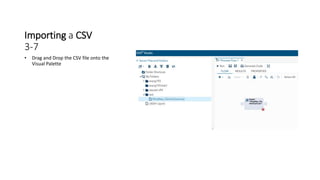
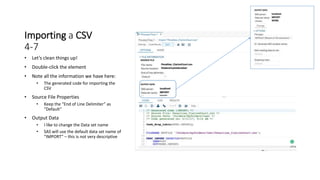
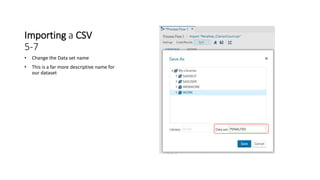
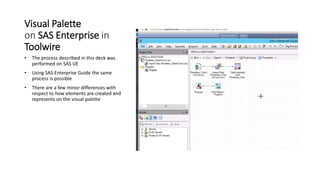

This document provides instructions for importing CSV files and running basic analyses in SAS University Edition (UE) using a visual palette. It describes how to upload CSV files from a local computer, import them into SAS UE by dragging the files onto the visual palette, clean and rename the imported dataset, and link the imported dataset to a PROC FREQ analysis to view frequencies of key variables. The document notes that the method for selecting the visual palette changed in SAS UE version 3.6 and provides guidance for transferring data out of the SAS UE Toolwire environment.