
Recommended
More Related Content
Similar to Sarasota Market Stats - October 2010
Similar to Sarasota Market Stats - October 2010 (20)
More from Sarasota Real Estate
More from Sarasota Real Estate (11)
Recently uploaded
Recently uploaded (20)
Sarasota Market Stats - October 2010
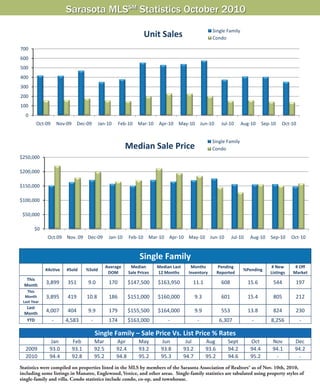
- 1. Sarasota MLSSM Statistics October 2010 Statistics were compiled on properties listed in the MLS by members of the Sarasota Association of Realtors® as of Nov. 10th, 2010, including some listings in Manatee, Englewood, Venice, and other areas. Single-family statistics are tabulated using property styles of single-family and villa. Condo statistics include condo, co-op, and townhouse. Source: Sarasota Association of Realtors® 0 100 200 300 400 500 600 700 Oct‐09 Nov‐09 Dec‐09 Jan‐10 Feb‐10 Mar‐10 Apr‐10 May‐10 Jun‐10 Jul‐10 Aug‐10 Sep‐10 Oct‐10 Unit Sales Single Family Condo $0 $50,000 $100,000 $150,000 $200,000 $250,000 Oct.09 Nov. 09 Dec‐09 Jan‐10 Feb‐10 Mar‐10 Apr‐10 May‐10 Jun‐10 Jul‐10 Aug‐10 Sep‐10 Oct‐10 Single Family CondoMedian Sale Price Single Family – Sale Price Vs. List Price % Rates Jan Feb Mar Apr May Jun Jul Aug Sept Oct Nov Dec 2009 93.0 93.1 92.5 92.4 93.2 93.8 93.2 93.6 94.2 94.4 94.1 94.2 2010 94.4 92.8 95.2 94.8 95.2 95.3 94.7 95.2 94.6 95.2 ‐ ‐ Single Family #Active #Sold %Sold Average DOM Median Sale Prices Median Last 12 Months Months Inventory Pending Reported %Pending # New Listings # Off Market This Month 3,899 351 9.0 170 $147,500 $163,950 11.1 608 15.6 544 197 This Month Last Year 3,895 419 10.8 186 $151,000 $160,000 9.3 601 15.4 805 212 Last Month 4,007 404 9.9 179 $155,500 $164,000 9.9 553 13.8 824 230 YTD ‐ 4,583 ‐ 174 $163,000 ‐ ‐ 6,307 ‐ 8,256 ‐ 16 DECEMBER 2010 Sarasota Realtor® Magazine www.sarasotarealtors.com
- 2. Sarasota MLSSM Statistics October 2010 Median sales price is the middle value, where half of the homes sold for more, and half sold for less. Listings sold were closed transac- tions during the month. Pending sales are sales where an offer has been accepted during the month, but the sale has not yet closed. Even though some pending sales never close, pending sales are an indicator of current buyer activity. DOM indicates the average number of days that sold properties were on the market before a contract was executed. Sarasota Association of Realtors® MLS 0 1,000 2,000 3,000 4,000 5,000 Oct‐09 Nov‐09 Dec‐09 Jan‐10 Feb‐10 Mar‐10 Apr‐10 May‐10 Jun‐10 Jul‐10 Aug‐10 Sep‐10 Oct‐10 Inventory Single Family Condo 0 100 200 300 400 500 600 700 800 900 Oct‐09 Nov‐09 Dec‐09 Jan‐10 Feb‐10 Mar‐10 Apr‐10 May‐10 Jun‐10 Jul‐10 Aug‐10 Sep‐10 Oct‐10 Pending Sales Single Family Condo Condo – Sale Price Vs. List Price % Rates Jan Feb Mar Apr May Jun Jul Aug Sept Oct Nov Dec 2009 91.0 90.2 90.4 92.2 90.1 91.4 92.1 92.4 91.5 92.4 92.3 93.1 2010 92.5 92.4 92.5 93.2 94.2 93.7 94.2 93.5 93.2 94.3 ‐ ‐ Condo #Active #Sold %Sold Average DOM Median Sale Prices Median Last 12 Months Months of Inventory Pending Reported %Pending # New Listings # Off Market This Month 2,170 136 6.3 206 $158,525 $165,000 15.9 211 9.7 293 179 This Month Last Year 2,331 155 6.6 250 $220,000 $199,450 15.0 238 10.2 331 235 Last Month 2,156 143 6.6 209 $150,450 $169,000 15.1 191 8.9 262 189 YTD ‐ 1,784 ‐ 205 $165,000 ‐ ‐ 2,382 ‐ 3,071 ‐ www.sarasotarealtors.com Sarasota Realtor® Magazine DECEMBER 2010 17