SlideShare a Scribd company logo
1 of 6
Sarasota MLSSM Statistics - August 2012
                                                                                                                                          Single Family
                                                                                           Unit Sales
                                                                                                                                          Condo
       700
       600
       500
       400
       300
       200
       100
         0
                  Aug‐11        Sep‐11          Oct‐11     Nov‐11       Dec‐11       Jan‐12      Feb‐12     Mar‐12        Apr‐12    May‐12        Jun‐12     Jul‐12       Aug‐12


                                                                                                                           Single Family
                                                                          Median Sale Price
                                                                                                                           Condo
      $250,000

      $200,000

      $150,000

      $100,000

       $50,000

                 $0
                      Aug‐11           Sep‐11      Oct‐11        Nov‐11     Dec‐11      Jan‐12     Feb‐12     Mar‐12       Apr‐12     May‐12       Jun‐12      Jul‐12     Aug‐12


                                                                                  Single Family 
                                                             Average         Median         Median Last        Months         Pending                          # New        # Off 
                      #Active          #Sold      %Sold                                                                                       %Pending 
                                                              DOM           Sale Prices     12 Months         Inventory       Reported                        Listings     Market 
         This 
        Month 
                      2,221            587        26.4           163      $169,945            $169,000             3.8             725            32.6          649          155 
         This 
        Month         2,817            445        15.8           180      $165,500            $157,000             6.3             618            21.9          669          186 
       Last Year 
         Last 
        Month 
                      2,329            523        22.5           167      $178,000            $168,500             4.5             703            30.2          683          146 
         YTD               ‐           4,348        ‐            170      $175,000                ‐                 ‐             5,971             ‐          5,139          ‐ 
                                    
                                                         Single Family – Sale Price Vs. List Price % Rates
                           Jan           Feb             Mar        Apr          May           Jun           Jul          Aug        Sept          Oct         Nov          Dec 
        2011               94.5          94.1            94.7       94.1         94.2          94.3         94.1          94.5       95.2          95.1        95.3         94.8 
        2012               95.4          94.2            94.6       94.7         95.1          95.2         94.2          95.3         ‐            ‐           ‐            ‐ 
                       
      Statistics were compiled on properties listed in the MLS by members of the Sarasota Association of Realtors® as of Sept. 10th, 2012,
      including some listings in Manatee, Englewood, Venice, and other areas. Single-family statistics are tabulated using property styles of
      single-family and villa. Condo statistics include condo, co-op, and townhouse.

                                                                                                                         Source: Sarasota Association of Realtors®
16	                       OCTOBER 2012	                                              Sarasota Realtor® Magazine	                                           www.sarasotarealtors.com
Sarasota MLSSM Statistics - August 2012
                                                                                                                   Single Family
                                                                            Inventory                              Condo
3,500
3,000
2,500
2,000
1,500
1,000
  500
       0
            Aug‐11         Sep‐11      Oct‐11       Nov‐11 Dec‐11         Jan‐12    Feb‐12 Mar‐12 Apr‐12 May‐12 Jun‐12                         Jul‐12      Aug‐12


                                                                                                                    Single Family
                                                                         Pending Sales                              Condo
900
800
700
600
500
400
300
200
100
   0
           Aug‐11         Sep‐11     Oct‐11        Nov‐11   Dec‐11       Jan‐12    Feb‐12     Mar‐12       Apr‐12        May‐12     Jun‐12     Jul‐12    Aug‐12


                                                                                   Condo 
                                                       Average      Median Sale    Median Last      Months of           Pending                     # New       # Off 
                  #Active     #Sold        %Sold                                                                                     %Pending 
                                                        DOM           Prices       12 Months        Inventory           Reported                   Listings    Market 
   This 
  Month 
                  1,283        232         18.0         166         $149,000        $163,950              5.5             228          17.8         247         131 
   This 
  Month           1,591        156          9.8         210         $165,000        $163,950           10.2               195          12.2         222         215 
 Last Year 
   Last 
  Month 
                  1,315        176         13.4         211         $176,000        $167,000              7.5             216          16.4         248         143 
   YTD               ‐        1,807           ‐         196         $178,800             ‐                 ‐             2,188          ‐          2,116            ‐ 
                      
                                                     Condo – Sale Price Vs. List Price % Rates
                   Jan             Feb         Mar          Apr         May         Jun         Jul             Aug         Sept       Oct         Nov         Dec 
   2011            93.4            91.2        92.2         93.4        94.5        94.2       92.5             93.1        92.8       93.2        93.6        92.7 
   2012            93.1            93.5        94.2         94.3        93.8        93.8       94.6             94.1          ‐         ‐           ‐           ‐ 
               
Median sales price is the middle value, where half of the homes sold for more, and half sold for less. Listings sold were closed
transactions during the month. Pending sales are sales where an offer has been accepted during the month, but the sale has not yet
closed. Even though some pending sales never close, pending sales are an indicator of current buyer activity. DOM indicates the average
number of days that sold properties were on the market before a contract was executed.
                                                                                                                 Sarasota Association of Realtors® MLS
www.sarasotarealtors.com	                                                   Sarasota Realtor® Magazine	                                      OCTOBER 2012	               17
The Xtra Pages - Digital Version Only
                                                                                                    Single Family
                                             Months of Inventory                                    Condo
12.0

10.0

 8.0

 6.0

 4.0

 2.0

 0.0
       Aug‐11   Sep‐11   Oct‐11   Nov‐11   Dec‐11    Jan‐12    Feb‐12    Mar‐12    Apr‐12 May‐12         Jun‐12      Jul‐12      Aug‐12
                                                                                            Single Family
                                                Days on Market
                                                                                            Condo
300

250

200

150

100

 50

  0
       Aug‐11   Sep‐11   Oct‐11   Nov‐11   Dec‐11     Jan‐12    Feb‐12    Mar‐12    Apr‐12     May‐12       Jun‐12      Jul‐12     Aug‐12
                                                                                                        Single Family
                                                     Sales Volume                                       Condo
$200,000,000
$180,000,000
$160,000,000
$140,000,000
$120,000,000
$100,000,000
 $80,000,000
 $60,000,000
 $40,000,000
 $20,000,000
          $0
                 Aug‐11 Sep‐11 Oct‐11 Nov‐11 Dec‐11 Jan‐12 Feb‐12 Mar‐12 Apr‐12 May‐12 Jun‐12                            Jul‐12 Aug‐12

                                                    New Listings                     Single Family
                                                                                     Condo
900
800
700
600
500
400
                                                                                   Sarasota Association of Realtors® MLS
300
200
100
  0
       Aug‐11   Sep‐11   Oct‐11   Nov‐11   Dec‐11    Jan‐12    Feb‐12    Mar‐12    Apr‐12    May‐12      Jun‐12      Jul‐12      Aug‐12
Second Quarter 2012 Report
                                      Single Family Sales ‐ By Quarter                                           REO         Short         Market
1400
1200
1000
 800
 600
 400
 200
   0
            2009‐Q4      2010‐Q1      2010‐Q2*     2010‐Q3      2010‐Q4      2011‐Q1     2011‐Q2     2011‐Q3      2011‐Q4      2012‐Q1       2012‐Q2
                 * Homebuyer Tax Credit In Effect

                                       Condo Sales ‐ By Quarter                                                  REO          Short         Market
700
600
500
400
300
200
100
  0
        2009‐Q4        2010‐Q1     2010‐Q2*        2010‐Q3      2010‐Q4      2011‐Q1     2011‐Q2     2011‐Q3      2011‐Q4      2012‐Q1       2012‐Q2
                      * Homebuyer Tax Credit In Effect

                         Single Family Median Sale Price                                              REO         Short          Market
 $300,000

 $250,000

 $200,000

 $150,000

 $100,000

  $50,000

       $0
               2009‐Q4      2010‐Q1      2010‐Q2      2010‐Q3      2010‐Q4     2011‐Q1     2011‐Q2     2011‐Q3     2011‐Q4       2012‐Q1      2012‐Q2


                                   Condo Median Sale Price                                            REO         Short         Market
 $300,000

 $250,000

 $200,000                                                                                    Source: Sarasota Association of Realtors®

 $150,000

 $100,000

  $50,000

       $0
               2009‐Q4      2010‐Q1      2010‐Q2      2010‐Q3     2010‐Q4      2011‐Q1    2011‐Q2     2011‐Q3      2011‐Q4      2012‐Q1      2012‐Q2
Single Family
                                      REO Sales ‐ By Quarter                              Condo

600

500

400

300

200

100

  0
          2009‐Q4     2010‐Q1   2010‐Q2*    2010‐Q3    2010‐Q4    2011‐Q1    2011‐Q2    2011‐Q3    2011‐Q4    2012‐Q1    2012‐Q2

             * Homebuyer Tax Credit In Effect

                                                                                          Single Family
                                  Short Sales ‐ By Quarter
                                                                                          Condo
400
350
300
250
200
150
100
 50
  0
          2009‐Q4     2010‐Q1 2010‐Q2* 2010‐Q3         2010‐Q4    2011‐Q1    2011‐Q2    2011‐Q3    2011‐Q4    2012‐Q1    2012‐Q2
                    * Homebuyer Tax Credit In Effect
                                                                                           Single Family
                                Market Sales ‐ By Quarter                                  Condo

1400
1200
1000
 800
 600
 400
 200
      0
           2009‐Q4      2010‐Q1 2010‐Q2* 2010‐Q3        2010‐Q4    2011‐Q1    2011‐Q2    2011‐Q3    2011‐Q4    2012‐Q1    2012‐Q2
                * Homebuyer Tax Credit In Effect


                                                                                  Source: Sarasota Association of Realtors®
Annual Sales ‐ 2000 to 2011
                                                                                             Single Family
                                                                                             Single Family             Condo              Total
                                                          11267
                                                                      10562
                                              9697


                               8167                                                                                                                 8224
                                                           7,596                                                                         7603
                  7036                                                 6,841
     6533                                                                                                                   6739
                                              6,504
                                              6 504                                    6358
                                                                                                    6042       5820                                 5,938
                               5,603                                                                                                    5,466
                                                                                                                            5,183
                  4,940
                                                                                                               4,626
     4,349                                                                            4,353
                                                                       3,721
                                                                       3 721                      3,922
                                                                                                   ,
                                                           3 671
                                                           3,671
                                              3,193
                               2,564
     2,184        2,096                                                                           2,120                                 2,137       2,286
                                                                                      2,005
                                                                                                                            1,556
                                                                                                               1,194


     2000         2001         2002           2003         2004        2005            2006         2007       2008         2009         2010       2011


Annual Median Sale Price ‐ 2000 to 2011 
             Single Family           Condo                                 $351,000
                                                                                        $342,000 $336,250
                                                                                                                $320,000

                                                           $272,500
                                                                                         $301,225
                                                                             $305,000
                                                $226,000
                                                                $225,000                            $303,000
                                 $191,000                                                                                    $210,000
                   $172,500
                                                    $191,000                                                   $230,000                     $163,000
$142,000                                                                                                                                           $156,800
                                $173,000
                   $145,000                                                                                               $160,000
      $132,300                                                                                                                          $163,000   $155,925


   2000         2001          2002           2003        2004         2005            2006        2007         2008         2009        2010        2011

More Related Content

What's hot (13)

May2011 stats 3 to8
May2011 stats 3 to8May2011 stats 3 to8
May2011 stats 3 to8
 
Sales climb in February 2012; pending sales rise to 11-month high
Sales climb in February 2012; pending sales rise to 11-month highSales climb in February 2012; pending sales rise to 11-month high
Sales climb in February 2012; pending sales rise to 11-month high
 
Srmag june2011 stats
Srmag june2011 statsSrmag june2011 stats
Srmag june2011 stats
 
Sarasota Market Stats Feb 2011
Sarasota Market Stats Feb 2011Sarasota Market Stats Feb 2011
Sarasota Market Stats Feb 2011
 
May2011 stats
May2011 statsMay2011 stats
May2011 stats
 
July2010 stats
July2010 statsJuly2010 stats
July2010 stats
 
Sar stats july2011
Sar stats july2011Sar stats july2011
Sar stats july2011
 
August2010 stats
August2010 statsAugust2010 stats
August2010 stats
 
Dec2010stats
Dec2010statsDec2010stats
Dec2010stats
 
House price monitor.12.2011
House price monitor.12.2011House price monitor.12.2011
House price monitor.12.2011
 
Market Watch October 2012
Market Watch October 2012Market Watch October 2012
Market Watch October 2012
 
Phoenix Market report 1112
Phoenix Market report 1112Phoenix Market report 1112
Phoenix Market report 1112
 
January 2013 the woodlands tx home sales market report collection
January 2013 the woodlands tx home sales market report collectionJanuary 2013 the woodlands tx home sales market report collection
January 2013 the woodlands tx home sales market report collection
 

Viewers also liked

Viewers also liked (9)

Sarasota Market Statistics July 2013
Sarasota Market Statistics July 2013Sarasota Market Statistics July 2013
Sarasota Market Statistics July 2013
 
Sarasota Market Stats feb2012
Sarasota Market Stats feb2012Sarasota Market Stats feb2012
Sarasota Market Stats feb2012
 
e2e Projects
e2e Projectse2e Projects
e2e Projects
 
e2e Projects
e2e Projectse2e Projects
e2e Projects
 
SARStats-July2011
SARStats-July2011SARStats-July2011
SARStats-July2011
 
SAR Monthly Statistics Released for June 2011
SAR Monthly Statistics Released for June 2011SAR Monthly Statistics Released for June 2011
SAR Monthly Statistics Released for June 2011
 
Srmag june2011 stats
Srmag june2011 statsSrmag june2011 stats
Srmag june2011 stats
 
Corporate presentation
Corporate presentationCorporate presentation
Corporate presentation
 
Buying a home in sarasota florida
Buying a home in sarasota floridaBuying a home in sarasota florida
Buying a home in sarasota florida
 

Similar to Aug2012 stats 3_8

Northeast Georgia September 2012 Market Trend RE/port
Northeast Georgia September 2012 Market Trend RE/portNortheast Georgia September 2012 Market Trend RE/port
Northeast Georgia September 2012 Market Trend RE/portRE/MAX Regional Services
 
Northern KY September 2012 Market Trend RE/port
Northern KY September 2012 Market Trend RE/portNorthern KY September 2012 Market Trend RE/port
Northern KY September 2012 Market Trend RE/portRE/MAX Regional Services
 
Chattanooga September 2012 Market Trend RE/port
Chattanooga September 2012 Market Trend RE/portChattanooga September 2012 Market Trend RE/port
Chattanooga September 2012 Market Trend RE/portRE/MAX Regional Services
 
Metro Atlanta September 2012 Market Trend RE/port
Metro Atlanta September 2012 Market Trend RE/portMetro Atlanta September 2012 Market Trend RE/port
Metro Atlanta September 2012 Market Trend RE/portRE/MAX Regional Services
 
Lexington September 2012 Market Trend RE/port
Lexington September 2012 Market Trend RE/portLexington September 2012 Market Trend RE/port
Lexington September 2012 Market Trend RE/portRE/MAX Regional Services
 
Augusta September 2012 Market Trend RE/port
Augusta September 2012 Market Trend RE/portAugusta September 2012 Market Trend RE/port
Augusta September 2012 Market Trend RE/portRE/MAX Regional Services
 
Louisville September 2012 Market Trend RE/port
Louisville September 2012 Market Trend RE/portLouisville September 2012 Market Trend RE/port
Louisville September 2012 Market Trend RE/portRE/MAX Regional Services
 
Savannah September 2012 Market Trend RE/port
Savannah September 2012 Market Trend RE/portSavannah September 2012 Market Trend RE/port
Savannah September 2012 Market Trend RE/portRE/MAX Regional Services
 
September 2012 Market Overview
September 2012 Market OverviewSeptember 2012 Market Overview
September 2012 Market OverviewGary Smith
 
Market report 0912
Market report 0912Market report 0912
Market report 0912Len Nevin
 
Detroit September 2012 Market Trend RE/port
Detroit September 2012 Market Trend RE/portDetroit September 2012 Market Trend RE/port
Detroit September 2012 Market Trend RE/portRE/MAX Regional Services
 
Naea 12-12 (2)
Naea 12-12 (2)Naea 12-12 (2)
Naea 12-12 (2)Cate8364
 

Similar to Aug2012 stats 3_8 (18)

Sarasota Market stats for March
Sarasota Market stats for MarchSarasota Market stats for March
Sarasota Market stats for March
 
Northeast Georgia September 2012 Market Trend RE/port
Northeast Georgia September 2012 Market Trend RE/portNortheast Georgia September 2012 Market Trend RE/port
Northeast Georgia September 2012 Market Trend RE/port
 
Northern KY September 2012 Market Trend RE/port
Northern KY September 2012 Market Trend RE/portNorthern KY September 2012 Market Trend RE/port
Northern KY September 2012 Market Trend RE/port
 
Chattanooga September 2012 Market Trend RE/port
Chattanooga September 2012 Market Trend RE/portChattanooga September 2012 Market Trend RE/port
Chattanooga September 2012 Market Trend RE/port
 
Metro Atlanta September 2012 Market Trend RE/port
Metro Atlanta September 2012 Market Trend RE/portMetro Atlanta September 2012 Market Trend RE/port
Metro Atlanta September 2012 Market Trend RE/port
 
Lexington September 2012 Market Trend RE/port
Lexington September 2012 Market Trend RE/portLexington September 2012 Market Trend RE/port
Lexington September 2012 Market Trend RE/port
 
Augusta September 2012 Market Trend RE/port
Augusta September 2012 Market Trend RE/portAugusta September 2012 Market Trend RE/port
Augusta September 2012 Market Trend RE/port
 
Sarasota Market Stats May
Sarasota Market Stats MaySarasota Market Stats May
Sarasota Market Stats May
 
Louisville September 2012 Market Trend RE/port
Louisville September 2012 Market Trend RE/portLouisville September 2012 Market Trend RE/port
Louisville September 2012 Market Trend RE/port
 
Savannah September 2012 Market Trend RE/port
Savannah September 2012 Market Trend RE/portSavannah September 2012 Market Trend RE/port
Savannah September 2012 Market Trend RE/port
 
Phoenix AZ - Monthly Market Watch - September 2012
Phoenix AZ - Monthly Market Watch - September 2012Phoenix AZ - Monthly Market Watch - September 2012
Phoenix AZ - Monthly Market Watch - September 2012
 
September 2012 Market Overview
September 2012 Market OverviewSeptember 2012 Market Overview
September 2012 Market Overview
 
Market report 0912
Market report 0912Market report 0912
Market report 0912
 
Memphis October 2012 Market Trend RE/port
Memphis October 2012 Market Trend RE/portMemphis October 2012 Market Trend RE/port
Memphis October 2012 Market Trend RE/port
 
Sar statsemail13052285100.2 7
Sar statsemail13052285100.2 7Sar statsemail13052285100.2 7
Sar statsemail13052285100.2 7
 
Detroit September 2012 Market Trend RE/port
Detroit September 2012 Market Trend RE/portDetroit September 2012 Market Trend RE/port
Detroit September 2012 Market Trend RE/port
 
Sr mag june2013stats.3-8
Sr mag june2013stats.3-8Sr mag june2013stats.3-8
Sr mag june2013stats.3-8
 
Naea 12-12 (2)
Naea 12-12 (2)Naea 12-12 (2)
Naea 12-12 (2)
 

Recently uploaded

Kalpataru Exquisite Wakad Pune E-Brochure.pdf
Kalpataru Exquisite Wakad Pune  E-Brochure.pdfKalpataru Exquisite Wakad Pune  E-Brochure.pdf
Kalpataru Exquisite Wakad Pune E-Brochure.pdfManishSaxena95
 
Call girls In Rana Pratap Bagh {Delhi ↫8447779280↬Escort Service (Delhi)
Call girls In Rana Pratap Bagh {Delhi ↫8447779280↬Escort Service (Delhi)Call girls In Rana Pratap Bagh {Delhi ↫8447779280↬Escort Service (Delhi)
Call girls In Rana Pratap Bagh {Delhi ↫8447779280↬Escort Service (Delhi)asmaqueen5
 
Bridge & Elliot Ladner Floor Plans May 2024.pdf
Bridge & Elliot Ladner Floor Plans May 2024.pdfBridge & Elliot Ladner Floor Plans May 2024.pdf
Bridge & Elliot Ladner Floor Plans May 2024.pdfVickyAulakh1
 
Listing Turkey - 2024 - May Featured Portfolio
Listing Turkey - 2024 - May Featured PortfolioListing Turkey - 2024 - May Featured Portfolio
Listing Turkey - 2024 - May Featured PortfolioListing Turkey
 
Dynamic Grandeur Undri Pune | A Space For You To Find Your Space
Dynamic Grandeur Undri Pune | A Space For You To Find Your SpaceDynamic Grandeur Undri Pune | A Space For You To Find Your Space
Dynamic Grandeur Undri Pune | A Space For You To Find Your Spaceaidasheikh47
 
Jaipur Escorts 🥰 8617370543 Call Girls Offer VIP Hot Girls
Jaipur Escorts 🥰 8617370543 Call Girls Offer VIP Hot GirlsJaipur Escorts 🥰 8617370543 Call Girls Offer VIP Hot Girls
Jaipur Escorts 🥰 8617370543 Call Girls Offer VIP Hot GirlsDeepika Singh
 
Low Rate ✨➥9582086666▻✨Call Girls In Gurgaon Sector 22 (Gurgaon)
Low Rate ✨➥9582086666▻✨Call Girls In Gurgaon Sector 22 (Gurgaon)Low Rate ✨➥9582086666▻✨Call Girls In Gurgaon Sector 22 (Gurgaon)
Low Rate ✨➥9582086666▻✨Call Girls In Gurgaon Sector 22 (Gurgaon)delhi24hrs1
 
Madhugiri Boucher Managed Farmland (knx)
Madhugiri Boucher Managed Farmland (knx)Madhugiri Boucher Managed Farmland (knx)
Madhugiri Boucher Managed Farmland (knx)knoxdigital1
 
Explore Dual Citizenship in Africa | Citizenship Benefits & Requirements
Explore Dual Citizenship in Africa | Citizenship Benefits & RequirementsExplore Dual Citizenship in Africa | Citizenship Benefits & Requirements
Explore Dual Citizenship in Africa | Citizenship Benefits & Requirementsmarketingkingdomofku
 
Low rate ↬Call girls in Sabzi Mandi Delhi | 8447779280}Escort Service In All ...
Low rate ↬Call girls in Sabzi Mandi Delhi | 8447779280}Escort Service In All ...Low rate ↬Call girls in Sabzi Mandi Delhi | 8447779280}Escort Service In All ...
Low rate ↬Call girls in Sabzi Mandi Delhi | 8447779280}Escort Service In All ...asmaqueen5
 
Kohinoor Teiko Hinjewadi Phase 2 Pune E-Brochure.pdf
Kohinoor Teiko Hinjewadi Phase 2 Pune  E-Brochure.pdfKohinoor Teiko Hinjewadi Phase 2 Pune  E-Brochure.pdf
Kohinoor Teiko Hinjewadi Phase 2 Pune E-Brochure.pdfManishSaxena95
 
Acibadem Konaklari Uskudar - Listin Turkey
Acibadem Konaklari Uskudar - Listin TurkeyAcibadem Konaklari Uskudar - Listin Turkey
Acibadem Konaklari Uskudar - Listin TurkeyListing Turkey
 
Eldeco Dwarka Project In Delhi-brochure.pdf.pdf
Eldeco Dwarka Project In Delhi-brochure.pdf.pdfEldeco Dwarka Project In Delhi-brochure.pdf.pdf
Eldeco Dwarka Project In Delhi-brochure.pdf.pdfkratirudram
 
BPTP THE AMAARIO For The Royals Of Tomorrow in Sector 37D Gurgaon Dwarka Expr...
BPTP THE AMAARIO For The Royals Of Tomorrow in Sector 37D Gurgaon Dwarka Expr...BPTP THE AMAARIO For The Royals Of Tomorrow in Sector 37D Gurgaon Dwarka Expr...
BPTP THE AMAARIO For The Royals Of Tomorrow in Sector 37D Gurgaon Dwarka Expr...ApartmentWala1
 
Low Rate ✨➥9582086666▻✨Call Girls In Gurgaon Sector 28 (Gurgaon)
Low Rate ✨➥9582086666▻✨Call Girls In Gurgaon Sector 28 (Gurgaon)Low Rate ✨➥9582086666▻✨Call Girls In Gurgaon Sector 28 (Gurgaon)
Low Rate ✨➥9582086666▻✨Call Girls In Gurgaon Sector 28 (Gurgaon)delhi24hrs1
 
Real Estate Finance and Investments (2019).pdf
Real Estate Finance and Investments (2019).pdfReal Estate Finance and Investments (2019).pdf
Real Estate Finance and Investments (2019).pdfZahraYusuf9
 
Cheap Rate ✨➥9711108085▻✨Call Girls In Connaught Place (Delhi)
Cheap Rate ✨➥9711108085▻✨Call Girls In Connaught Place (Delhi)Cheap Rate ✨➥9711108085▻✨Call Girls In Connaught Place (Delhi)
Cheap Rate ✨➥9711108085▻✨Call Girls In Connaught Place (Delhi)delhi24hrs1
 
Call Girls in Maurice Nagar (Delhi) ꧁8447779280꧂ Female Escorts Service in De...
Call Girls in Maurice Nagar (Delhi) ꧁8447779280꧂ Female Escorts Service in De...Call Girls in Maurice Nagar (Delhi) ꧁8447779280꧂ Female Escorts Service in De...
Call Girls in Maurice Nagar (Delhi) ꧁8447779280꧂ Female Escorts Service in De...asmaqueen5
 
Kohinoor Courtyard One Wakad Pune | Elegant Living Spaces
Kohinoor Courtyard One Wakad Pune | Elegant Living SpacesKohinoor Courtyard One Wakad Pune | Elegant Living Spaces
Kohinoor Courtyard One Wakad Pune | Elegant Living Spacesaidasheikh47
 
BPTP THE AMAARIO Luxury Project Invest Like Royalty in Sector 37D Gurgaon Dwa...
BPTP THE AMAARIO Luxury Project Invest Like Royalty in Sector 37D Gurgaon Dwa...BPTP THE AMAARIO Luxury Project Invest Like Royalty in Sector 37D Gurgaon Dwa...
BPTP THE AMAARIO Luxury Project Invest Like Royalty in Sector 37D Gurgaon Dwa...ApartmentWala1
 

Recently uploaded (20)

Kalpataru Exquisite Wakad Pune E-Brochure.pdf
Kalpataru Exquisite Wakad Pune  E-Brochure.pdfKalpataru Exquisite Wakad Pune  E-Brochure.pdf
Kalpataru Exquisite Wakad Pune E-Brochure.pdf
 
Call girls In Rana Pratap Bagh {Delhi ↫8447779280↬Escort Service (Delhi)
Call girls In Rana Pratap Bagh {Delhi ↫8447779280↬Escort Service (Delhi)Call girls In Rana Pratap Bagh {Delhi ↫8447779280↬Escort Service (Delhi)
Call girls In Rana Pratap Bagh {Delhi ↫8447779280↬Escort Service (Delhi)
 
Bridge & Elliot Ladner Floor Plans May 2024.pdf
Bridge & Elliot Ladner Floor Plans May 2024.pdfBridge & Elliot Ladner Floor Plans May 2024.pdf
Bridge & Elliot Ladner Floor Plans May 2024.pdf
 
Listing Turkey - 2024 - May Featured Portfolio
Listing Turkey - 2024 - May Featured PortfolioListing Turkey - 2024 - May Featured Portfolio
Listing Turkey - 2024 - May Featured Portfolio
 
Dynamic Grandeur Undri Pune | A Space For You To Find Your Space
Dynamic Grandeur Undri Pune | A Space For You To Find Your SpaceDynamic Grandeur Undri Pune | A Space For You To Find Your Space
Dynamic Grandeur Undri Pune | A Space For You To Find Your Space
 
Jaipur Escorts 🥰 8617370543 Call Girls Offer VIP Hot Girls
Jaipur Escorts 🥰 8617370543 Call Girls Offer VIP Hot GirlsJaipur Escorts 🥰 8617370543 Call Girls Offer VIP Hot Girls
Jaipur Escorts 🥰 8617370543 Call Girls Offer VIP Hot Girls
 
Low Rate ✨➥9582086666▻✨Call Girls In Gurgaon Sector 22 (Gurgaon)
Low Rate ✨➥9582086666▻✨Call Girls In Gurgaon Sector 22 (Gurgaon)Low Rate ✨➥9582086666▻✨Call Girls In Gurgaon Sector 22 (Gurgaon)
Low Rate ✨➥9582086666▻✨Call Girls In Gurgaon Sector 22 (Gurgaon)
 
Madhugiri Boucher Managed Farmland (knx)
Madhugiri Boucher Managed Farmland (knx)Madhugiri Boucher Managed Farmland (knx)
Madhugiri Boucher Managed Farmland (knx)
 
Explore Dual Citizenship in Africa | Citizenship Benefits & Requirements
Explore Dual Citizenship in Africa | Citizenship Benefits & RequirementsExplore Dual Citizenship in Africa | Citizenship Benefits & Requirements
Explore Dual Citizenship in Africa | Citizenship Benefits & Requirements
 
Low rate ↬Call girls in Sabzi Mandi Delhi | 8447779280}Escort Service In All ...
Low rate ↬Call girls in Sabzi Mandi Delhi | 8447779280}Escort Service In All ...Low rate ↬Call girls in Sabzi Mandi Delhi | 8447779280}Escort Service In All ...
Low rate ↬Call girls in Sabzi Mandi Delhi | 8447779280}Escort Service In All ...
 
Kohinoor Teiko Hinjewadi Phase 2 Pune E-Brochure.pdf
Kohinoor Teiko Hinjewadi Phase 2 Pune  E-Brochure.pdfKohinoor Teiko Hinjewadi Phase 2 Pune  E-Brochure.pdf
Kohinoor Teiko Hinjewadi Phase 2 Pune E-Brochure.pdf
 
Acibadem Konaklari Uskudar - Listin Turkey
Acibadem Konaklari Uskudar - Listin TurkeyAcibadem Konaklari Uskudar - Listin Turkey
Acibadem Konaklari Uskudar - Listin Turkey
 
Eldeco Dwarka Project In Delhi-brochure.pdf.pdf
Eldeco Dwarka Project In Delhi-brochure.pdf.pdfEldeco Dwarka Project In Delhi-brochure.pdf.pdf
Eldeco Dwarka Project In Delhi-brochure.pdf.pdf
 
BPTP THE AMAARIO For The Royals Of Tomorrow in Sector 37D Gurgaon Dwarka Expr...
BPTP THE AMAARIO For The Royals Of Tomorrow in Sector 37D Gurgaon Dwarka Expr...BPTP THE AMAARIO For The Royals Of Tomorrow in Sector 37D Gurgaon Dwarka Expr...
BPTP THE AMAARIO For The Royals Of Tomorrow in Sector 37D Gurgaon Dwarka Expr...
 
Low Rate ✨➥9582086666▻✨Call Girls In Gurgaon Sector 28 (Gurgaon)
Low Rate ✨➥9582086666▻✨Call Girls In Gurgaon Sector 28 (Gurgaon)Low Rate ✨➥9582086666▻✨Call Girls In Gurgaon Sector 28 (Gurgaon)
Low Rate ✨➥9582086666▻✨Call Girls In Gurgaon Sector 28 (Gurgaon)
 
Real Estate Finance and Investments (2019).pdf
Real Estate Finance and Investments (2019).pdfReal Estate Finance and Investments (2019).pdf
Real Estate Finance and Investments (2019).pdf
 
Cheap Rate ✨➥9711108085▻✨Call Girls In Connaught Place (Delhi)
Cheap Rate ✨➥9711108085▻✨Call Girls In Connaught Place (Delhi)Cheap Rate ✨➥9711108085▻✨Call Girls In Connaught Place (Delhi)
Cheap Rate ✨➥9711108085▻✨Call Girls In Connaught Place (Delhi)
 
Call Girls in Maurice Nagar (Delhi) ꧁8447779280꧂ Female Escorts Service in De...
Call Girls in Maurice Nagar (Delhi) ꧁8447779280꧂ Female Escorts Service in De...Call Girls in Maurice Nagar (Delhi) ꧁8447779280꧂ Female Escorts Service in De...
Call Girls in Maurice Nagar (Delhi) ꧁8447779280꧂ Female Escorts Service in De...
 
Kohinoor Courtyard One Wakad Pune | Elegant Living Spaces
Kohinoor Courtyard One Wakad Pune | Elegant Living SpacesKohinoor Courtyard One Wakad Pune | Elegant Living Spaces
Kohinoor Courtyard One Wakad Pune | Elegant Living Spaces
 
BPTP THE AMAARIO Luxury Project Invest Like Royalty in Sector 37D Gurgaon Dwa...
BPTP THE AMAARIO Luxury Project Invest Like Royalty in Sector 37D Gurgaon Dwa...BPTP THE AMAARIO Luxury Project Invest Like Royalty in Sector 37D Gurgaon Dwa...
BPTP THE AMAARIO Luxury Project Invest Like Royalty in Sector 37D Gurgaon Dwa...
 

Aug2012 stats 3_8

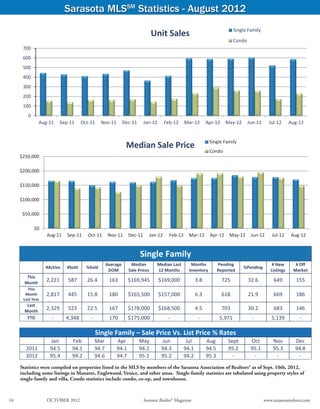
  • 1. Sarasota MLSSM Statistics - August 2012 Single Family Unit Sales Condo 700 600 500 400 300 200 100 0 Aug‐11 Sep‐11 Oct‐11 Nov‐11 Dec‐11 Jan‐12 Feb‐12 Mar‐12 Apr‐12 May‐12 Jun‐12 Jul‐12 Aug‐12 Single Family Median Sale Price Condo $250,000 $200,000 $150,000 $100,000 $50,000 $0 Aug‐11 Sep‐11 Oct‐11 Nov‐11 Dec‐11 Jan‐12 Feb‐12 Mar‐12 Apr‐12 May‐12 Jun‐12 Jul‐12 Aug‐12 Single Family    Average Median  Median Last  Months  Pending  # New  # Off  #Active  #Sold  %Sold  %Pending  DOM  Sale Prices  12 Months  Inventory  Reported  Listings  Market  This  Month  2,221  587  26.4  163  $169,945  $169,000  3.8  725  32.6  649  155  This  Month  2,817  445  15.8  180  $165,500  $157,000  6.3  618  21.9  669  186  Last Year  Last  Month  2,329  523  22.5  167  $178,000  $168,500  4.5  703  30.2  683  146  YTD  ‐  4,348 ‐  170  $175,000  ‐  ‐  5,971  ‐  5,139  ‐      Single Family – Sale Price Vs. List Price % Rates   Jan  Feb  Mar  Apr  May  Jun  Jul  Aug  Sept  Oct  Nov  Dec  2011  94.5  94.1  94.7  94.1  94.2  94.3  94.1  94.5  95.2  95.1  95.3  94.8  2012  95.4  94.2  94.6  94.7  95.1  95.2  94.2  95.3  ‐  ‐  ‐  ‐    Statistics were compiled on properties listed in the MLS by members of the Sarasota Association of Realtors® as of Sept. 10th, 2012, including some listings in Manatee, Englewood, Venice, and other areas. Single-family statistics are tabulated using property styles of single-family and villa. Condo statistics include condo, co-op, and townhouse. Source: Sarasota Association of Realtors® 16 OCTOBER 2012 Sarasota Realtor® Magazine www.sarasotarealtors.com
  • 2. Sarasota MLSSM Statistics - August 2012 Single Family Inventory Condo 3,500 3,000 2,500 2,000 1,500 1,000 500 0 Aug‐11 Sep‐11 Oct‐11 Nov‐11 Dec‐11 Jan‐12 Feb‐12 Mar‐12 Apr‐12 May‐12 Jun‐12 Jul‐12 Aug‐12 Single Family Pending Sales Condo 900 800 700 600 500 400 300 200 100 0 Aug‐11 Sep‐11 Oct‐11 Nov‐11 Dec‐11 Jan‐12 Feb‐12 Mar‐12 Apr‐12 May‐12 Jun‐12 Jul‐12 Aug‐12 Condo    Average  Median Sale  Median Last  Months of Pending  # New  # Off  #Active  #Sold  %Sold  %Pending  DOM  Prices  12 Months  Inventory  Reported  Listings  Market  This  Month  1,283  232  18.0  166  $149,000  $163,950  5.5  228  17.8  247  131  This  Month  1,591  156  9.8  210  $165,000  $163,950  10.2  195  12.2  222  215  Last Year  Last  Month  1,315  176  13.4  211  $176,000  $167,000  7.5  216  16.4  248  143  YTD  ‐  1,807  ‐  196  $178,800  ‐  ‐  2,188  ‐  2,116  ‐    Condo – Sale Price Vs. List Price % Rates   Jan  Feb  Mar  Apr  May  Jun  Jul  Aug  Sept  Oct  Nov  Dec  2011  93.4  91.2  92.2  93.4  94.5  94.2  92.5  93.1  92.8  93.2  93.6  92.7  2012  93.1  93.5  94.2  94.3  93.8  93.8  94.6  94.1  ‐  ‐  ‐  ‐    Median sales price is the middle value, where half of the homes sold for more, and half sold for less. Listings sold were closed transactions during the month. Pending sales are sales where an offer has been accepted during the month, but the sale has not yet closed. Even though some pending sales never close, pending sales are an indicator of current buyer activity. DOM indicates the average number of days that sold properties were on the market before a contract was executed. Sarasota Association of Realtors® MLS www.sarasotarealtors.com Sarasota Realtor® Magazine OCTOBER 2012 17
  • 3. The Xtra Pages - Digital Version Only Single Family Months of Inventory Condo 12.0 10.0 8.0 6.0 4.0 2.0 0.0 Aug‐11 Sep‐11 Oct‐11 Nov‐11 Dec‐11 Jan‐12 Feb‐12 Mar‐12 Apr‐12 May‐12 Jun‐12 Jul‐12 Aug‐12 Single Family Days on Market Condo 300 250 200 150 100 50 0 Aug‐11 Sep‐11 Oct‐11 Nov‐11 Dec‐11 Jan‐12 Feb‐12 Mar‐12 Apr‐12 May‐12 Jun‐12 Jul‐12 Aug‐12 Single Family Sales Volume Condo $200,000,000 $180,000,000 $160,000,000 $140,000,000 $120,000,000 $100,000,000 $80,000,000 $60,000,000 $40,000,000 $20,000,000 $0 Aug‐11 Sep‐11 Oct‐11 Nov‐11 Dec‐11 Jan‐12 Feb‐12 Mar‐12 Apr‐12 May‐12 Jun‐12 Jul‐12 Aug‐12 New Listings Single Family Condo 900 800 700 600 500 400 Sarasota Association of Realtors® MLS 300 200 100 0 Aug‐11 Sep‐11 Oct‐11 Nov‐11 Dec‐11 Jan‐12 Feb‐12 Mar‐12 Apr‐12 May‐12 Jun‐12 Jul‐12 Aug‐12
  • 4. Second Quarter 2012 Report Single Family Sales ‐ By Quarter REO Short Market 1400 1200 1000 800 600 400 200 0 2009‐Q4 2010‐Q1 2010‐Q2* 2010‐Q3 2010‐Q4 2011‐Q1 2011‐Q2 2011‐Q3 2011‐Q4 2012‐Q1 2012‐Q2 * Homebuyer Tax Credit In Effect Condo Sales ‐ By Quarter REO Short Market 700 600 500 400 300 200 100 0 2009‐Q4 2010‐Q1 2010‐Q2* 2010‐Q3 2010‐Q4 2011‐Q1 2011‐Q2 2011‐Q3 2011‐Q4 2012‐Q1 2012‐Q2 * Homebuyer Tax Credit In Effect Single Family Median Sale Price REO Short Market $300,000 $250,000 $200,000 $150,000 $100,000 $50,000 $0 2009‐Q4 2010‐Q1 2010‐Q2 2010‐Q3 2010‐Q4 2011‐Q1 2011‐Q2 2011‐Q3 2011‐Q4 2012‐Q1 2012‐Q2 Condo Median Sale Price REO Short Market $300,000 $250,000 $200,000 Source: Sarasota Association of Realtors® $150,000 $100,000 $50,000 $0 2009‐Q4 2010‐Q1 2010‐Q2 2010‐Q3 2010‐Q4 2011‐Q1 2011‐Q2 2011‐Q3 2011‐Q4 2012‐Q1 2012‐Q2
  • 5. Single Family REO Sales ‐ By Quarter Condo 600 500 400 300 200 100 0 2009‐Q4 2010‐Q1 2010‐Q2* 2010‐Q3 2010‐Q4 2011‐Q1 2011‐Q2 2011‐Q3 2011‐Q4 2012‐Q1 2012‐Q2 * Homebuyer Tax Credit In Effect Single Family Short Sales ‐ By Quarter Condo 400 350 300 250 200 150 100 50 0 2009‐Q4 2010‐Q1 2010‐Q2* 2010‐Q3 2010‐Q4 2011‐Q1 2011‐Q2 2011‐Q3 2011‐Q4 2012‐Q1 2012‐Q2 * Homebuyer Tax Credit In Effect Single Family Market Sales ‐ By Quarter Condo 1400 1200 1000 800 600 400 200 0 2009‐Q4 2010‐Q1 2010‐Q2* 2010‐Q3 2010‐Q4 2011‐Q1 2011‐Q2 2011‐Q3 2011‐Q4 2012‐Q1 2012‐Q2 * Homebuyer Tax Credit In Effect Source: Sarasota Association of Realtors®
  • 6. Annual Sales ‐ 2000 to 2011 Single Family Single Family Condo Total 11267 10562 9697 8167 8224 7,596 7603 7036 6,841 6533 6739 6,504 6 504 6358 6042 5820 5,938 5,603 5,466 5,183 4,940 4,626 4,349 4,353 3,721 3 721 3,922 , 3 671 3,671 3,193 2,564 2,184 2,096 2,120 2,137 2,286 2,005 1,556 1,194 2000 2001 2002 2003 2004 2005 2006 2007 2008 2009 2010 2011 Annual Median Sale Price ‐ 2000 to 2011  Single Family Condo $351,000 $342,000 $336,250 $320,000 $272,500 $301,225 $305,000 $226,000 $225,000 $303,000 $191,000 $210,000 $172,500 $191,000 $230,000 $163,000 $142,000 $156,800 $173,000 $145,000 $160,000 $132,300 $163,000 $155,925 2000 2001 2002 2003 2004 2005 2006 2007 2008 2009 2010 2011