Download as PDF, PPTX

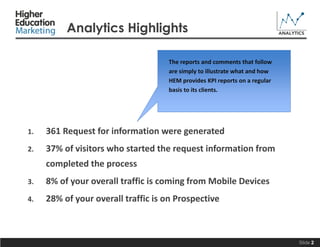
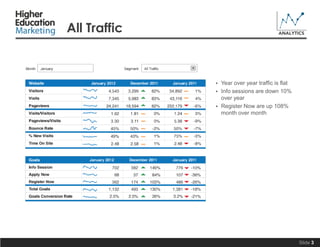
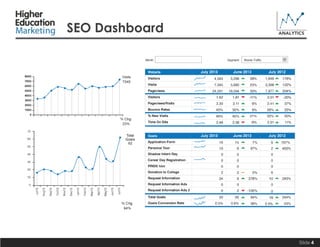
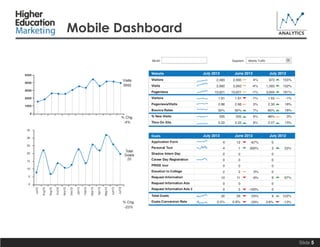
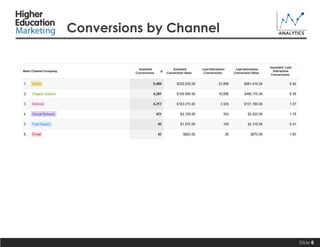
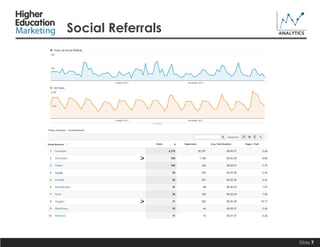
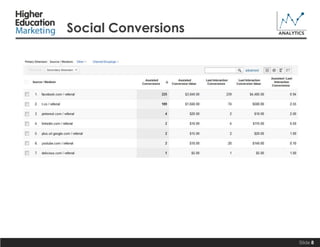
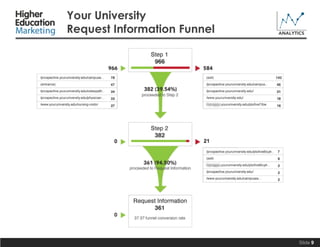
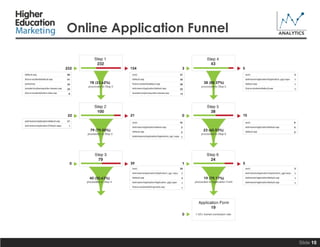
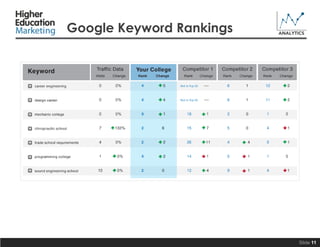
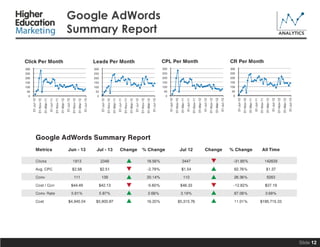


This analytics report from HEM provides key performance indicators to clients on a regular basis. It summarizes that 361 request for information were generated, 37% of visitors who started the request information process completed it, and 8% of overall traffic came from mobile devices while 28% was from prospective visitors. The report also includes dashboards on all traffic, SEO, mobile, conversions by channel, social referrals, social conversions, request information and online application funnels, Google keyword rankings, and a Google AdWords summary.


![[RESEARCH REPORT] The 2016 State of Digital Transformation](https://cdn.slidesharecdn.com/ss_thumbnails/2016stateofdtpreview-160916184533-thumbnail.jpg?width=640&height=640&fit=bounds)


![Getting Started with Apache Spark: Big Data Made Simple [Free Meetup]](https://cdn.slidesharecdn.com/ss_thumbnails/apachesparkgettingstarted-260203175547-8361bcc3-thumbnail.jpg?width=640&height=640&fit=bounds)

