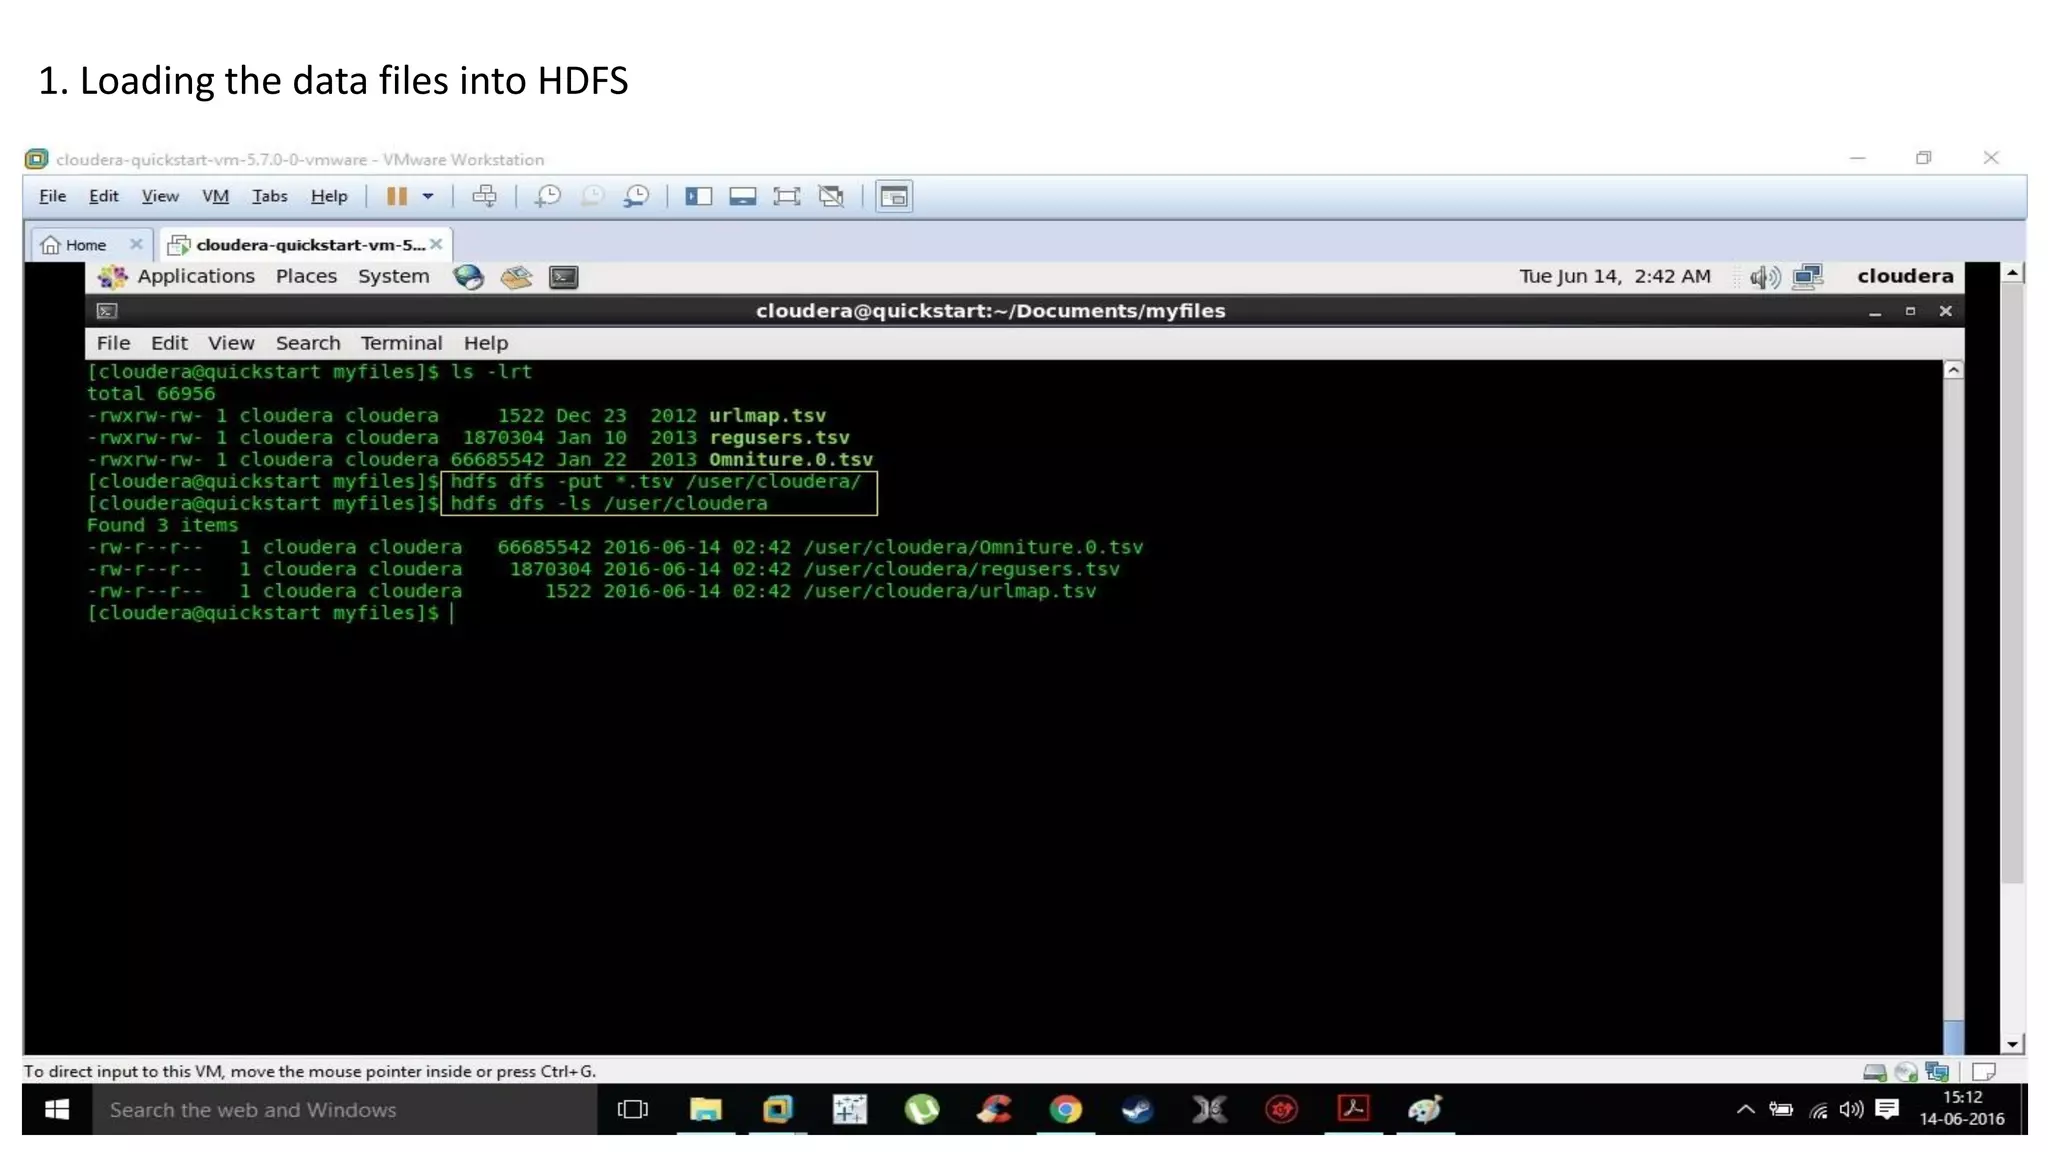
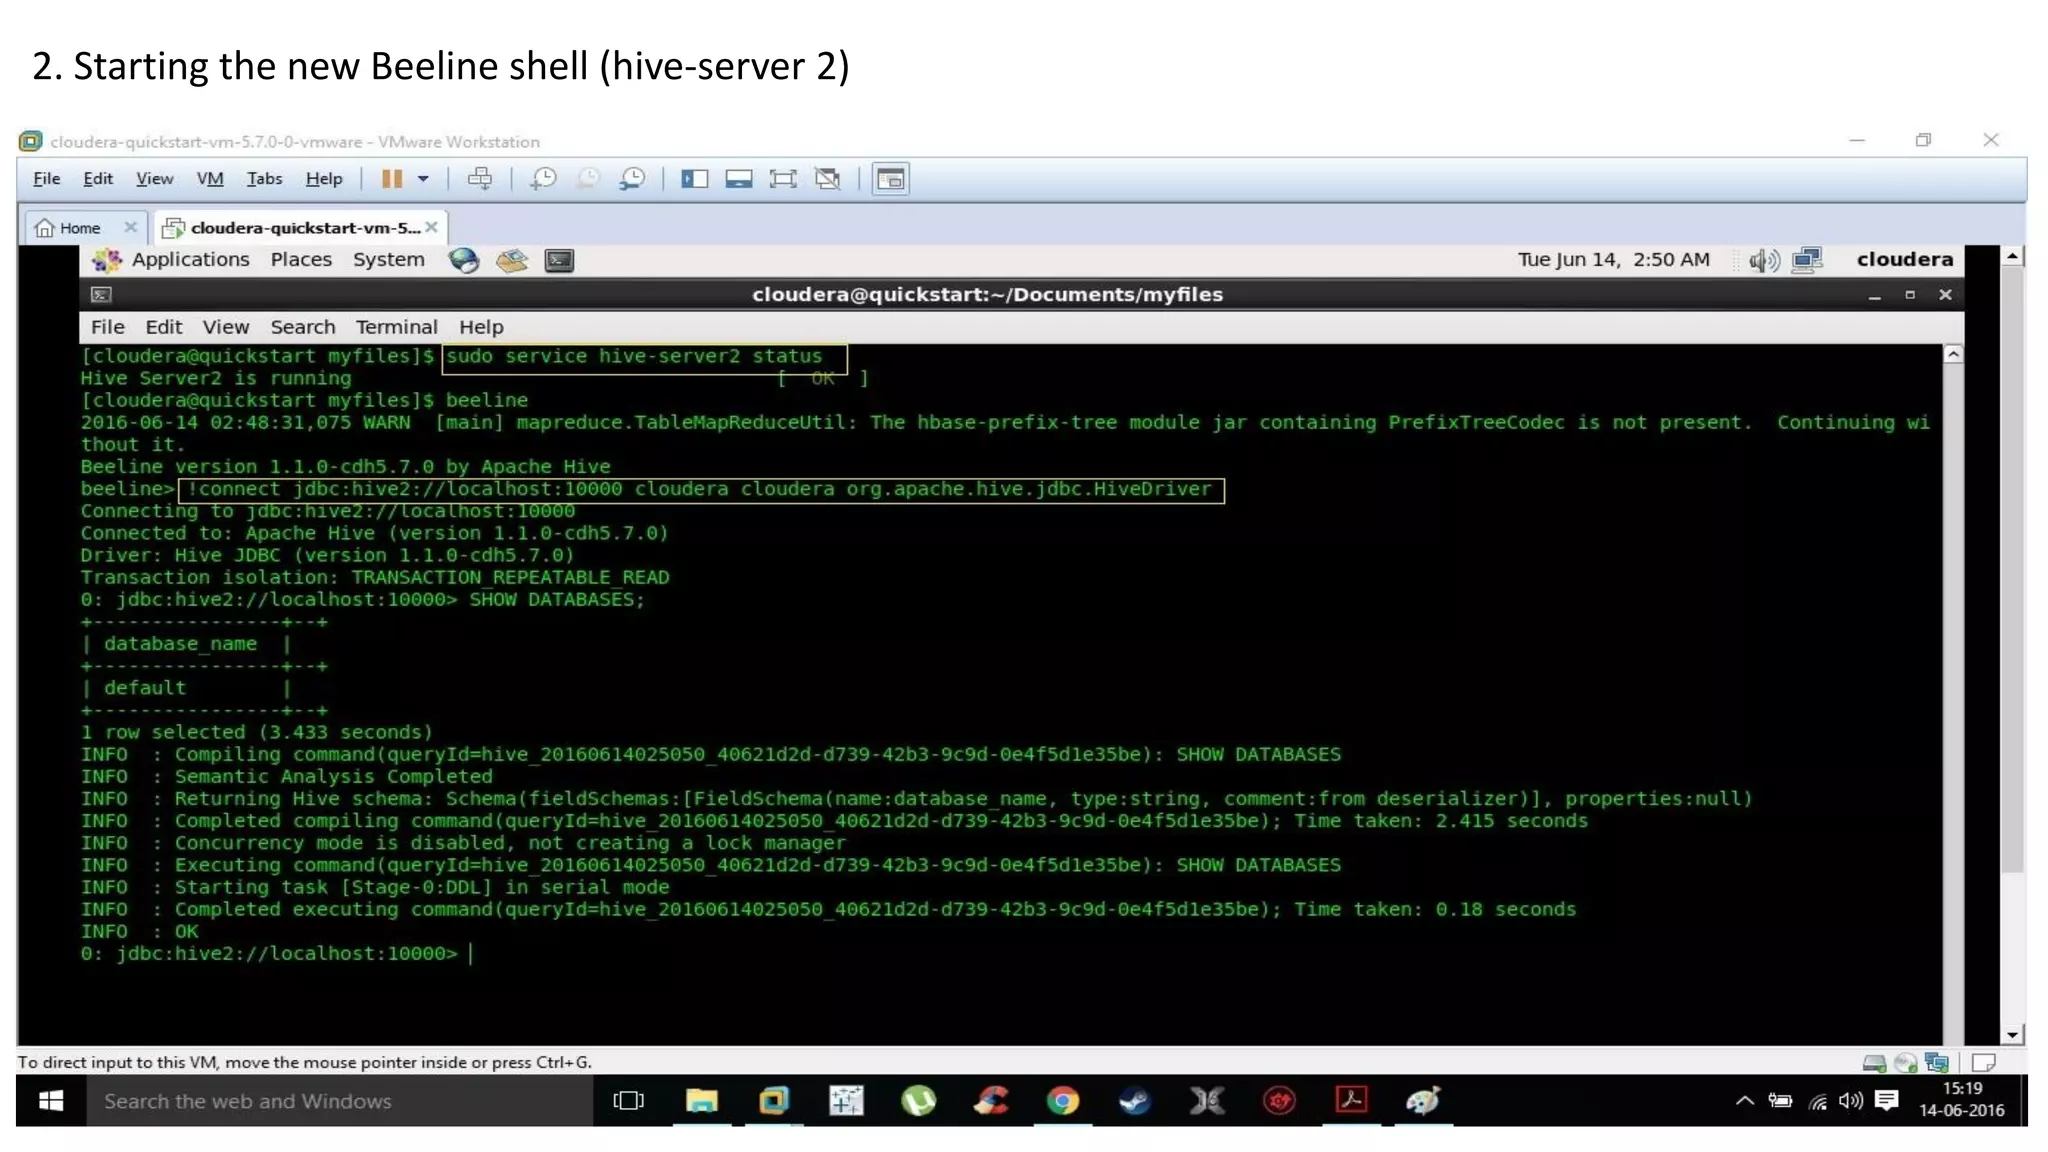
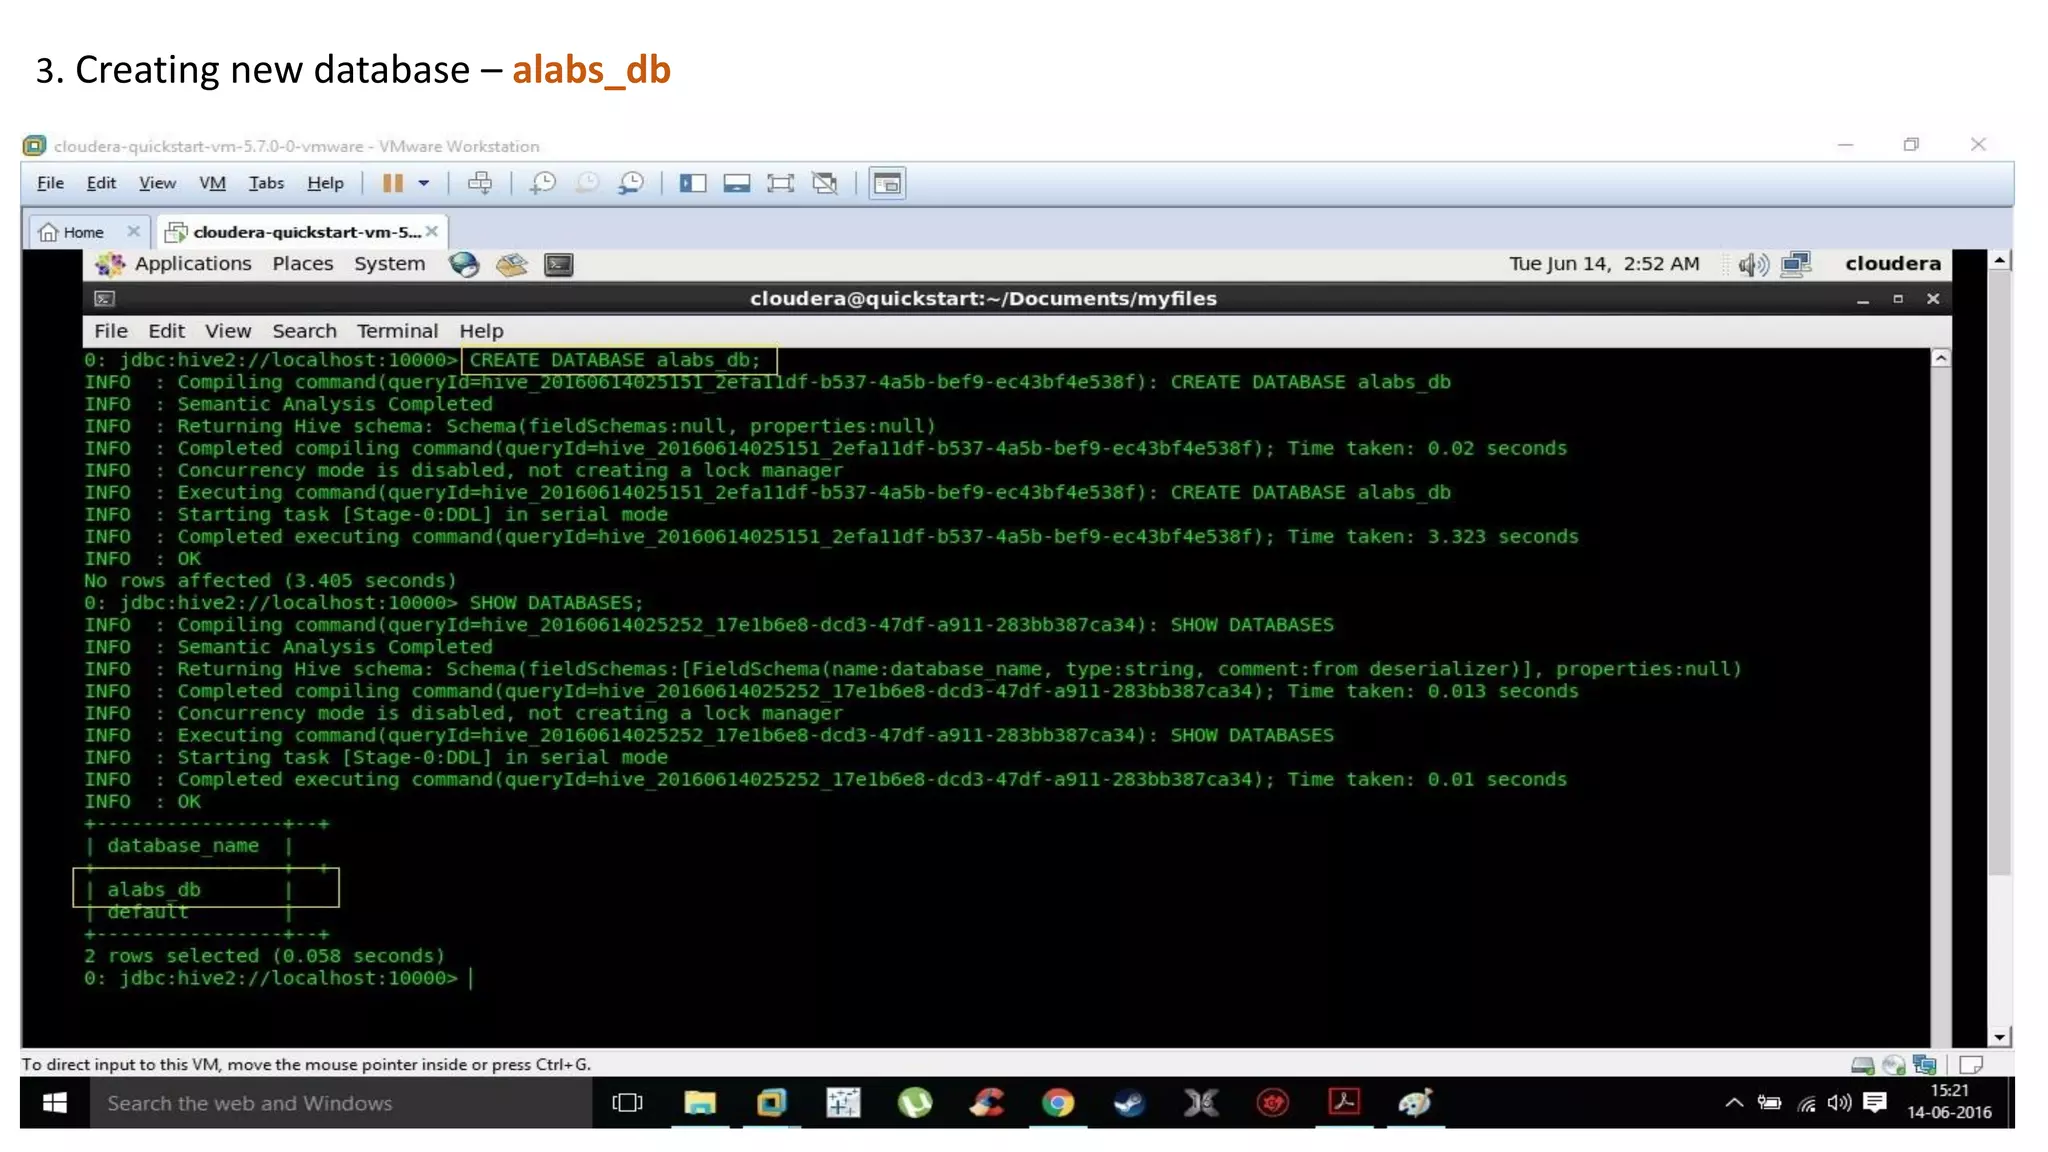
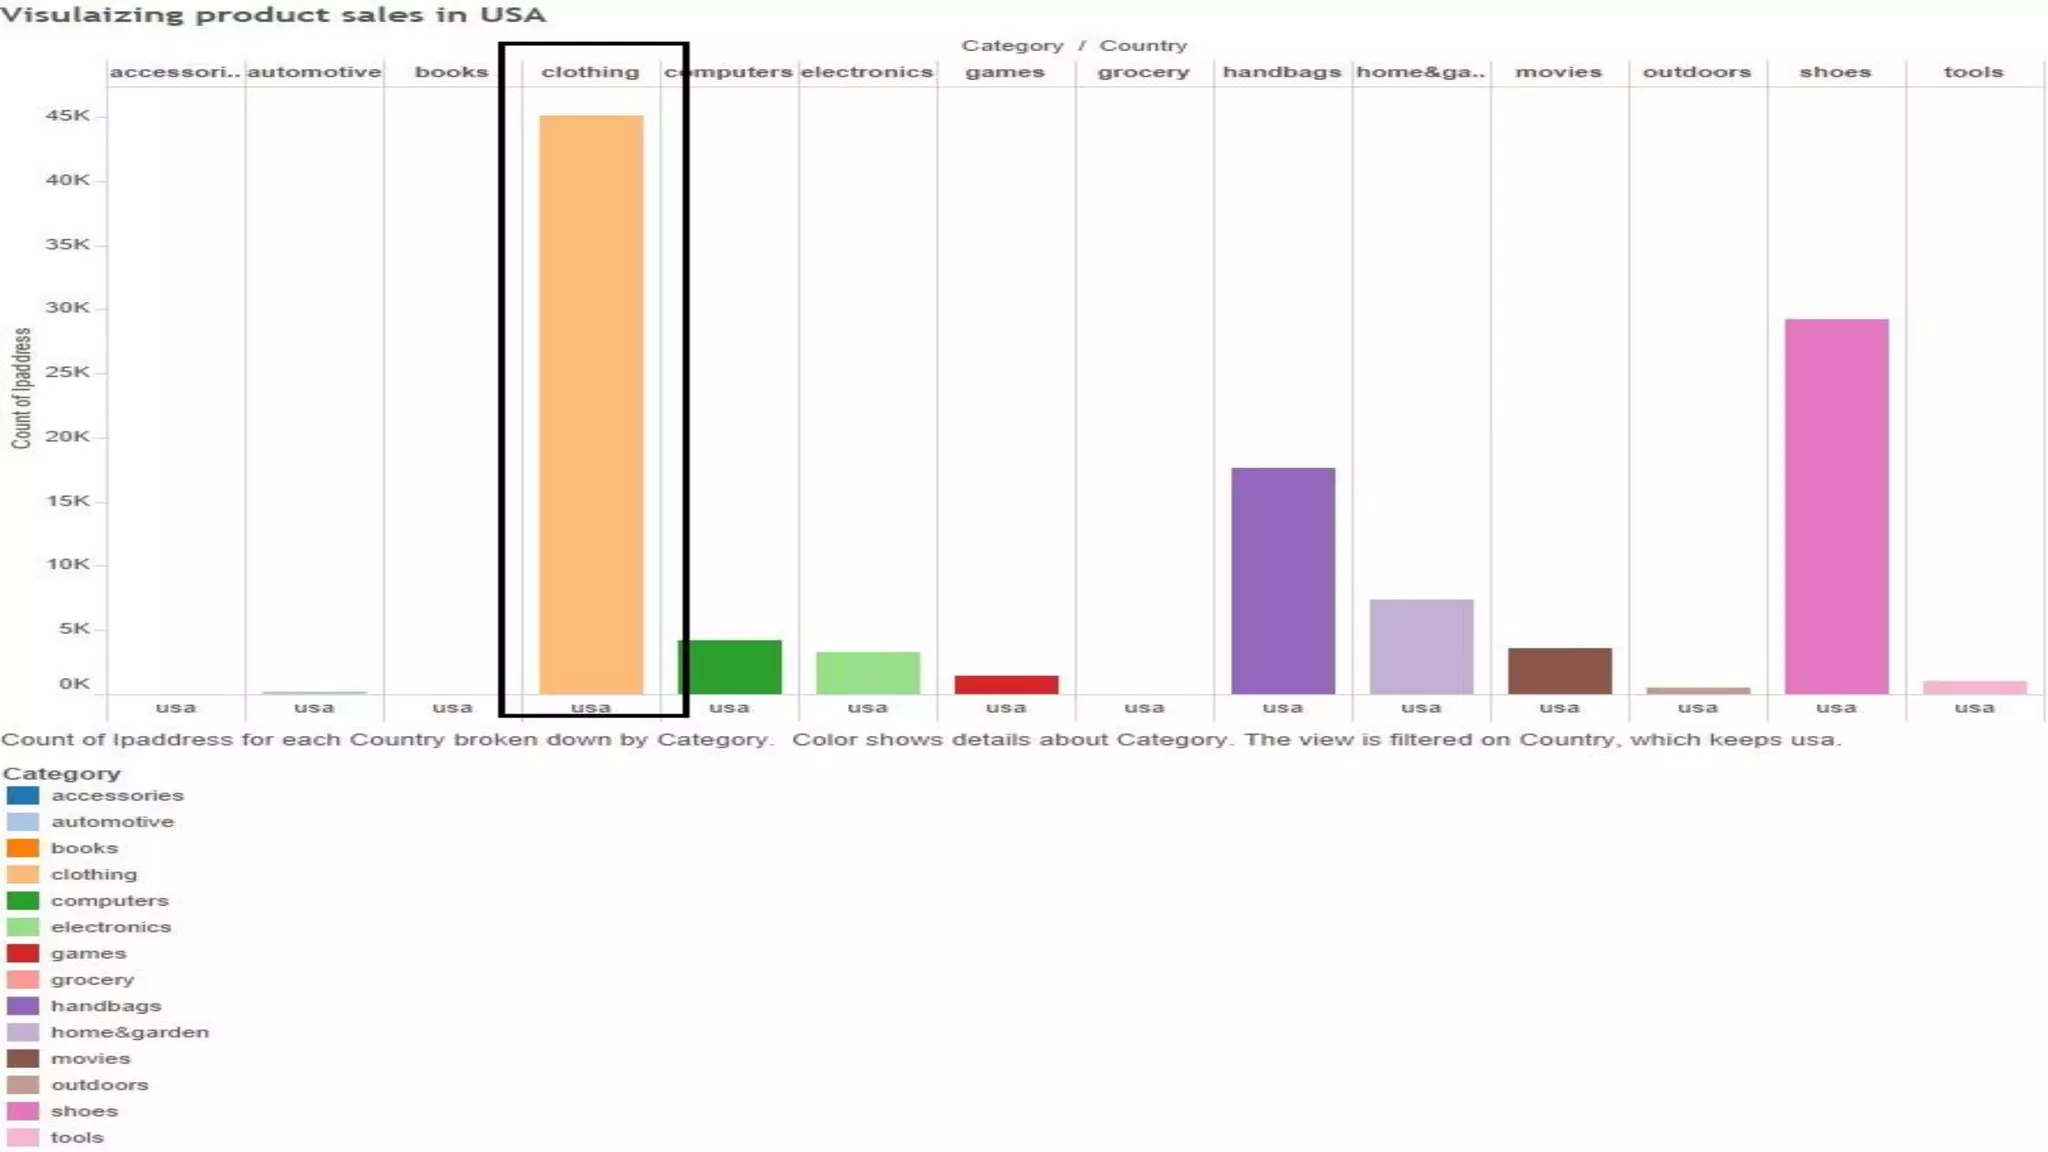
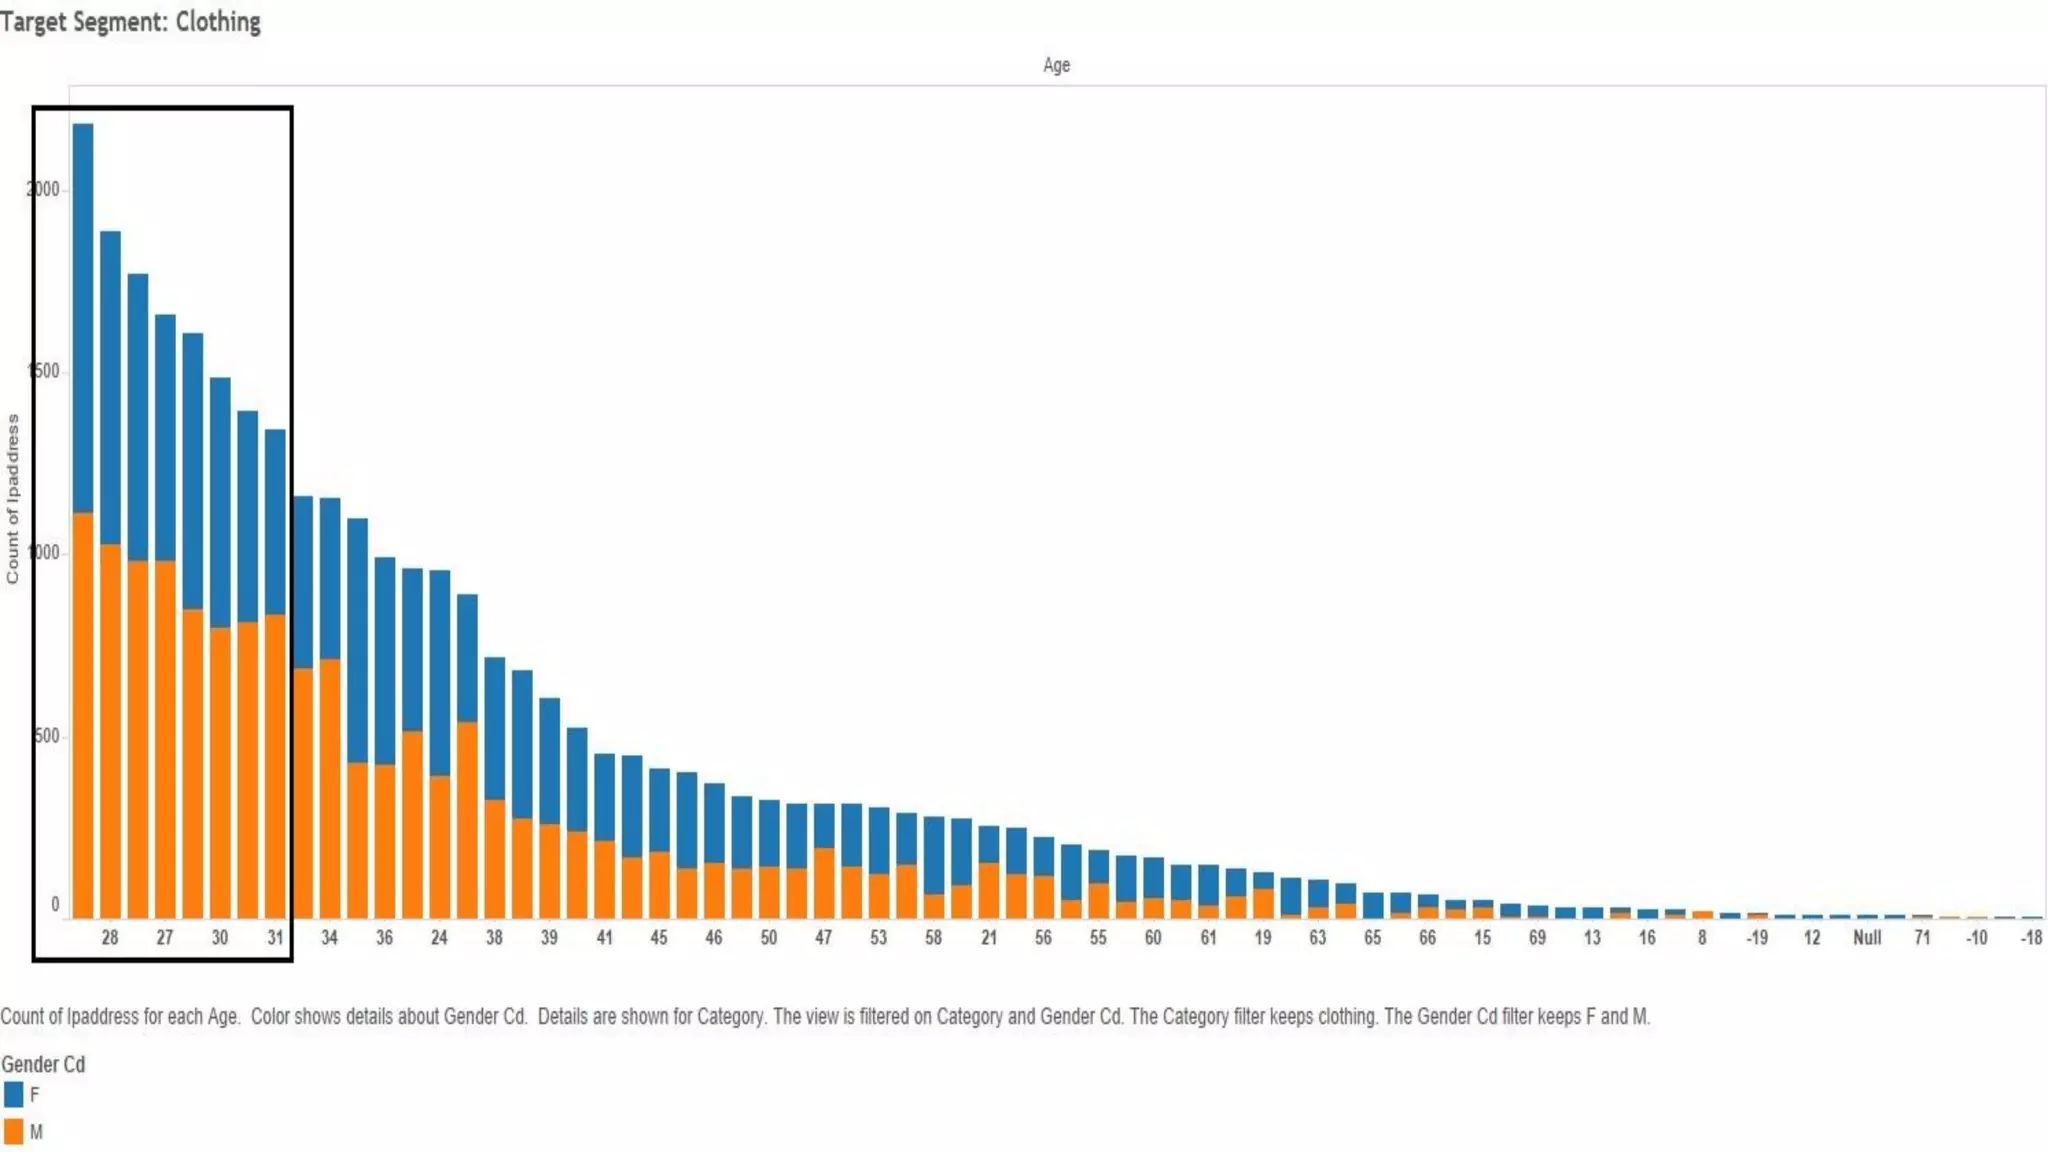
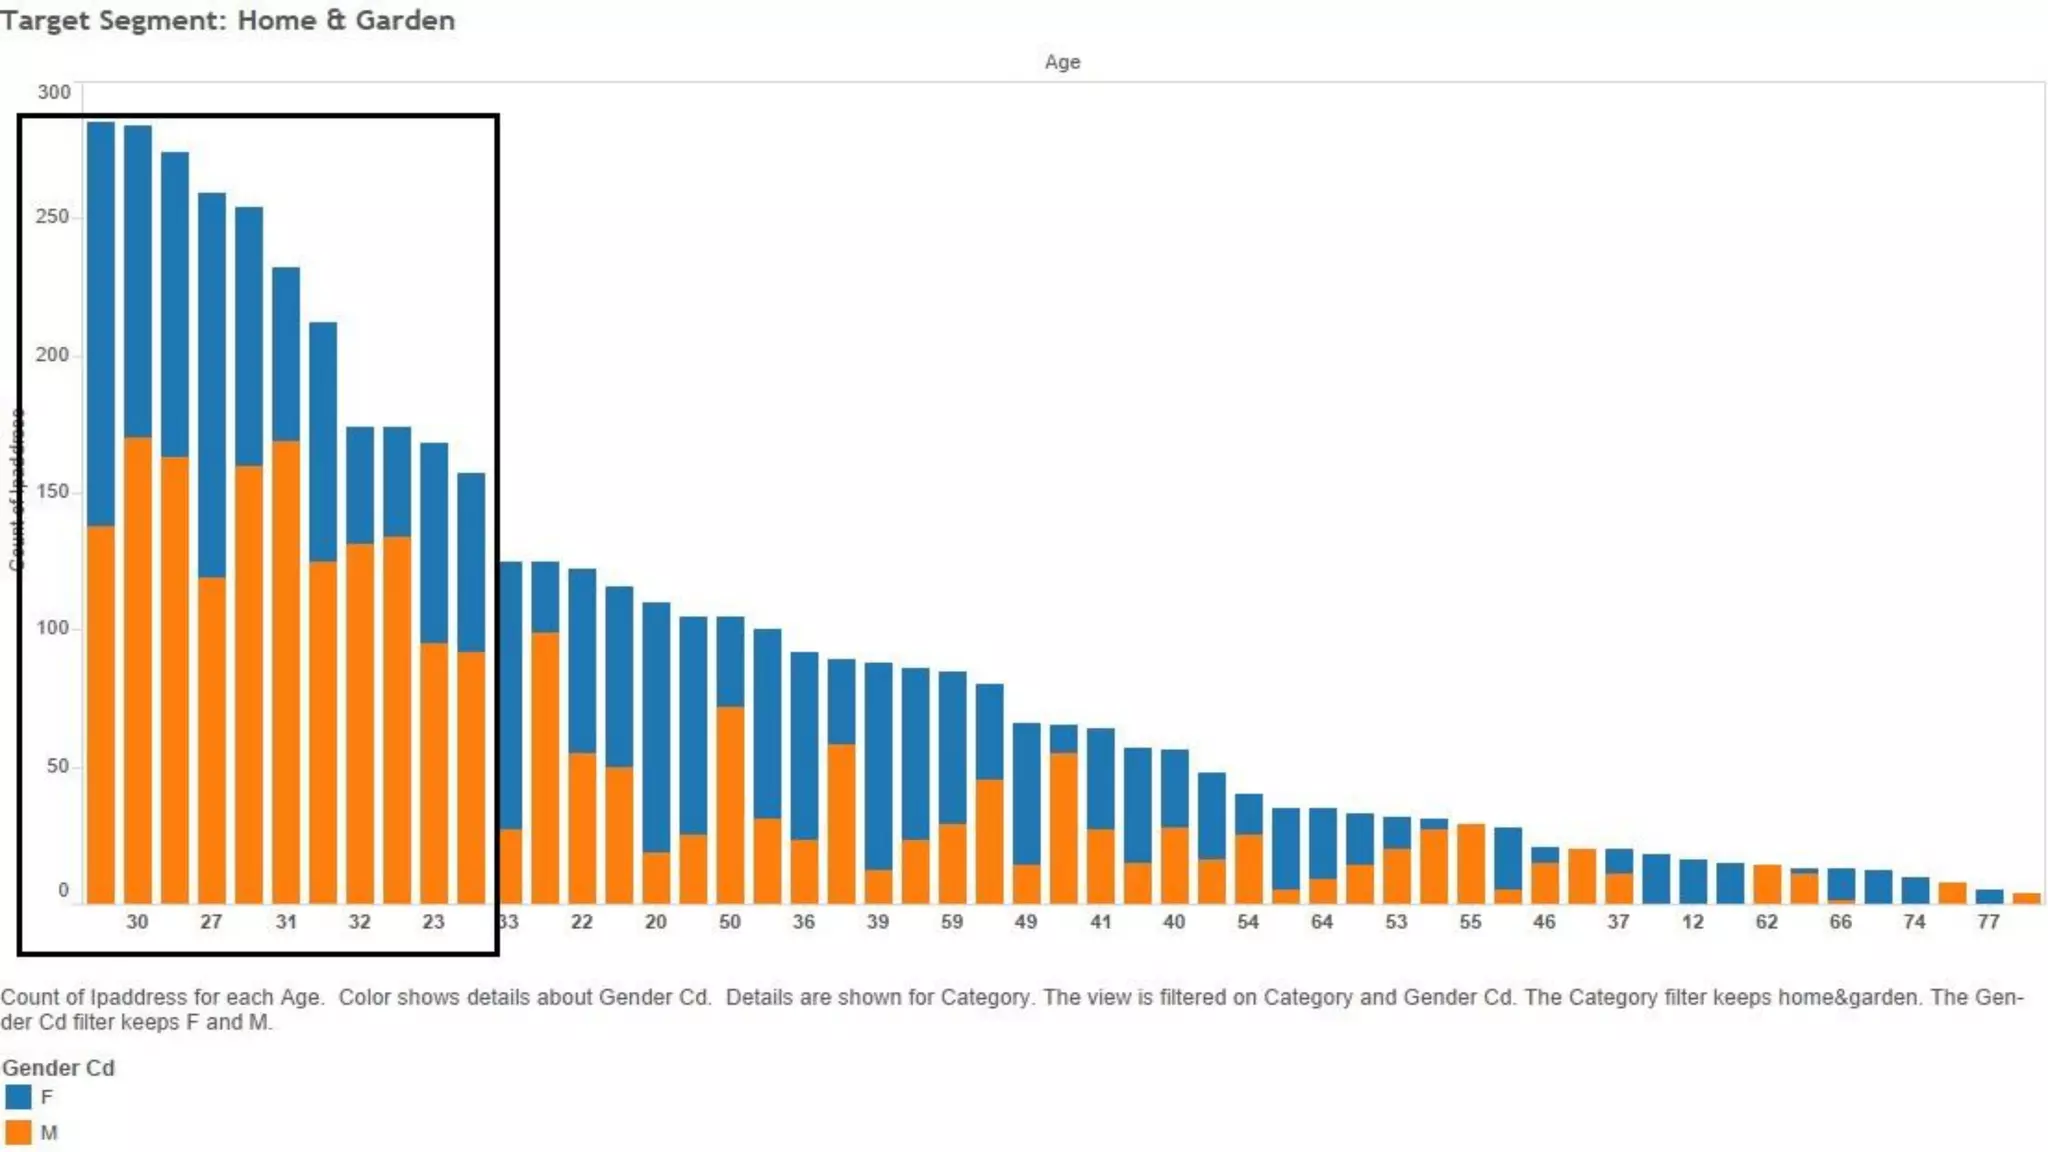
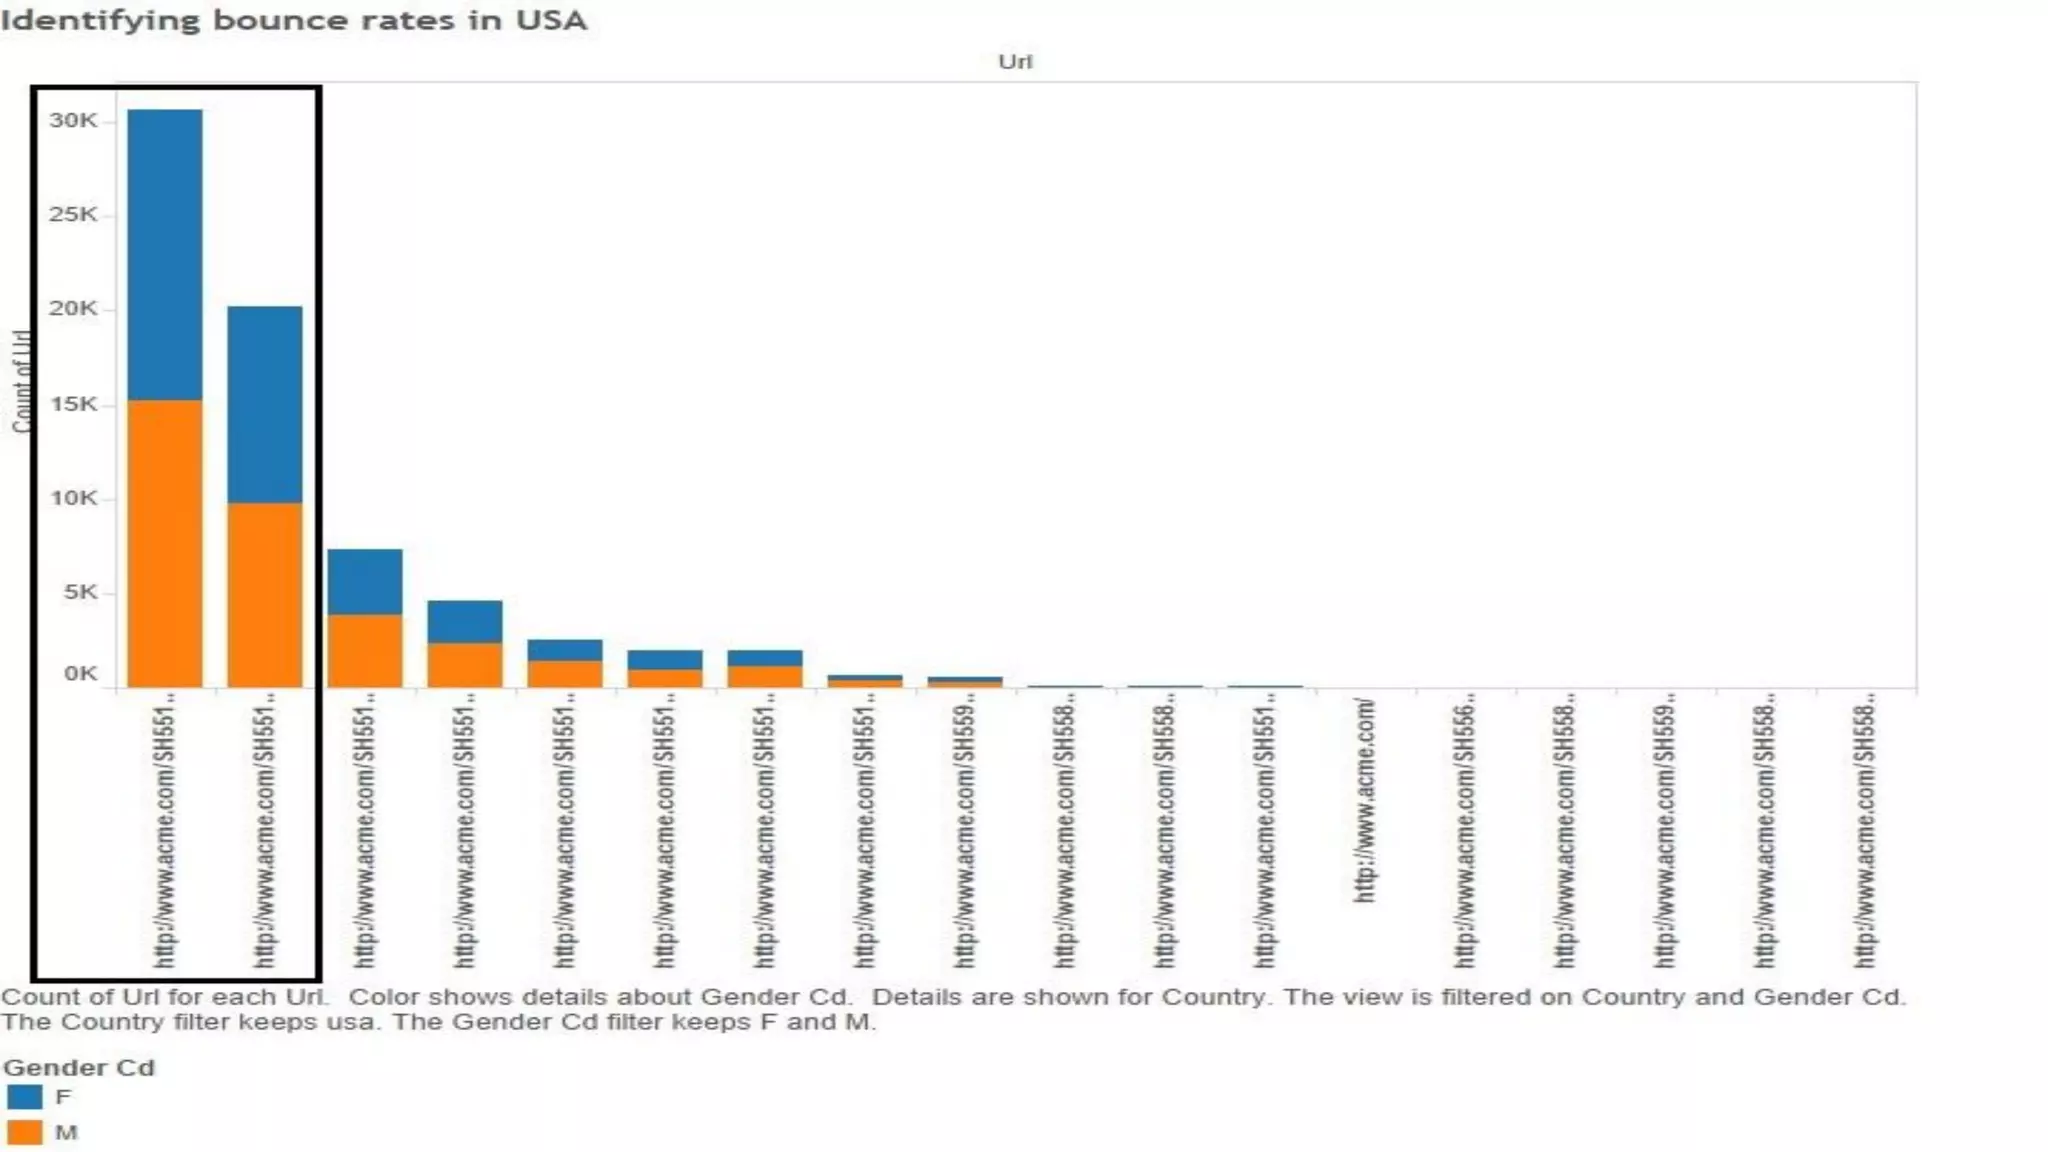
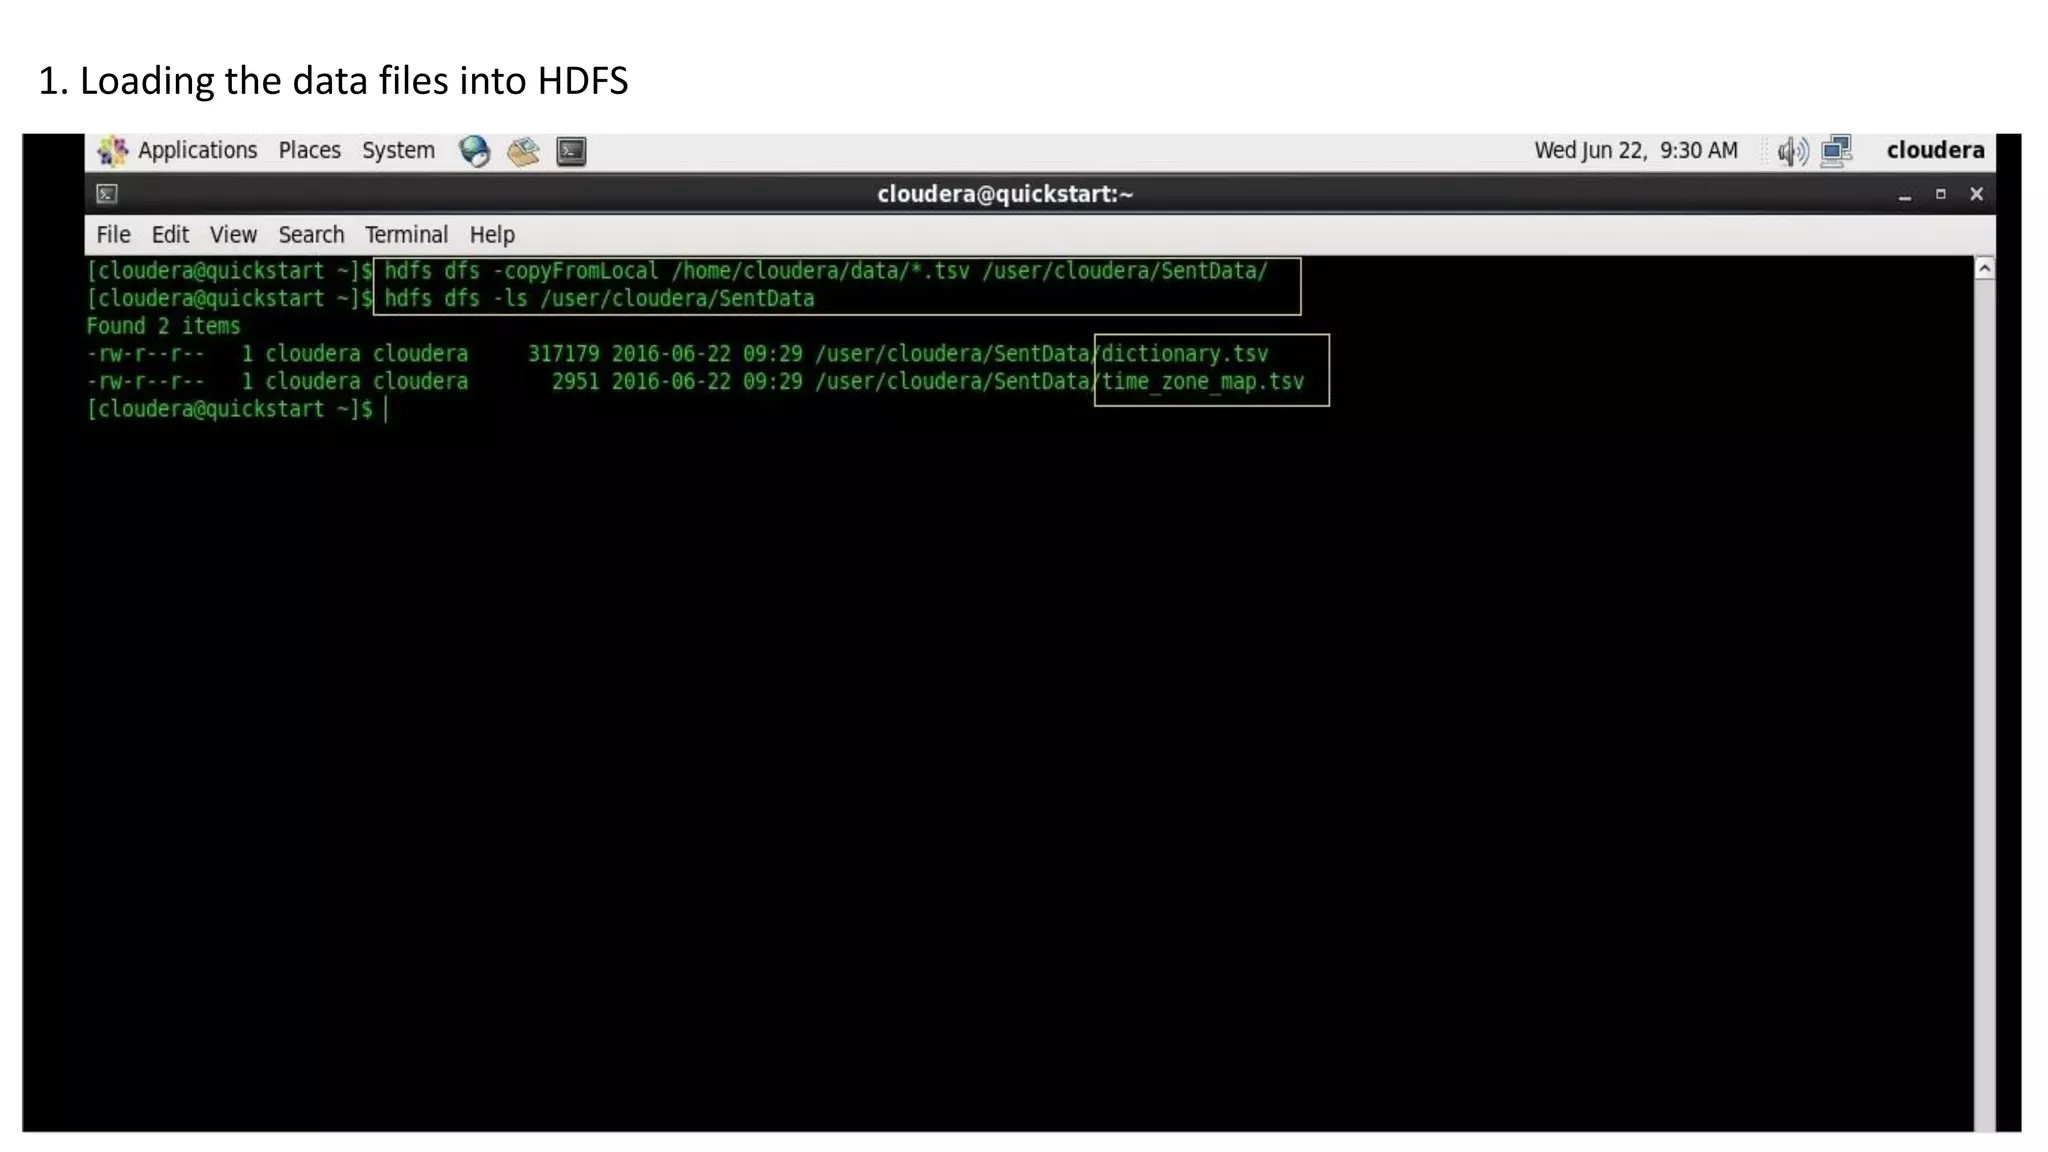
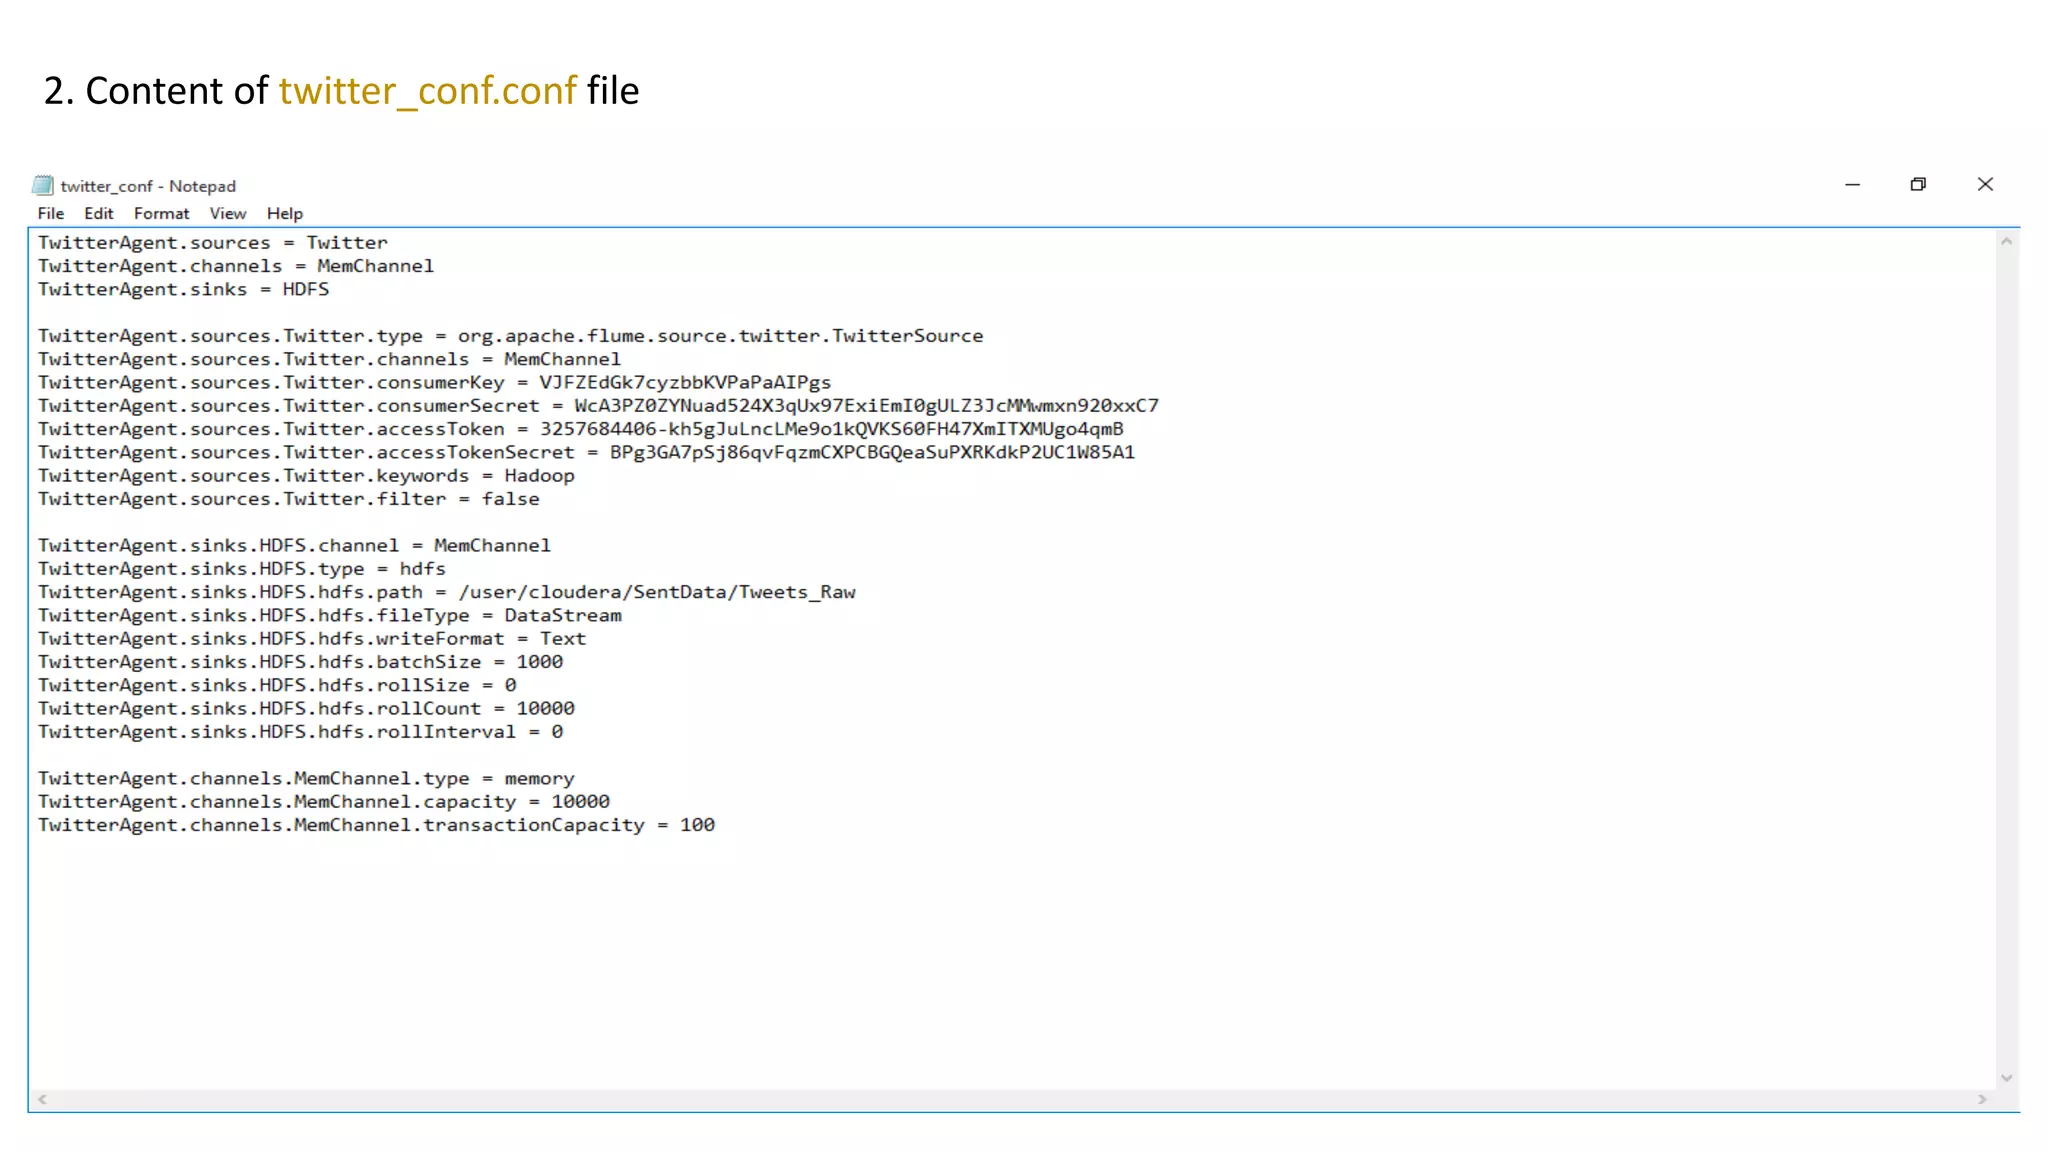
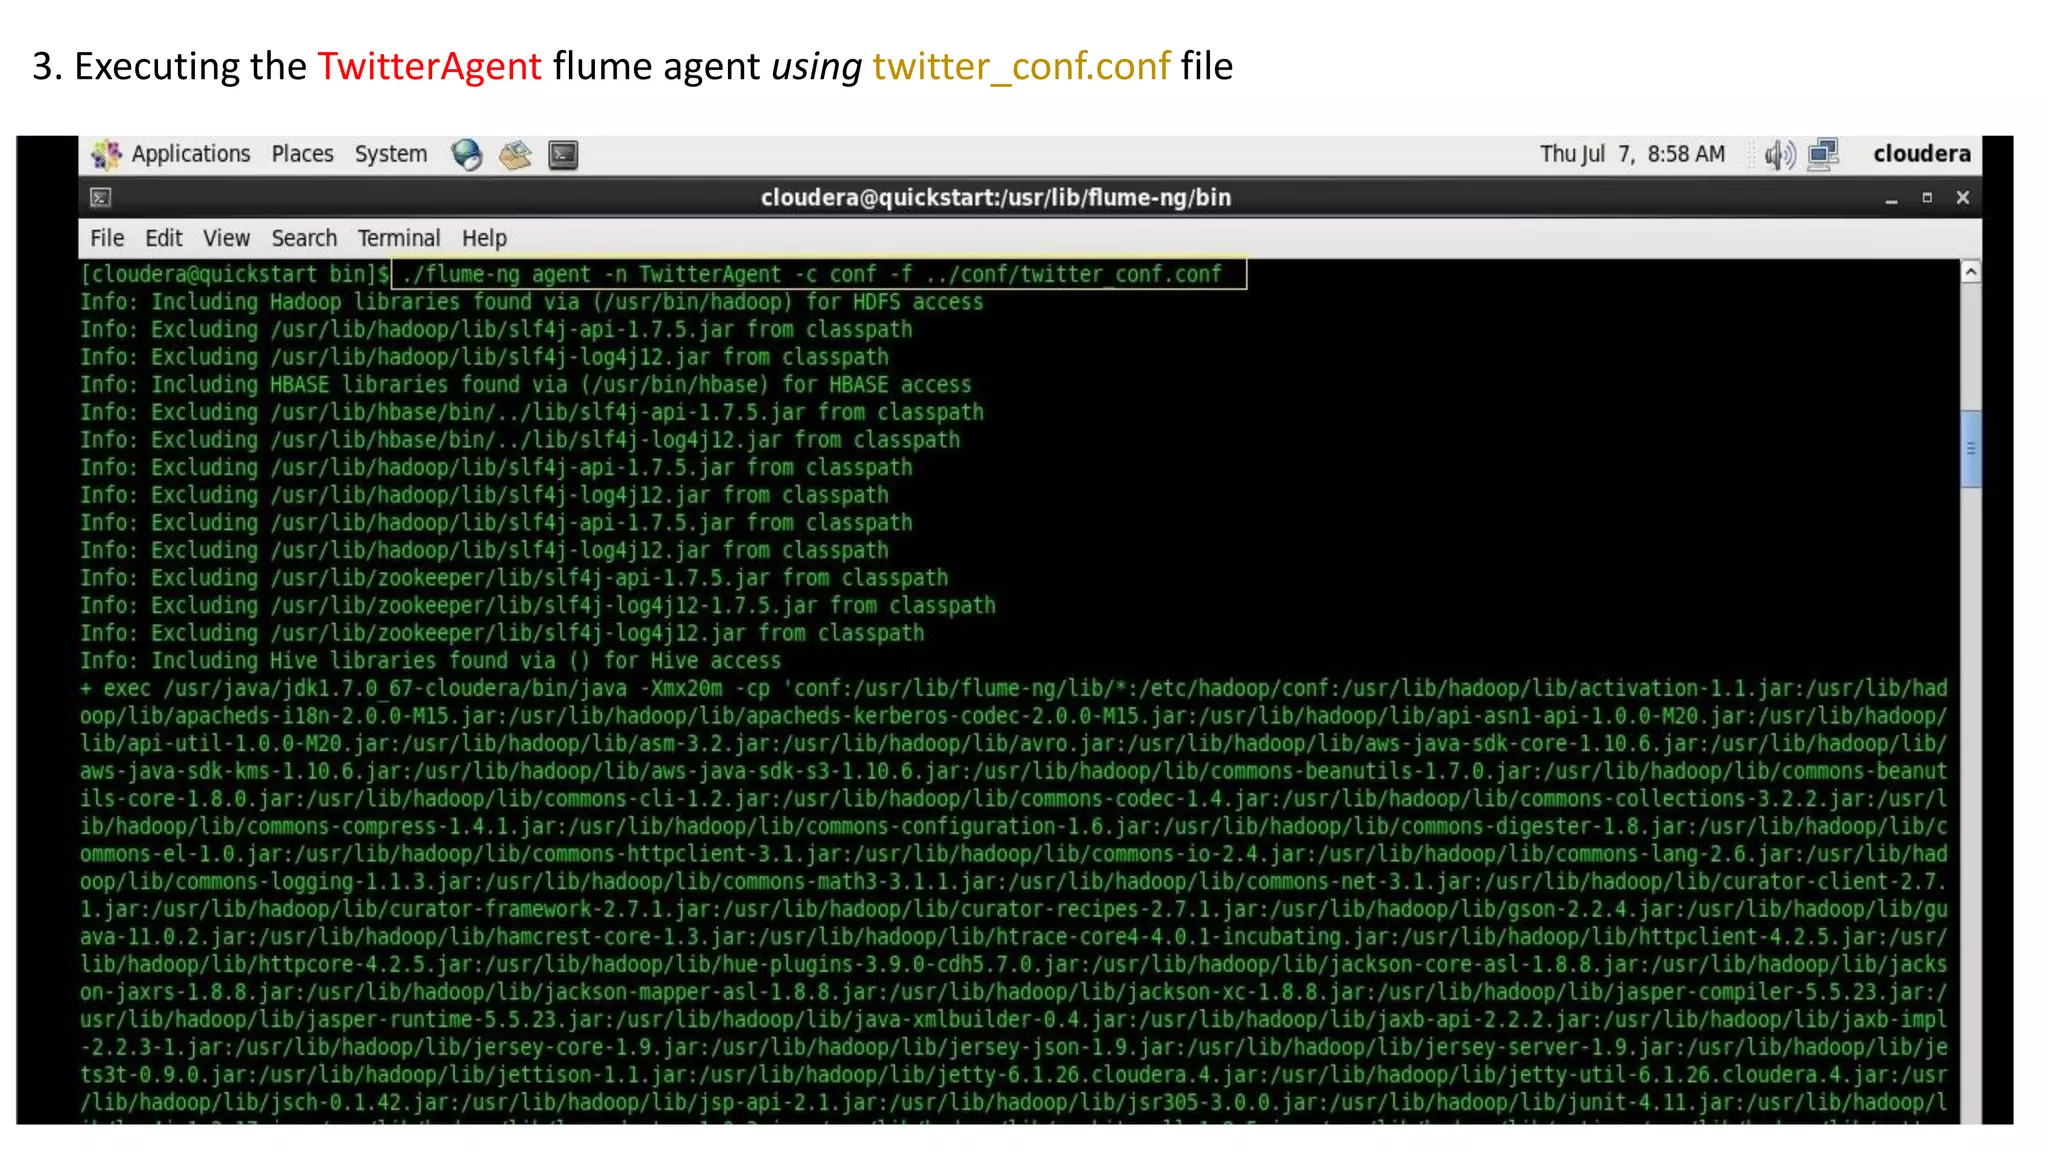
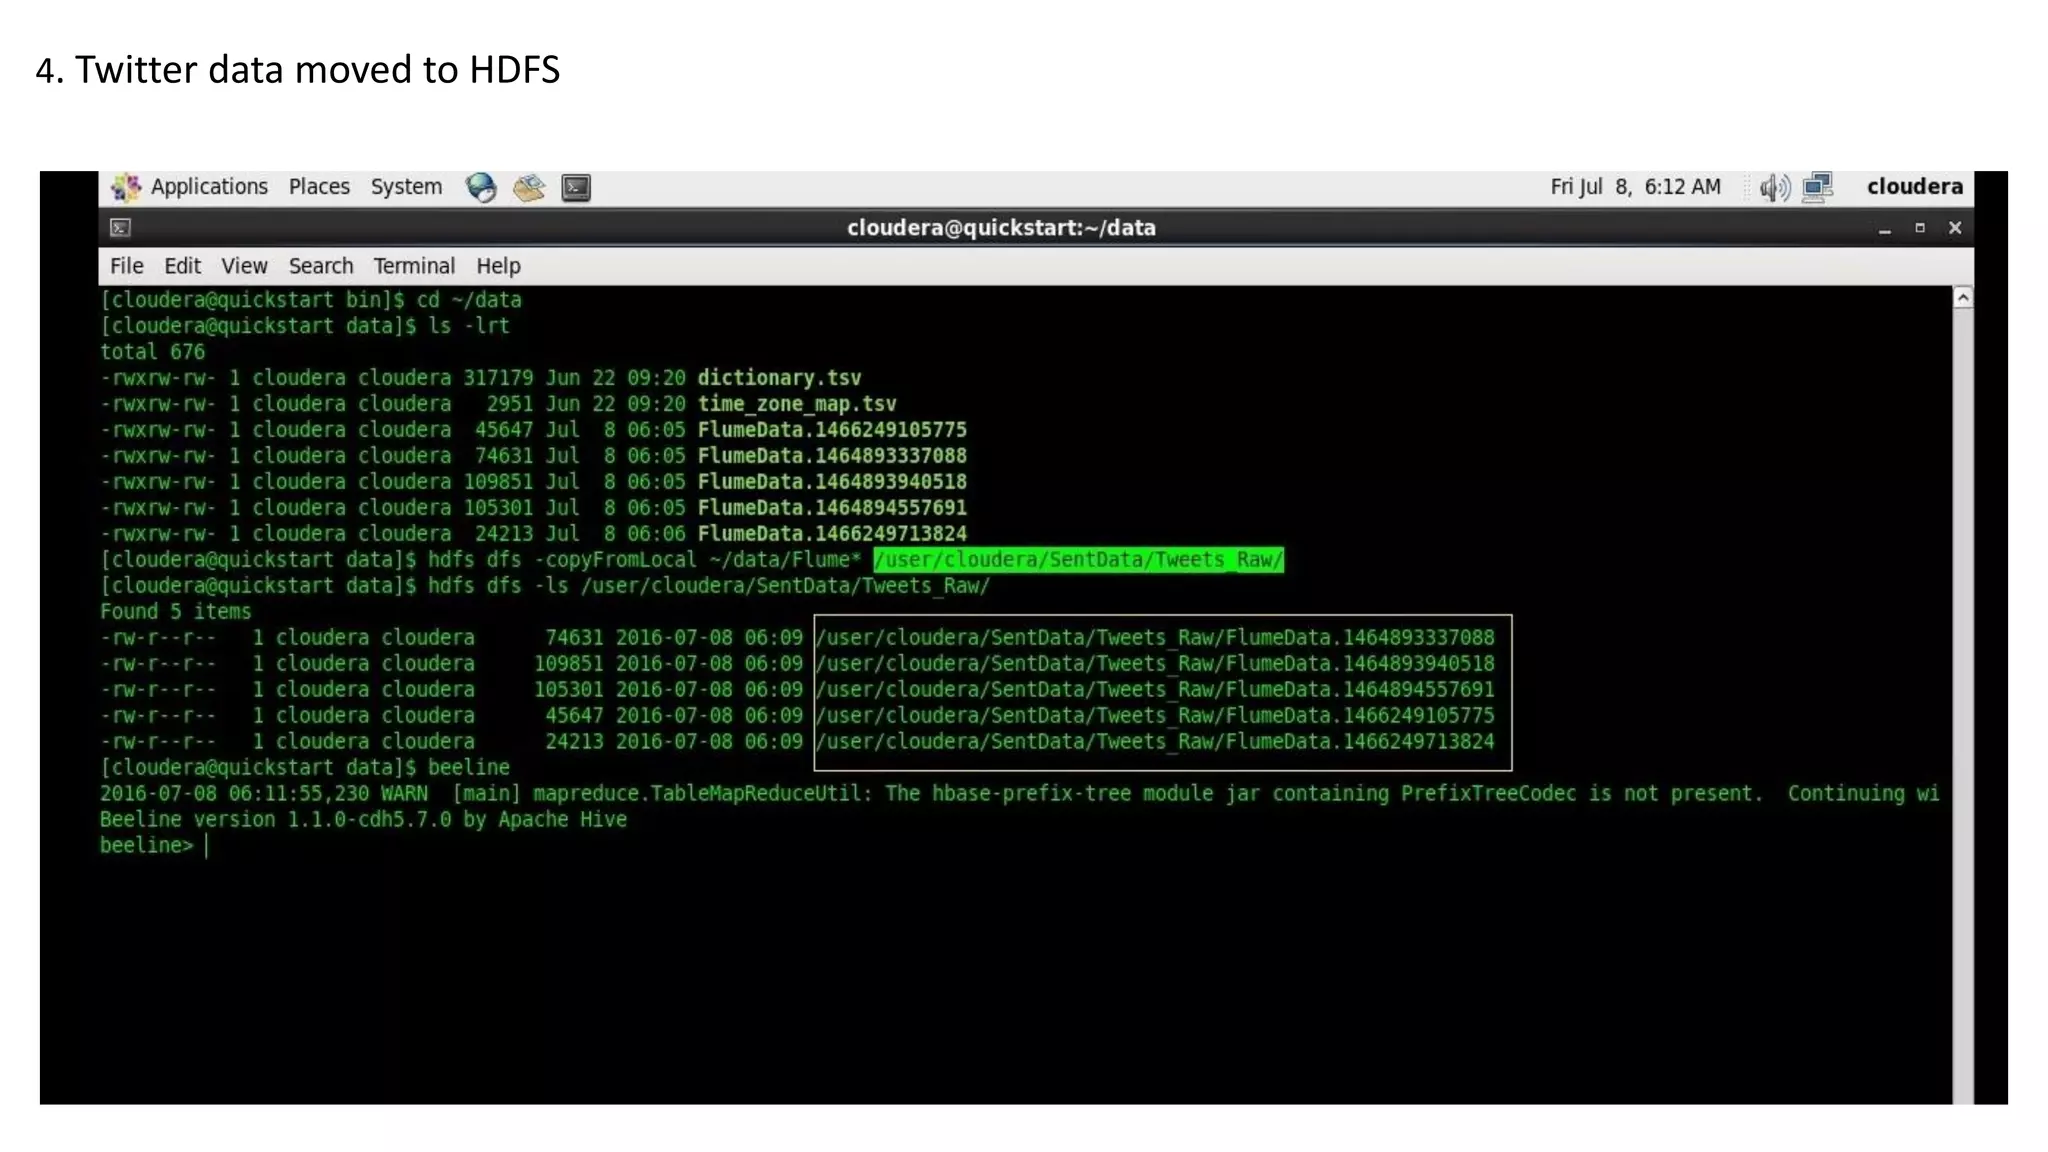
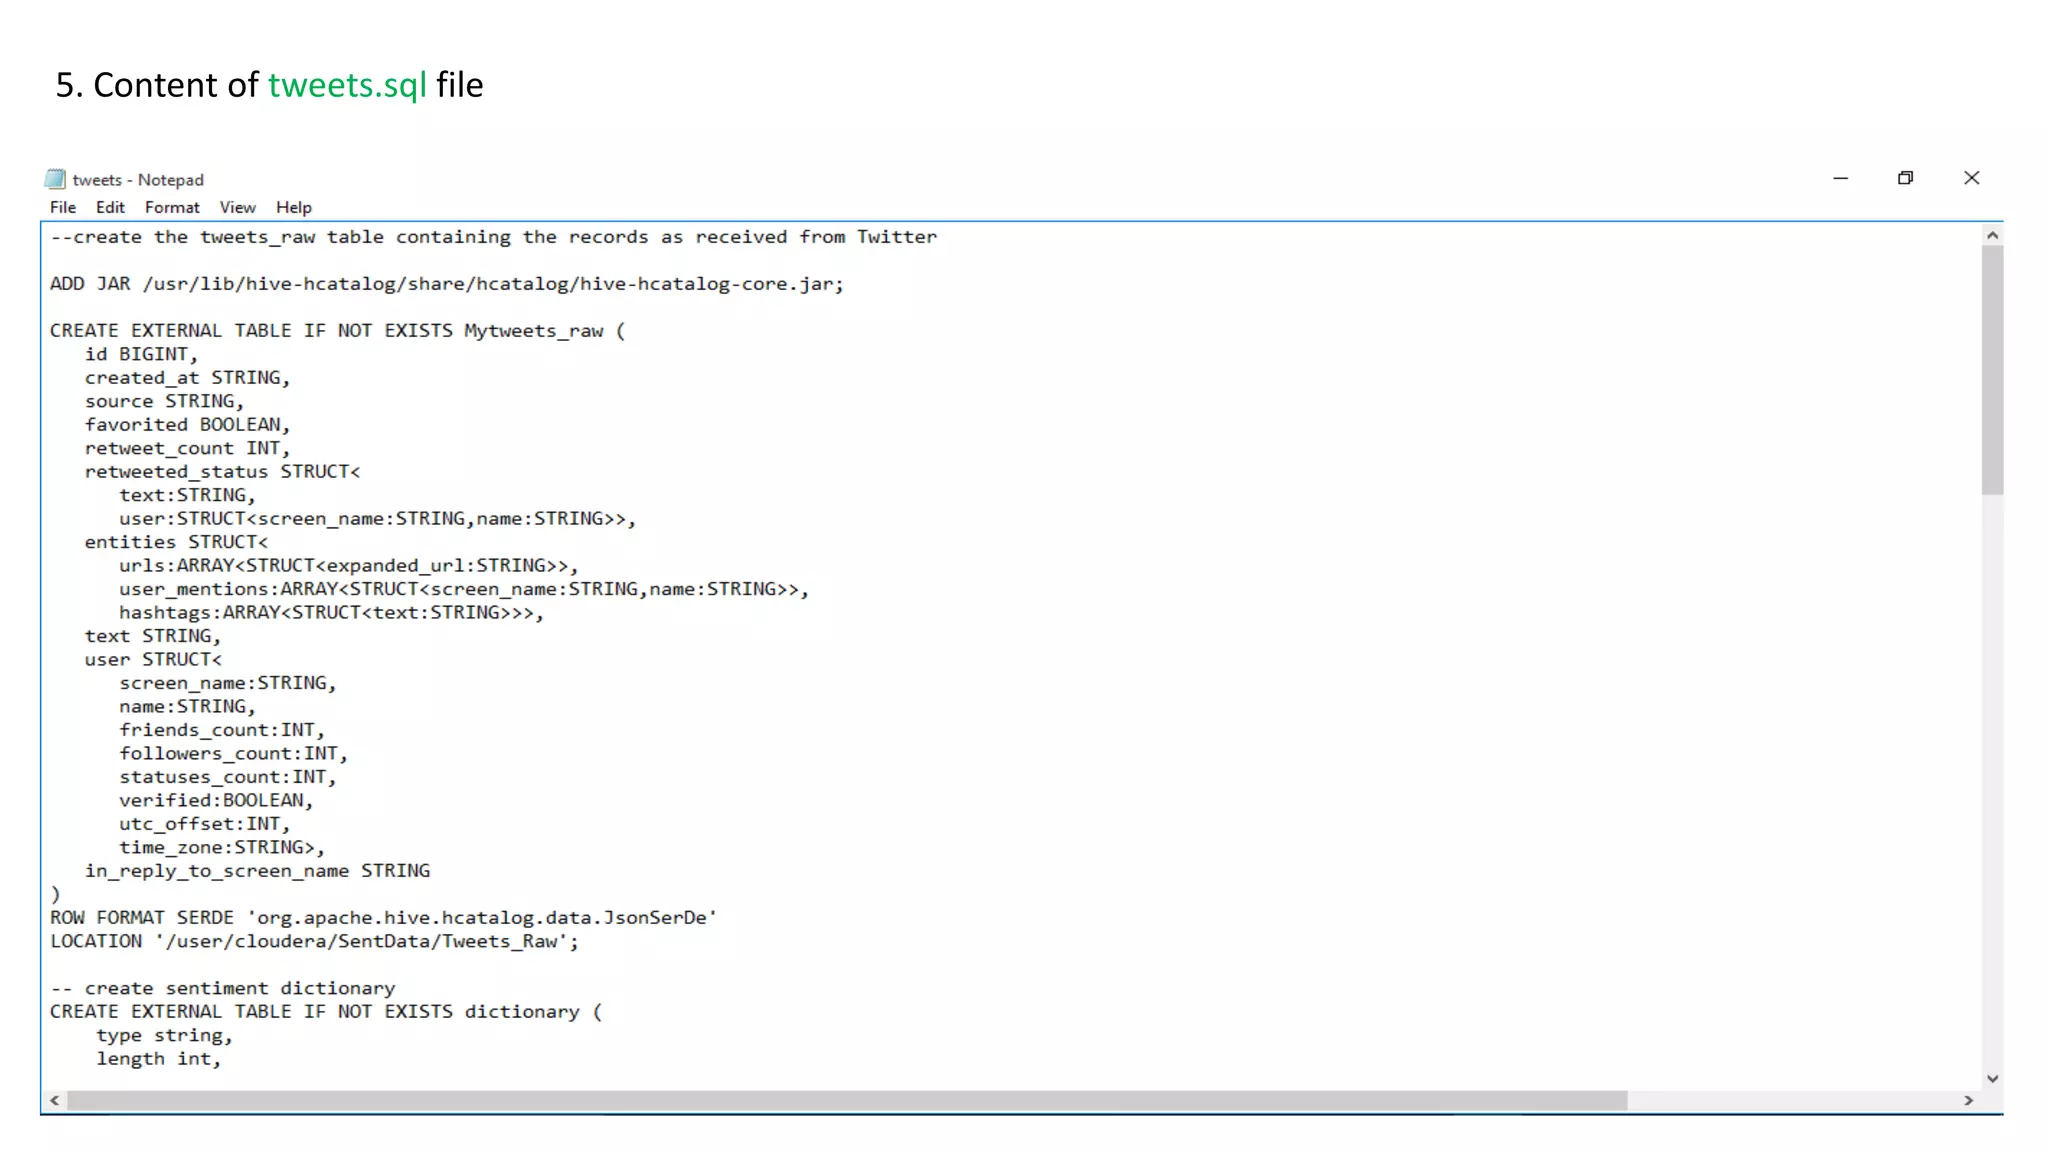
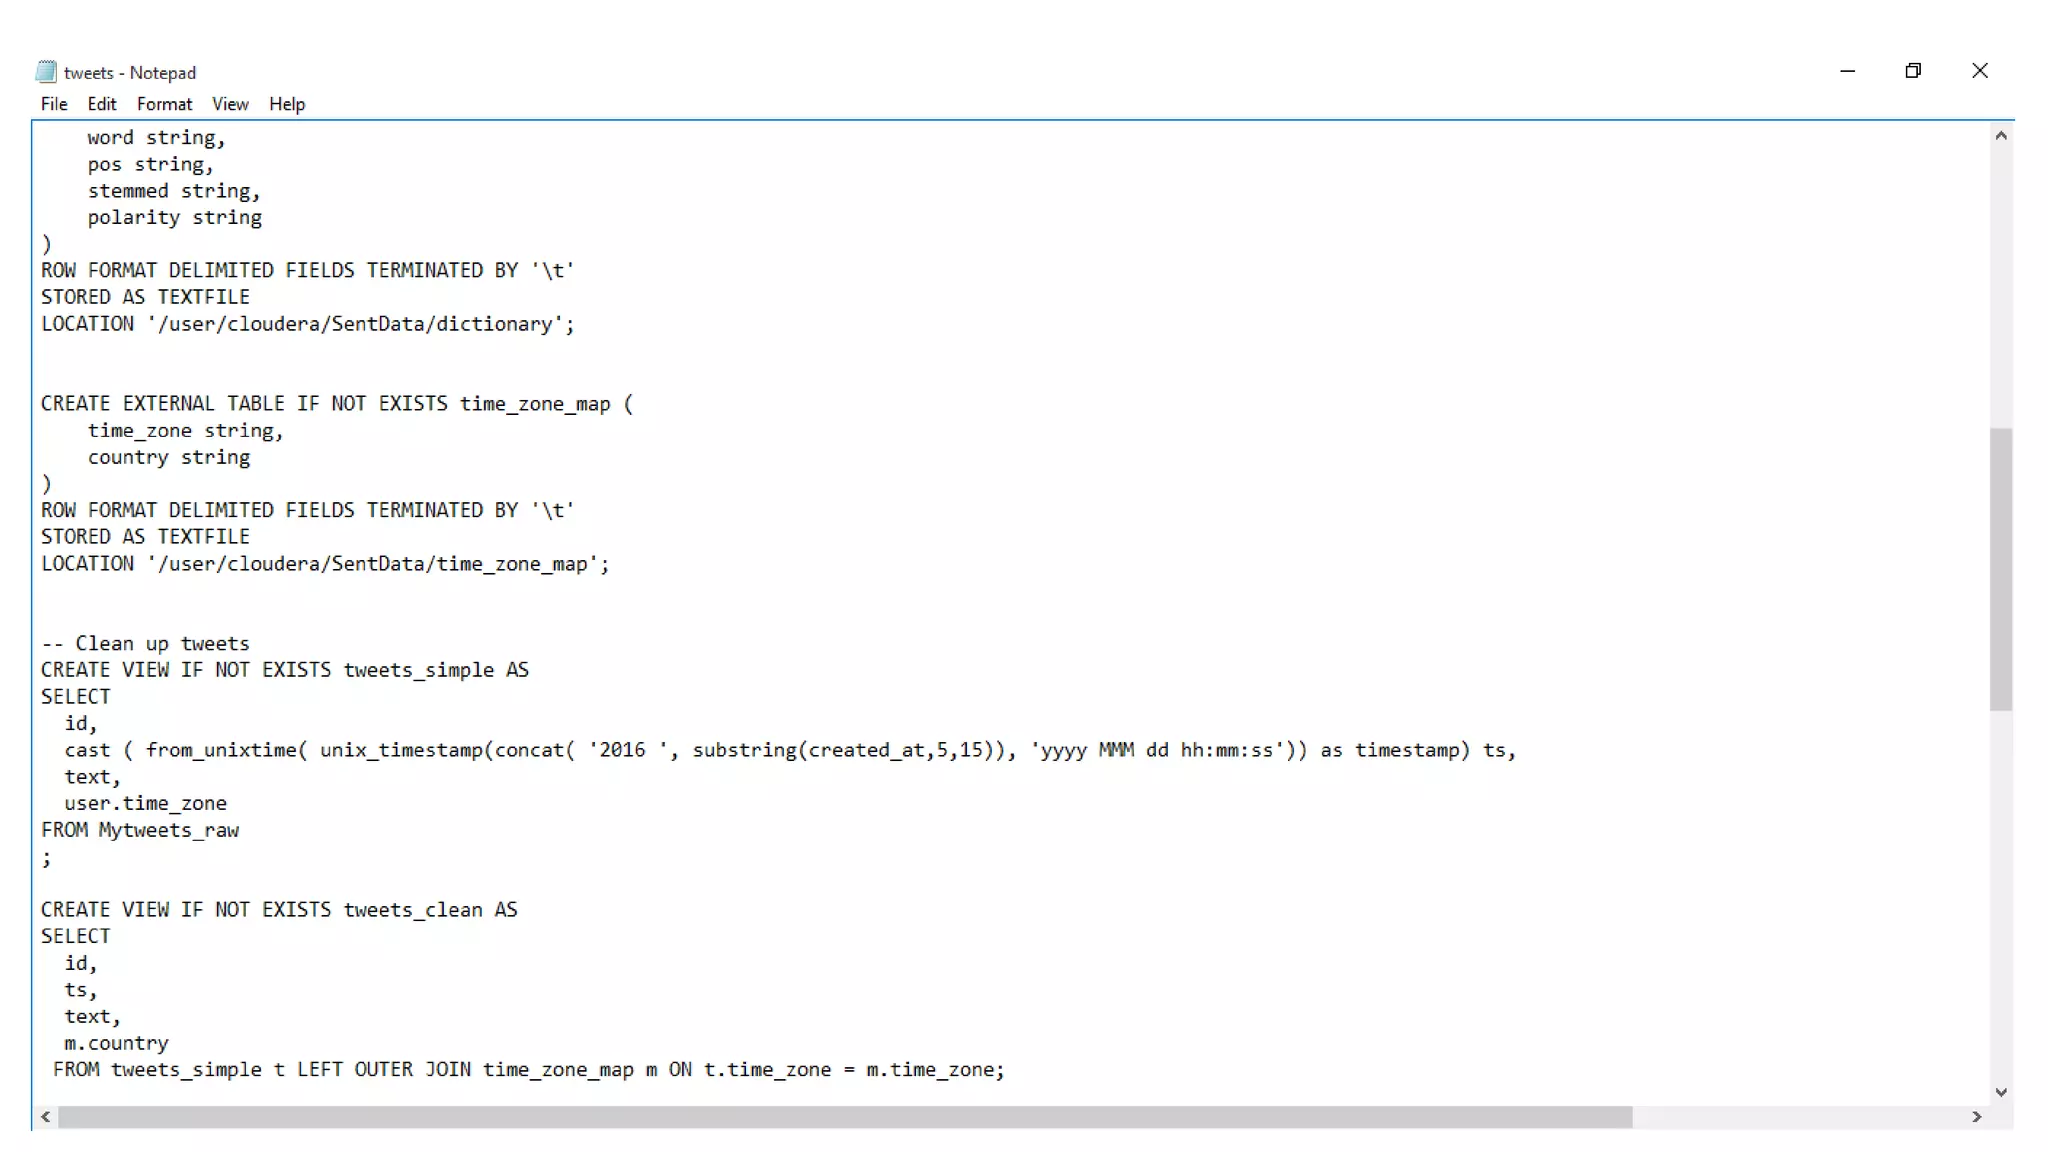
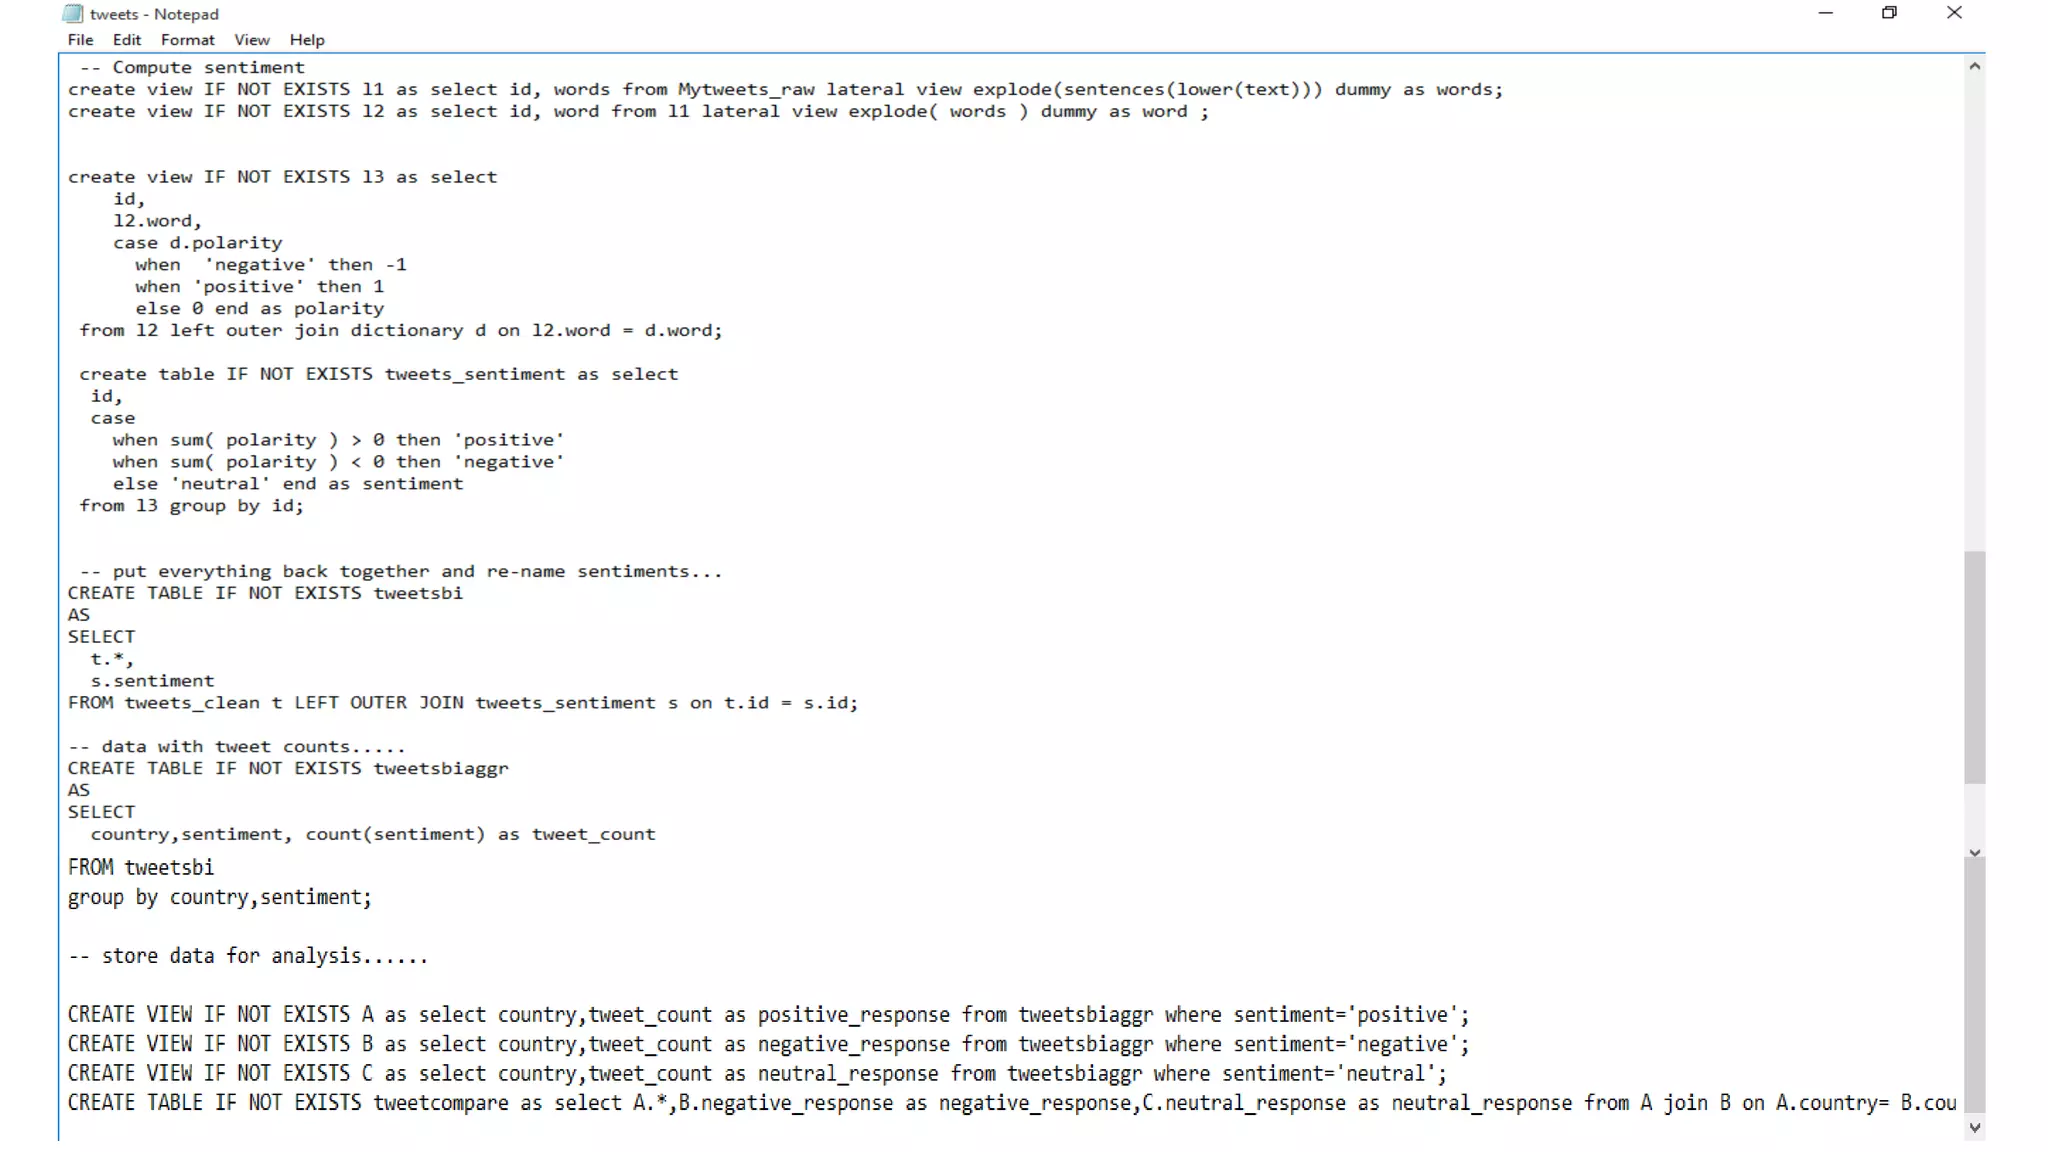
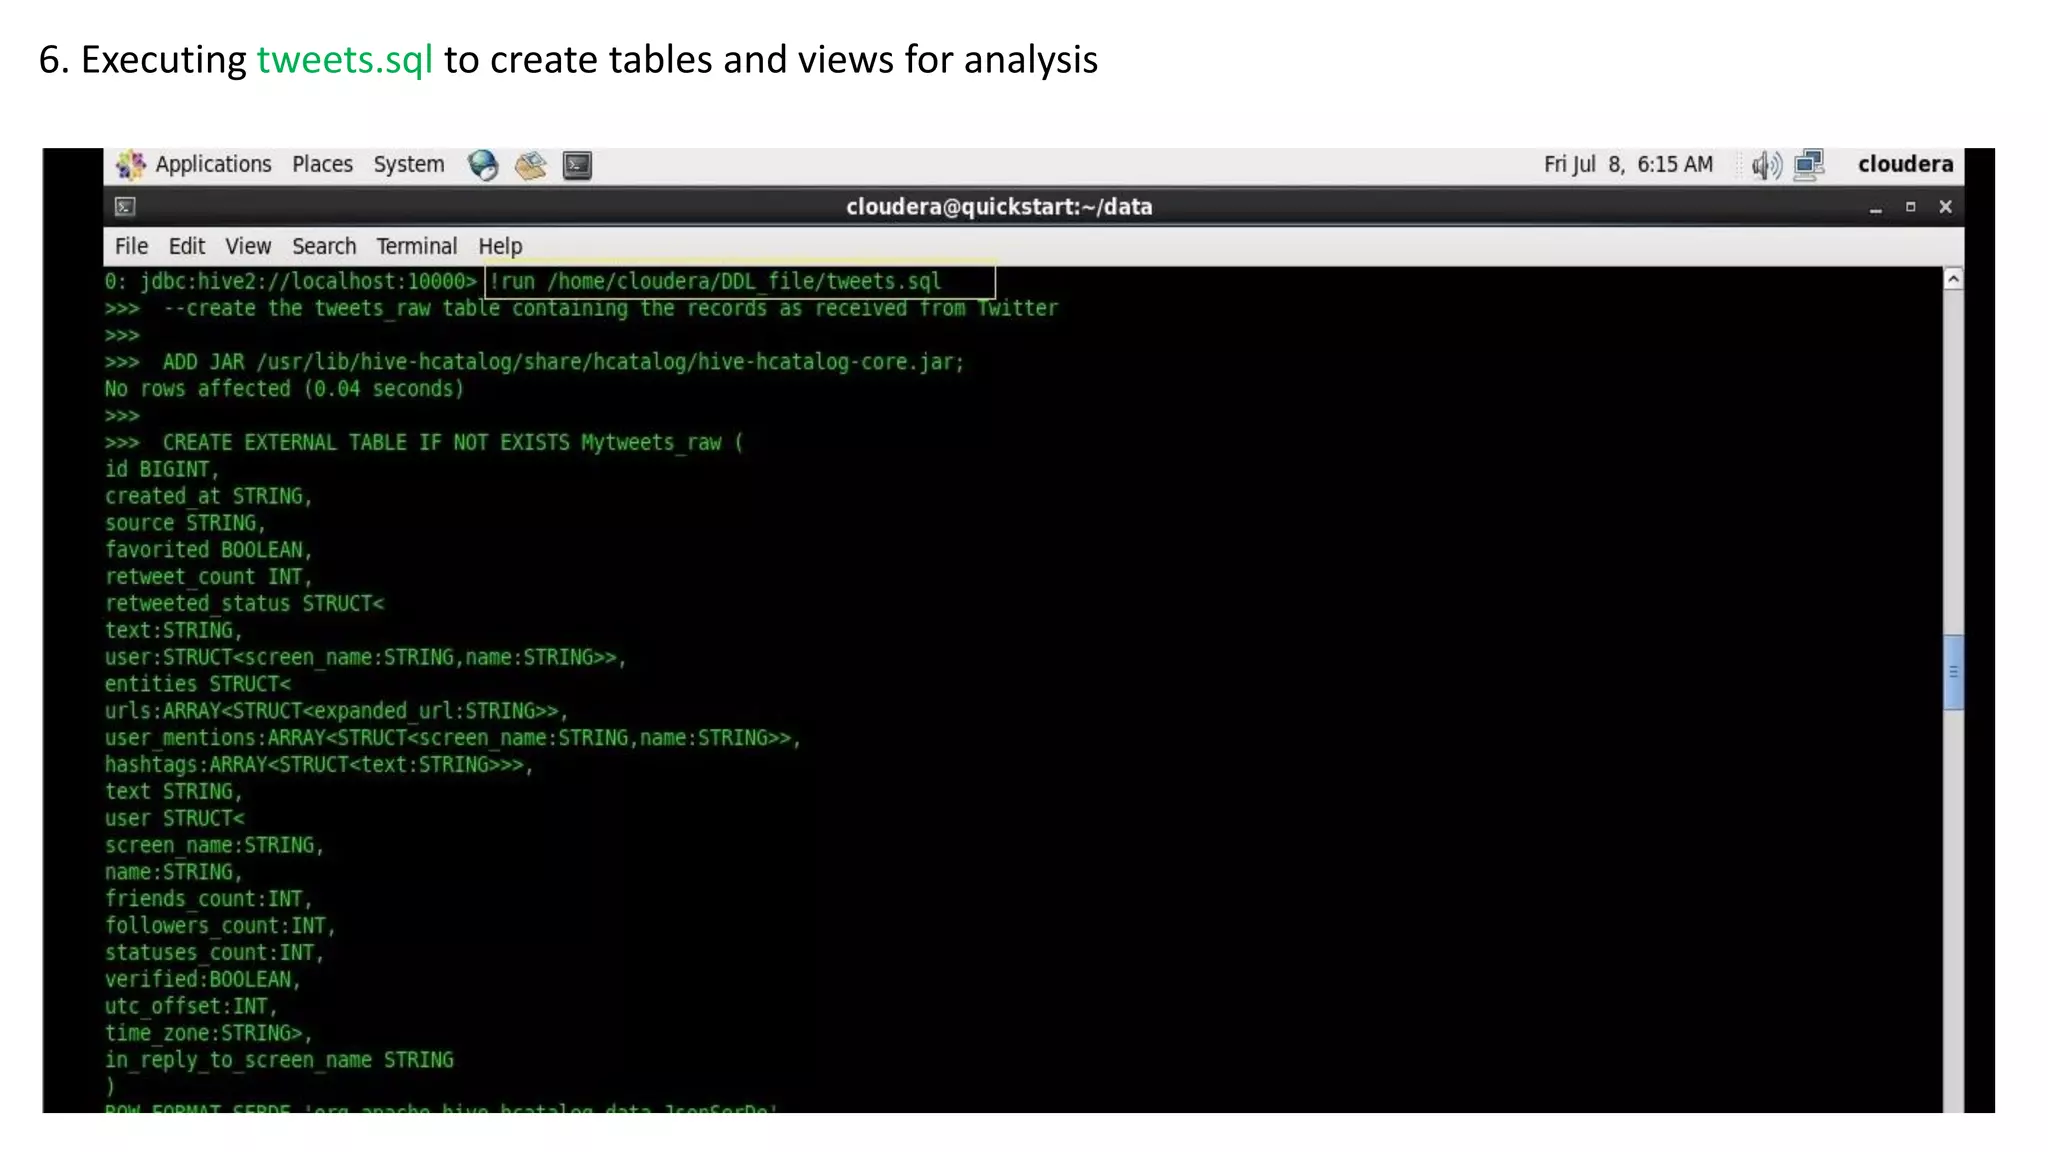
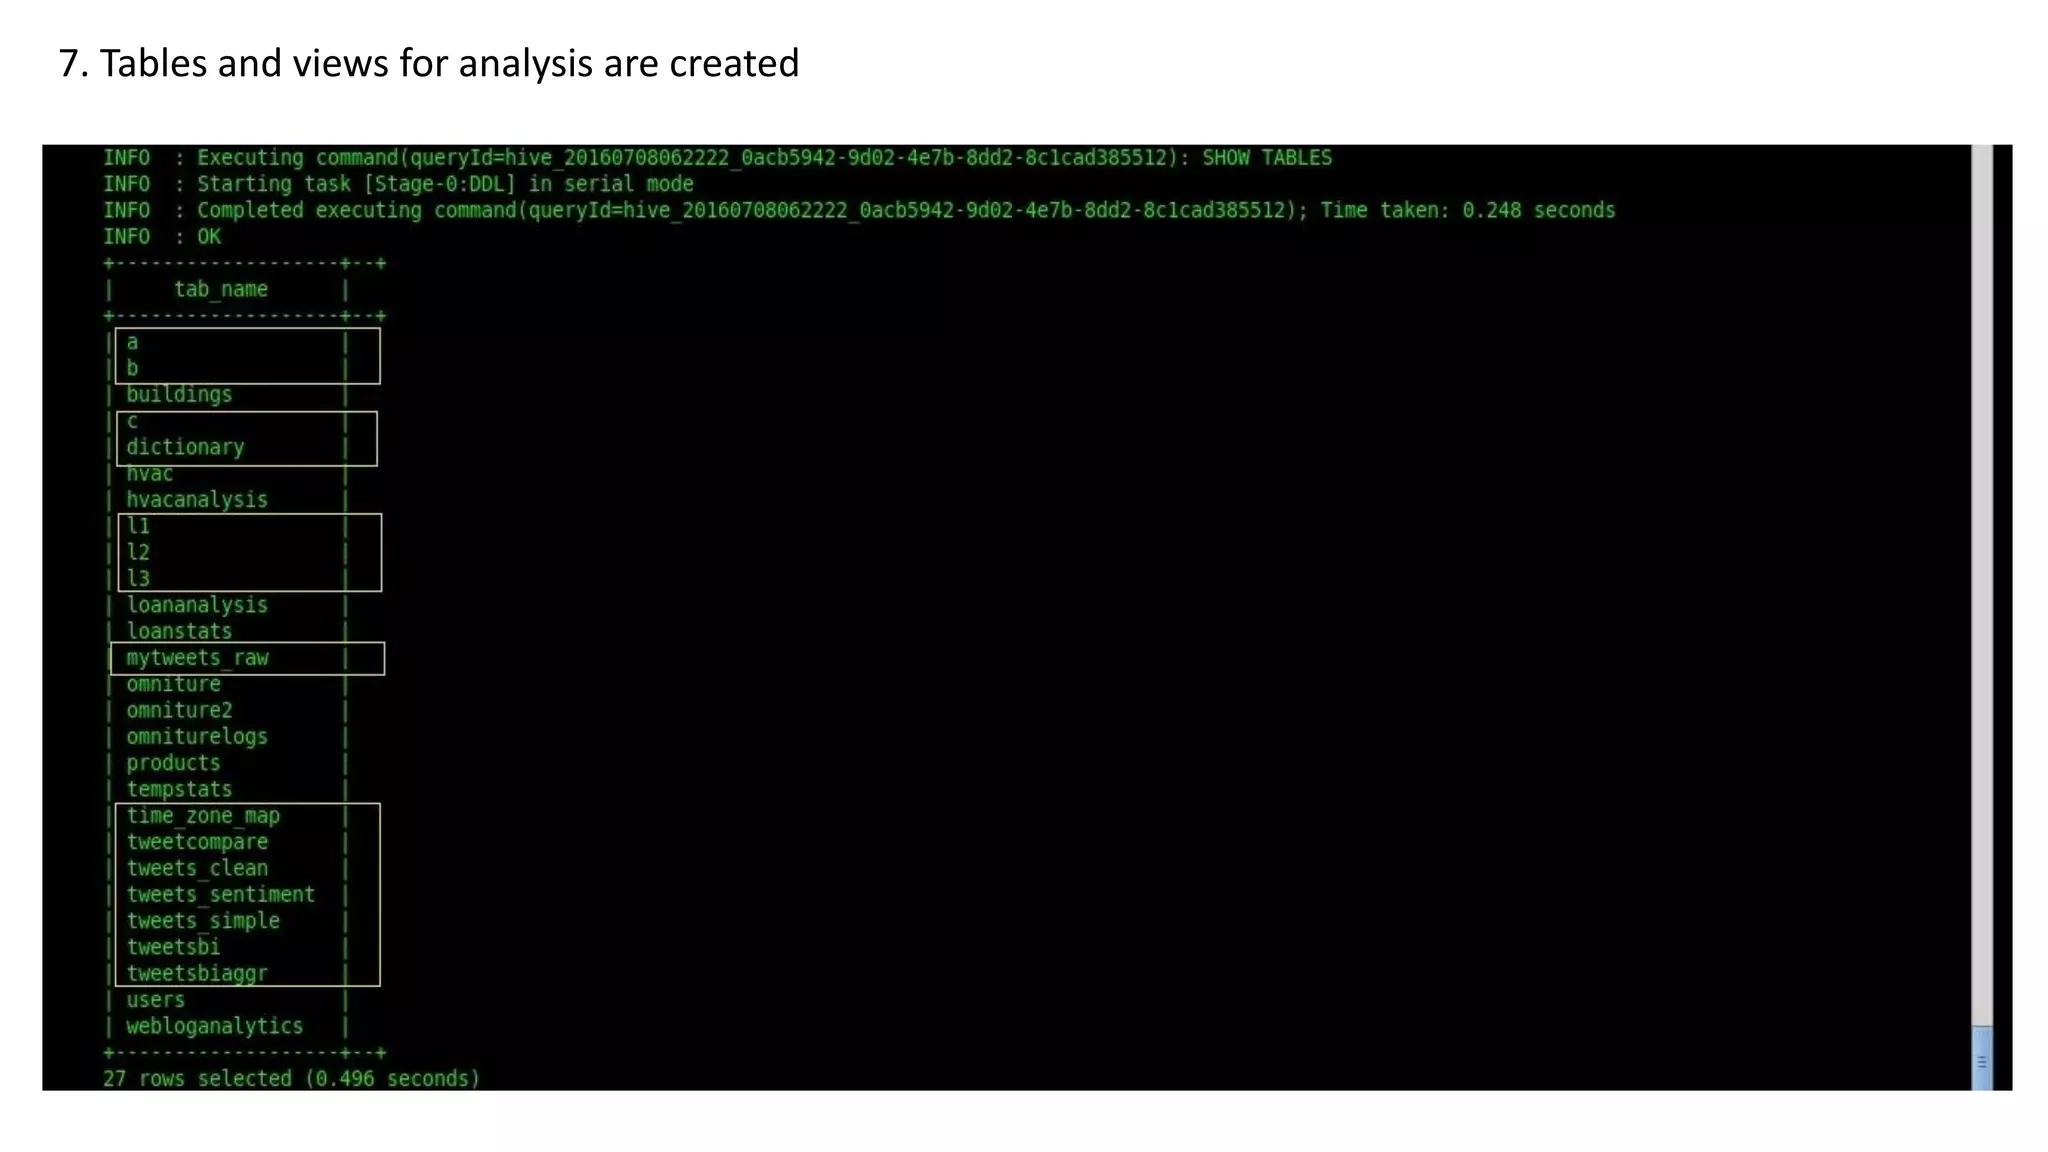
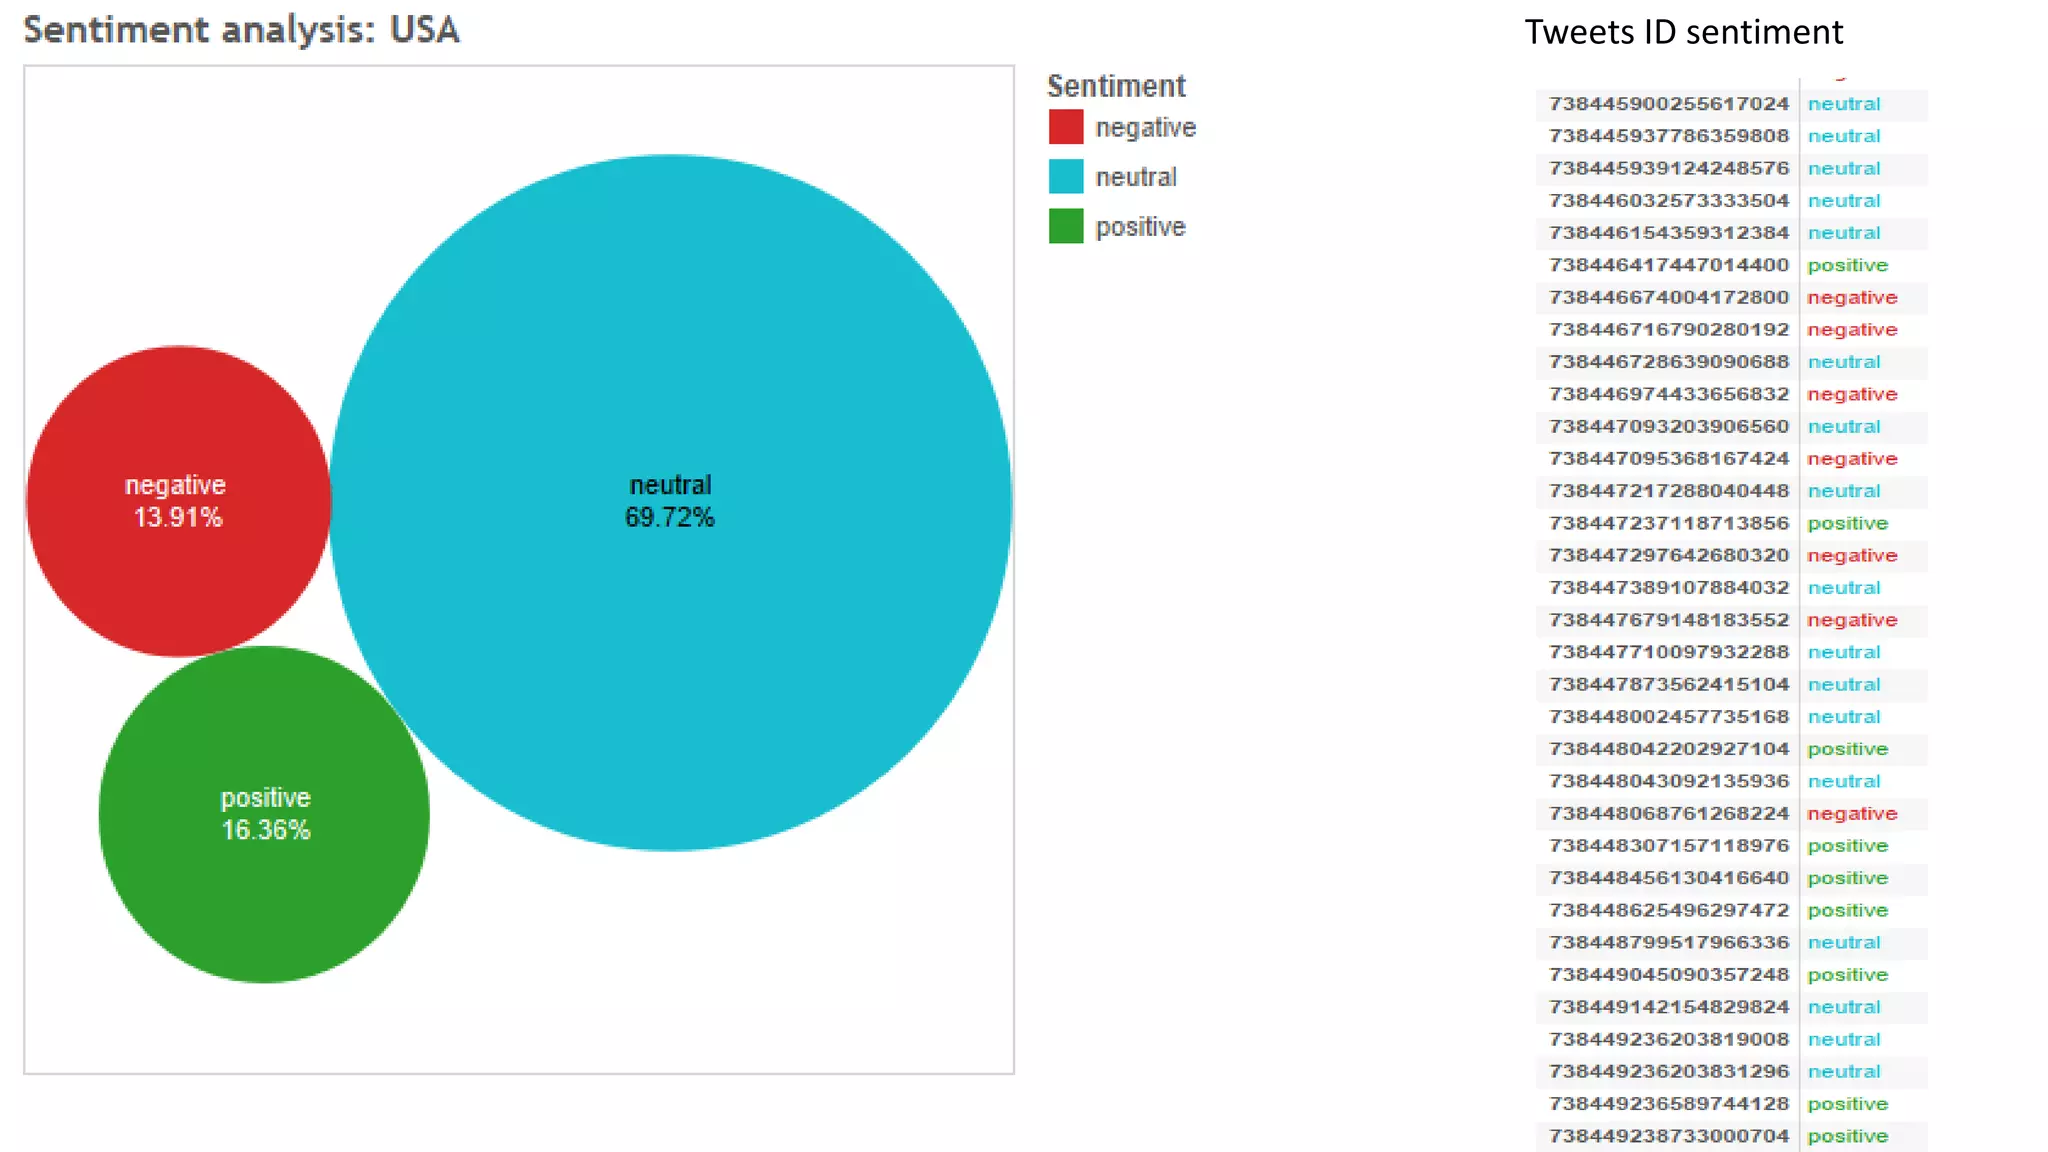
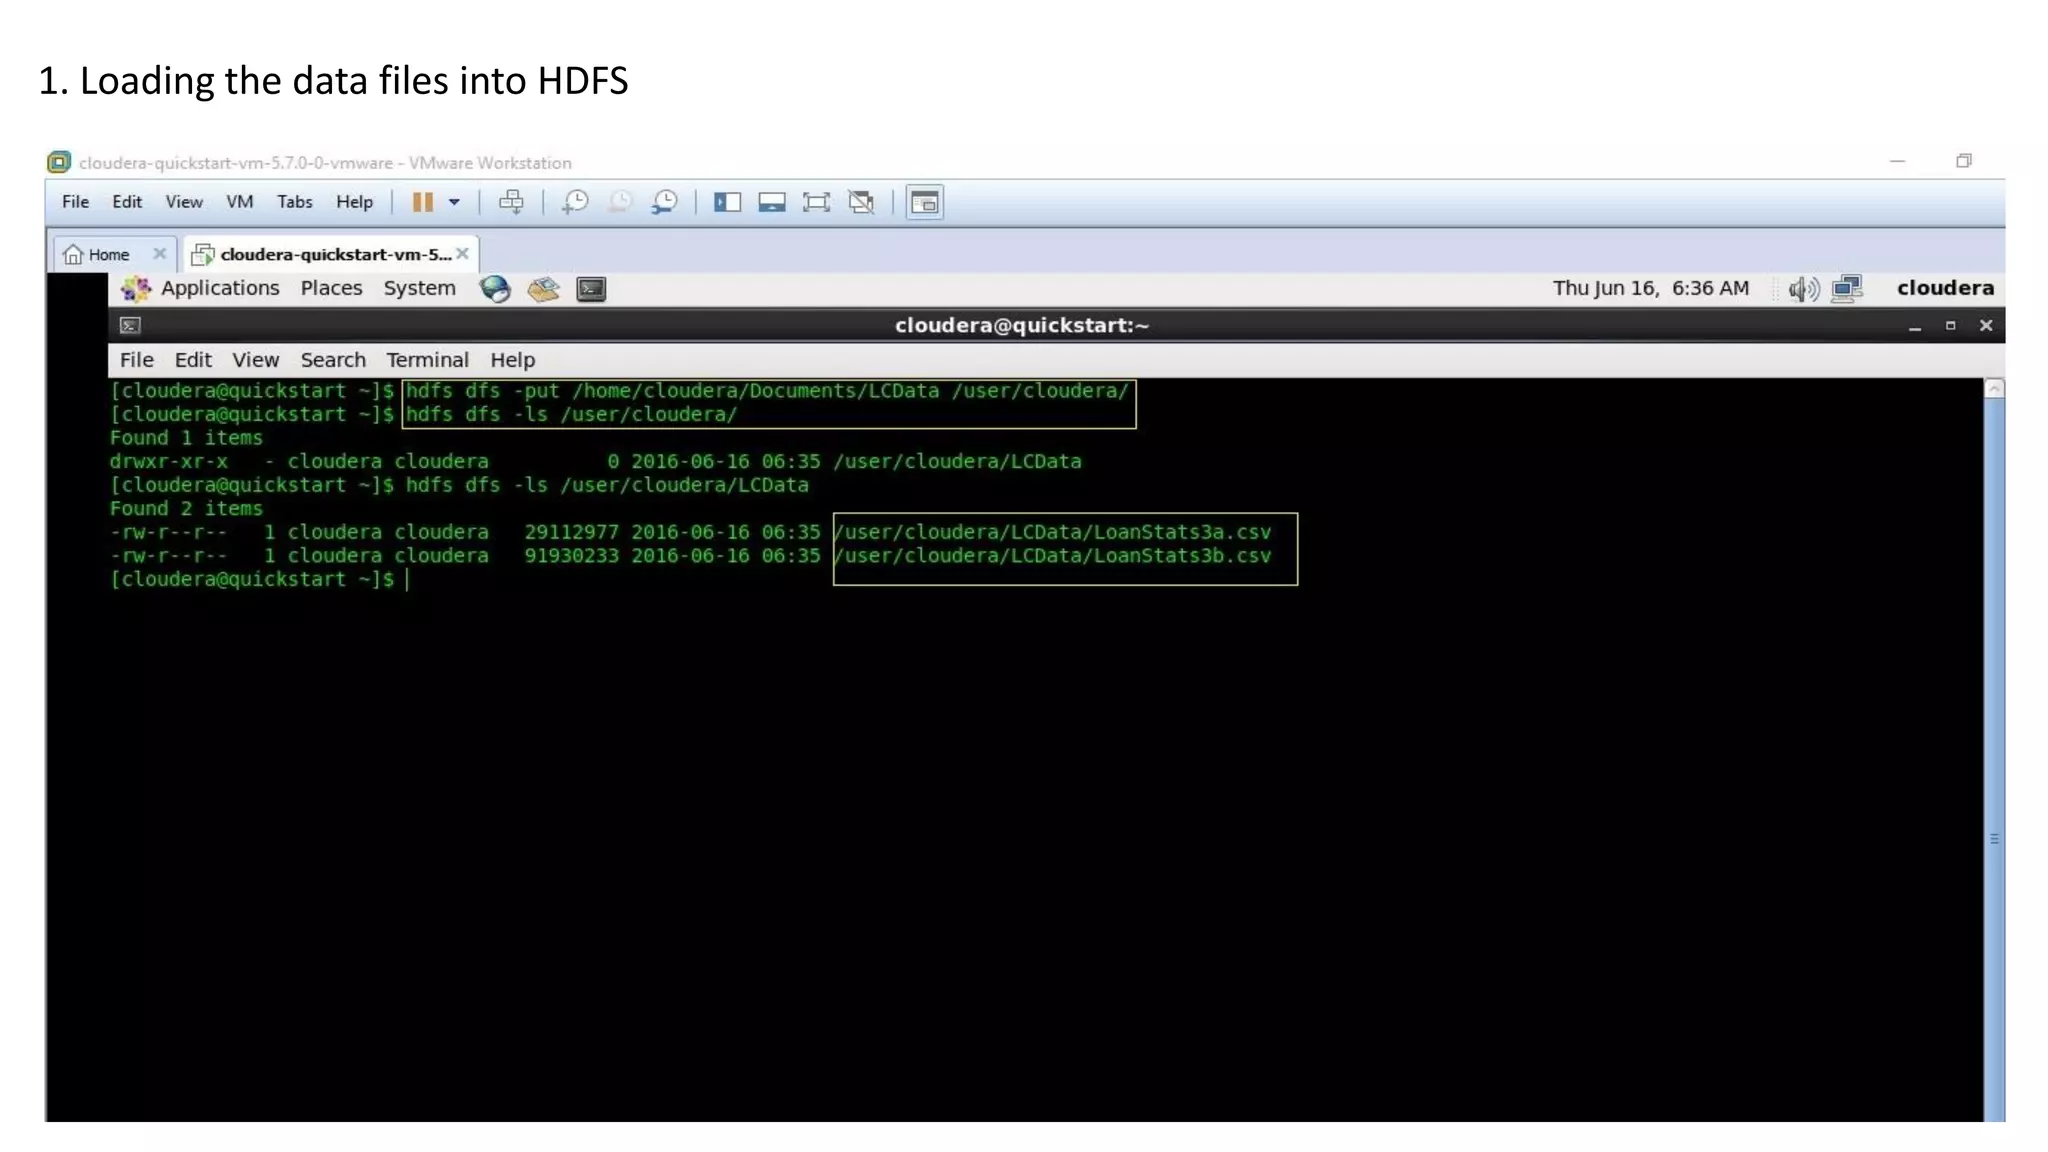
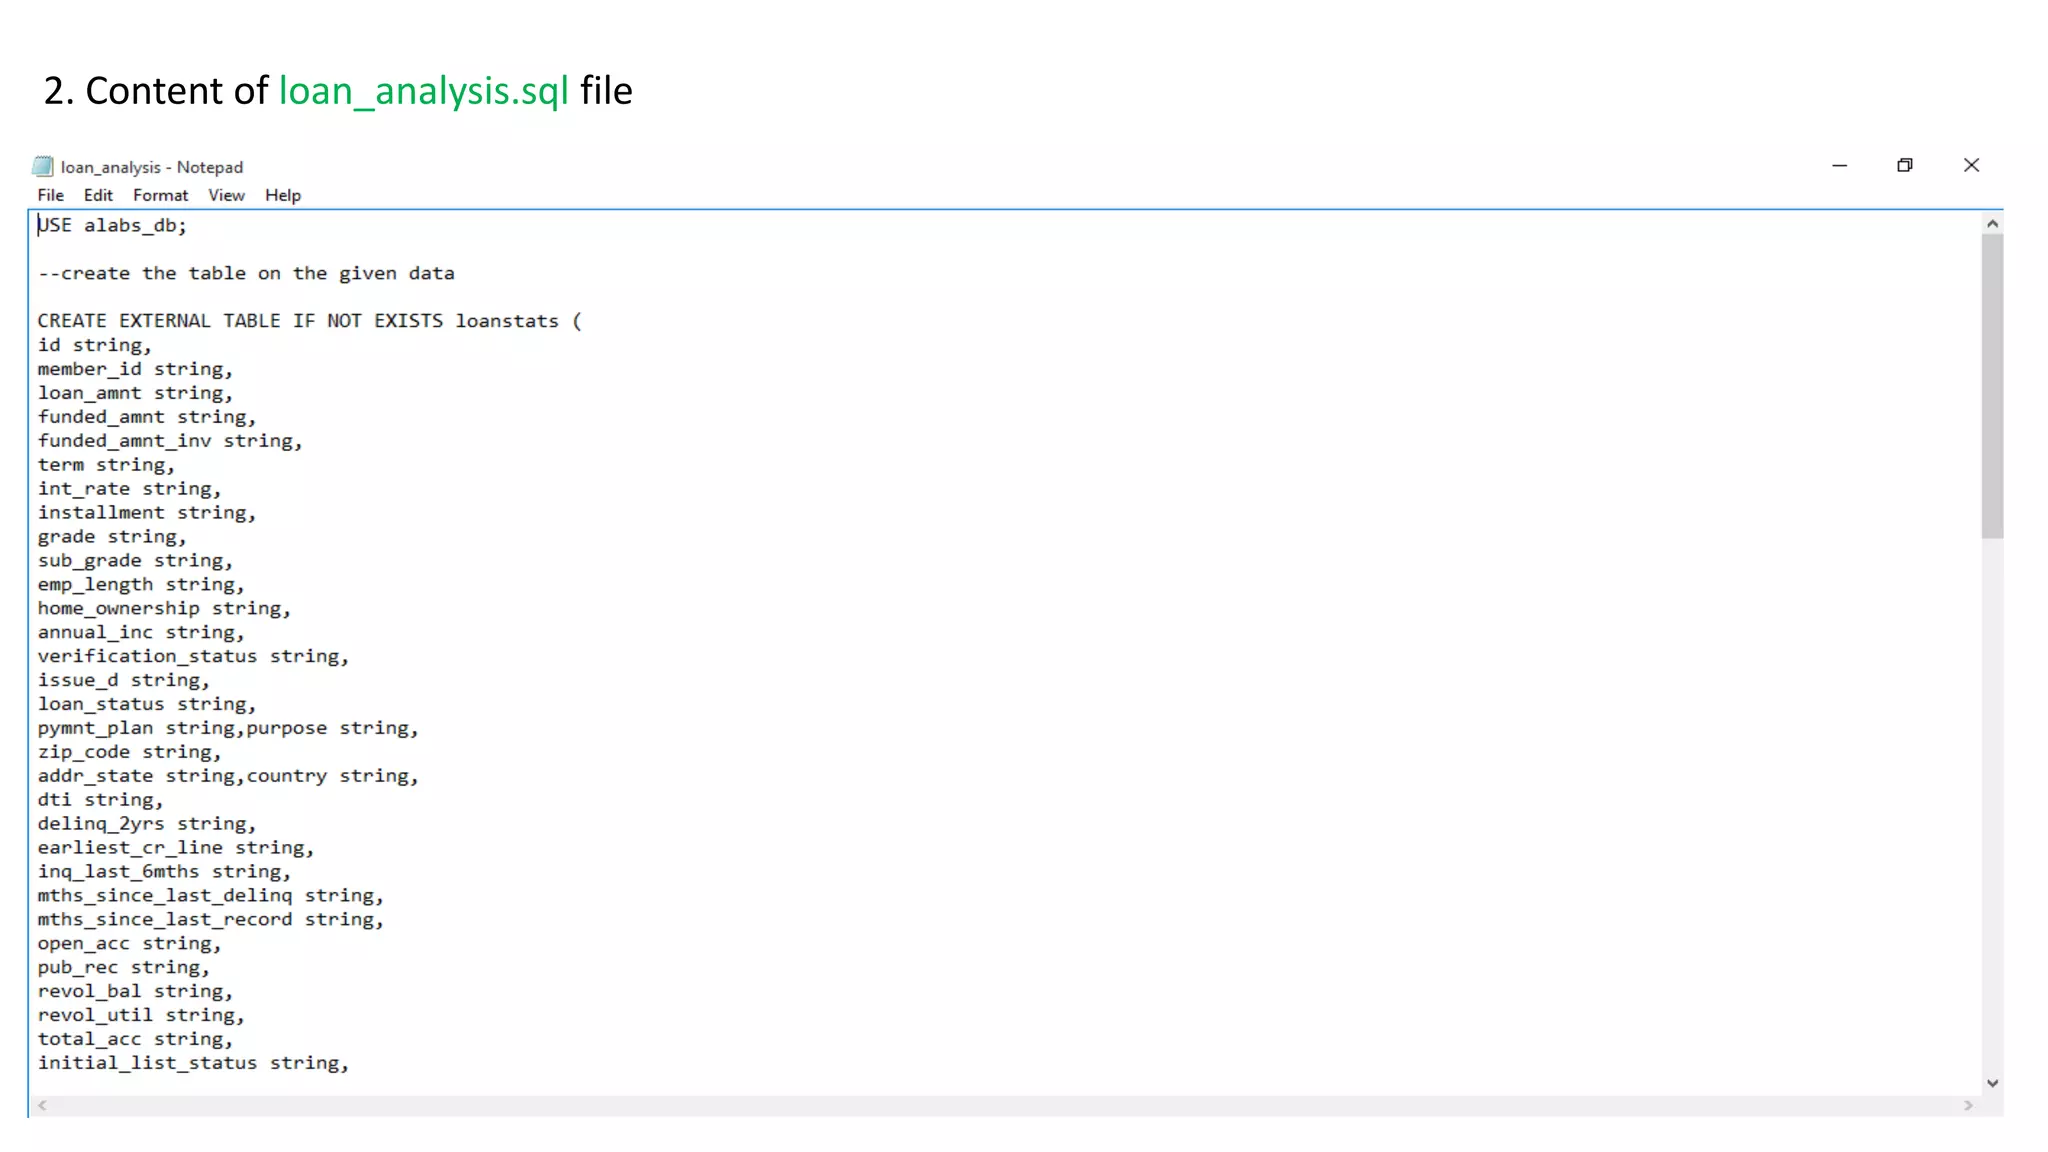
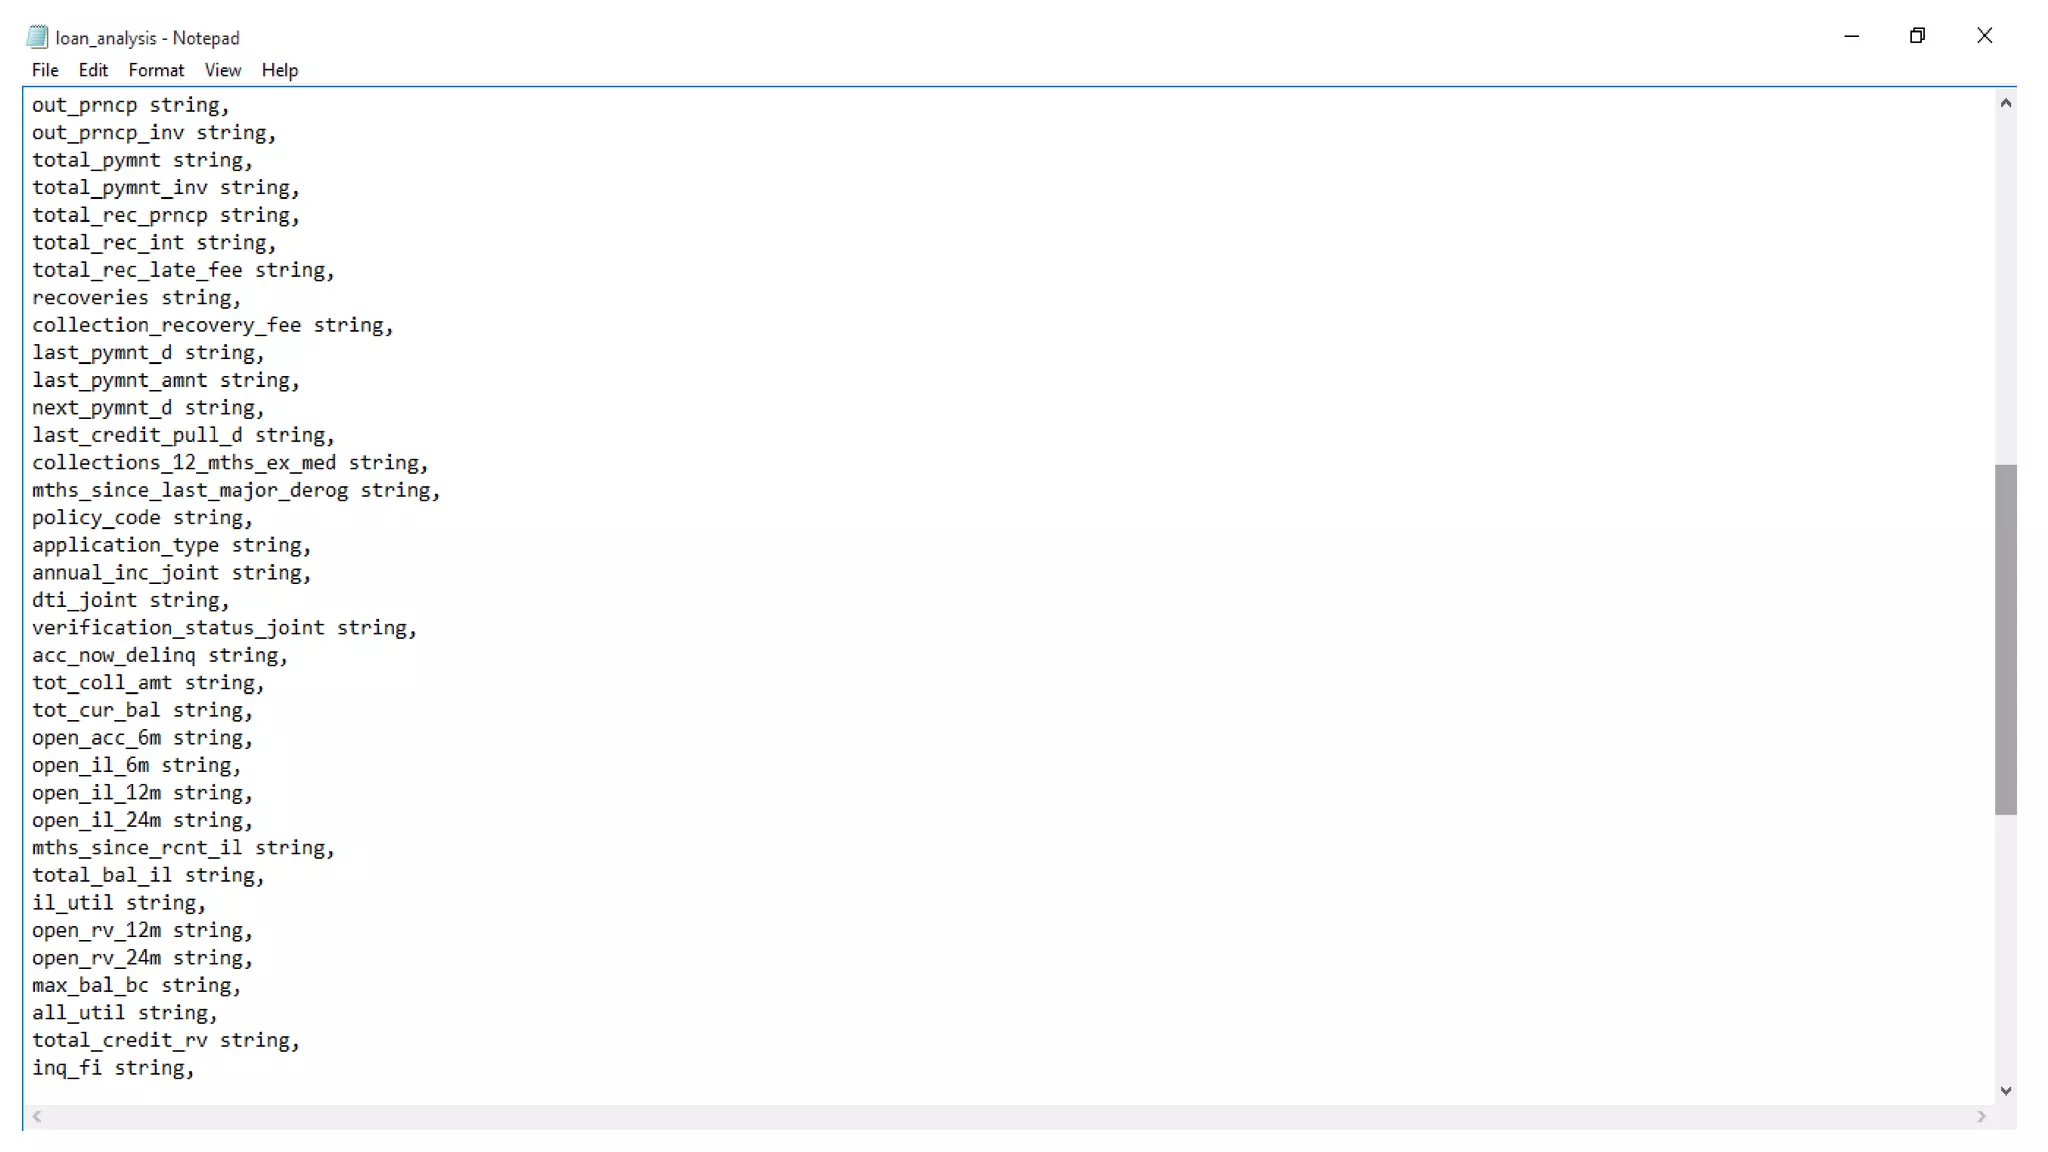
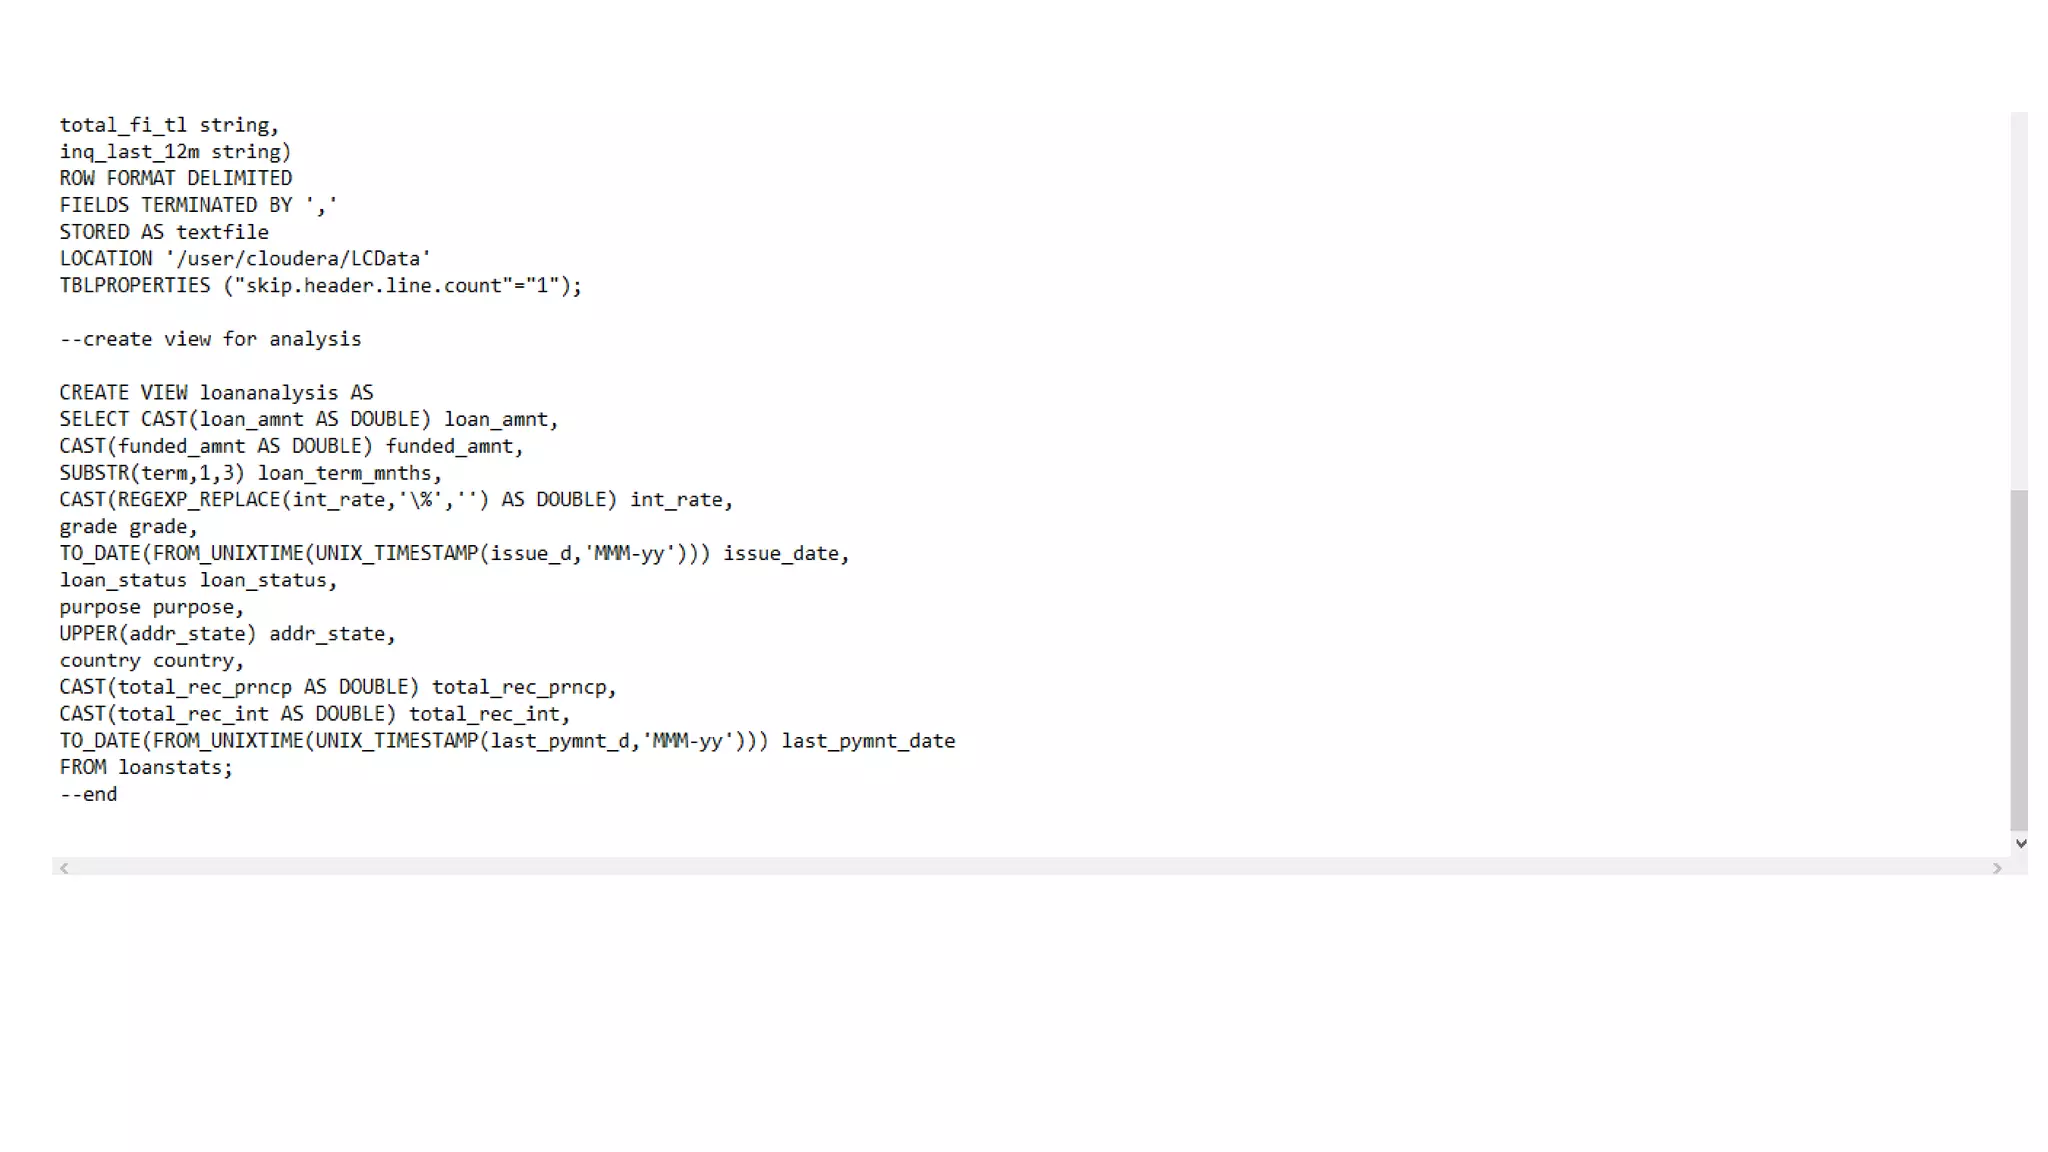
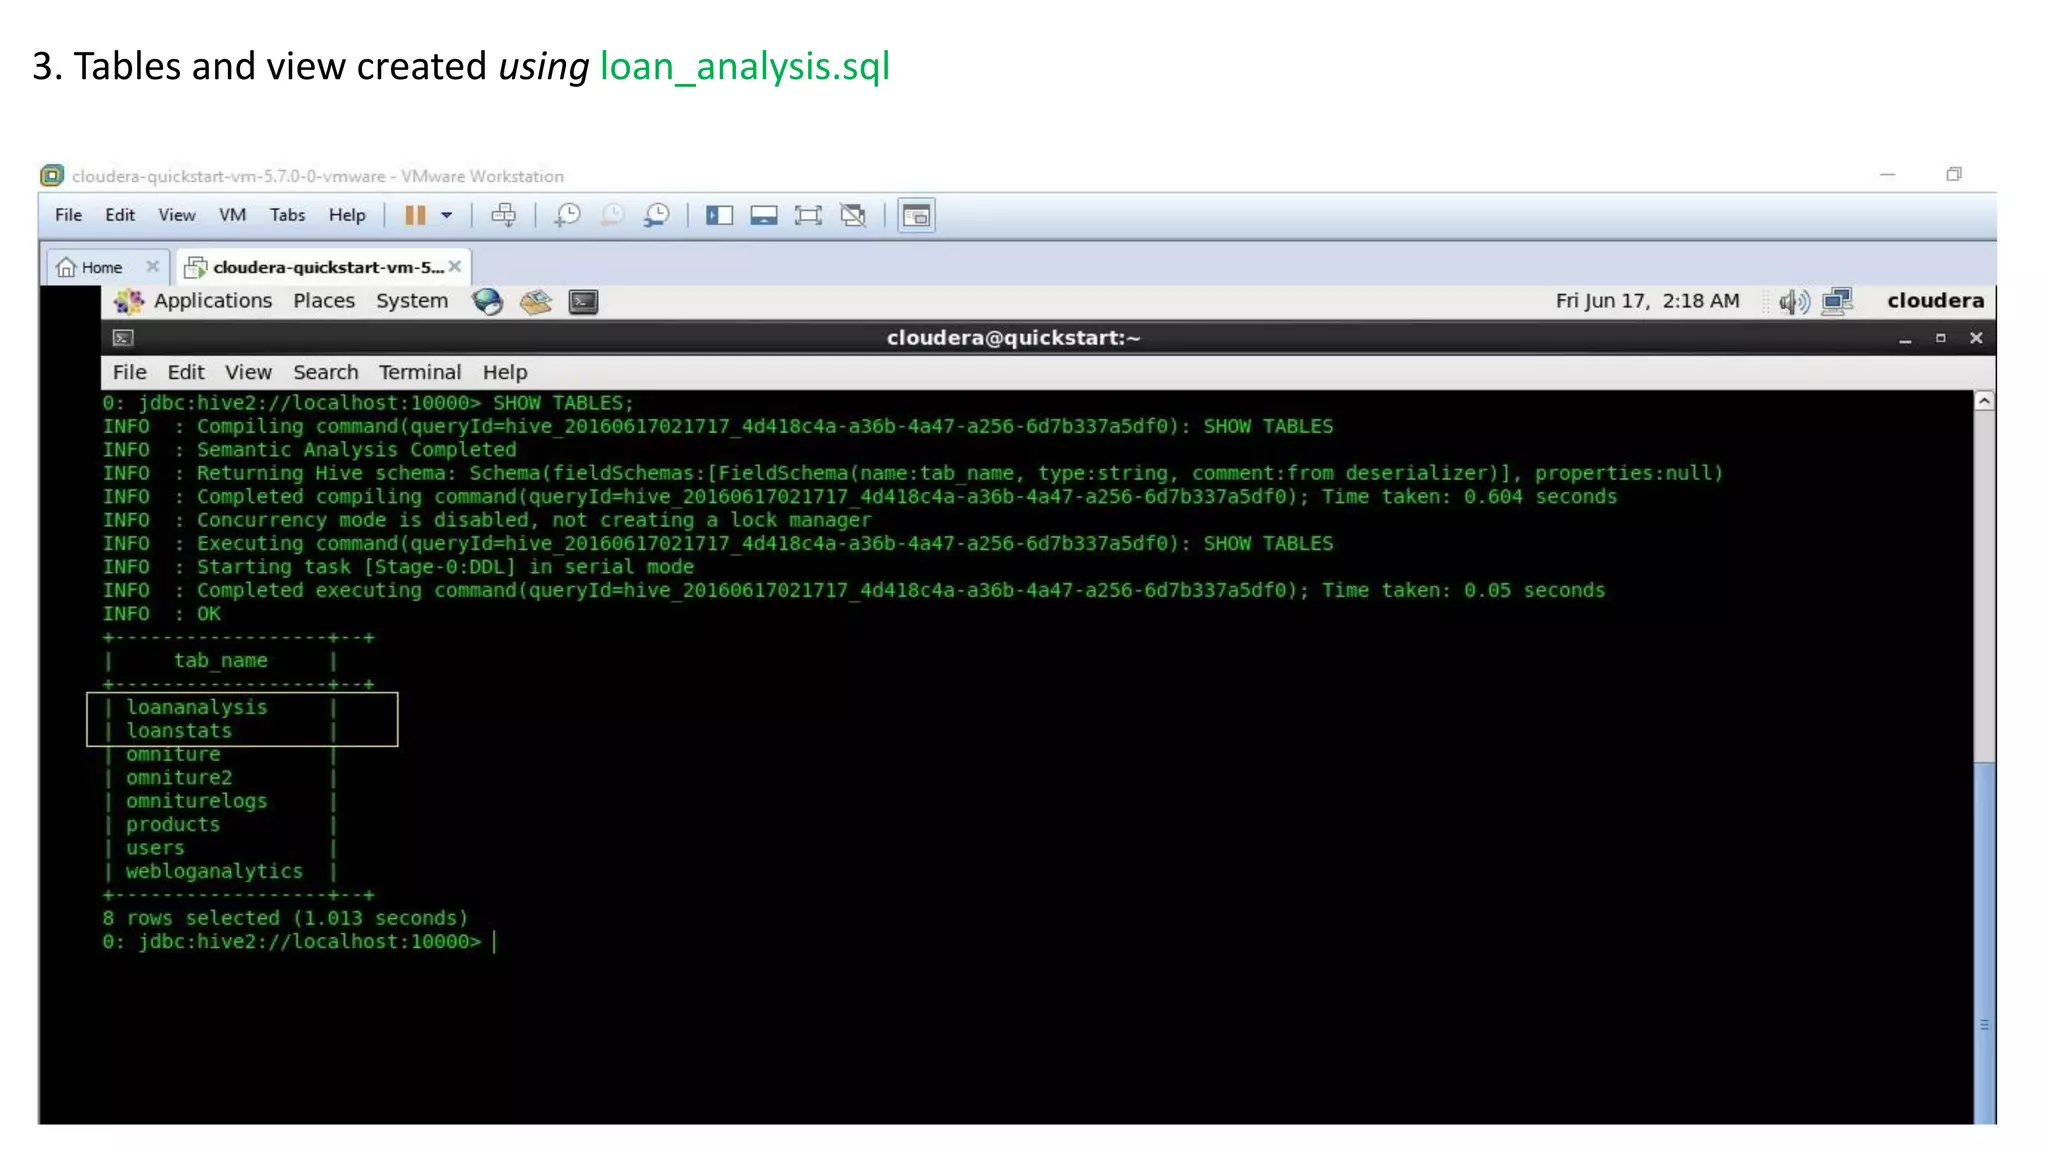
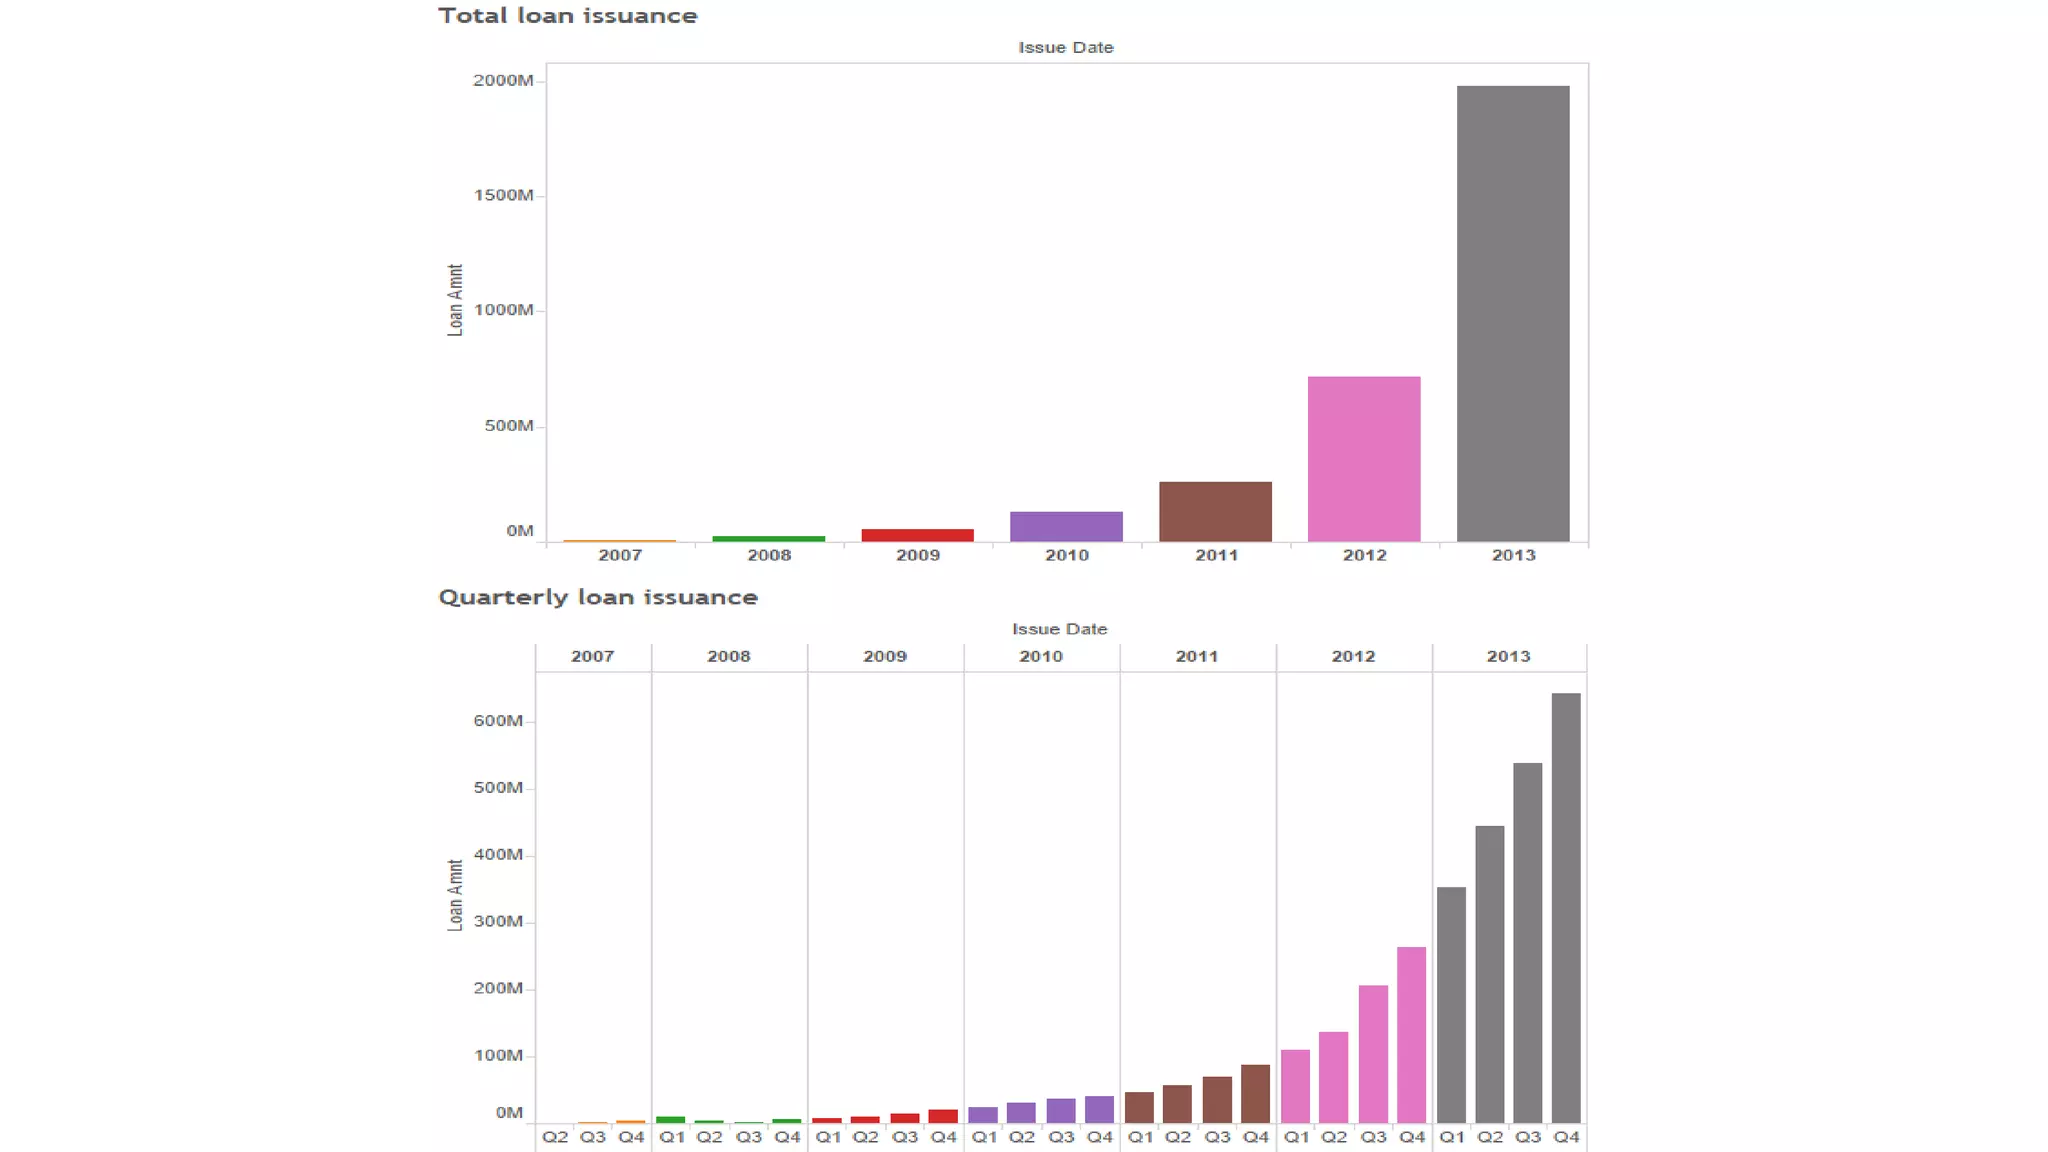
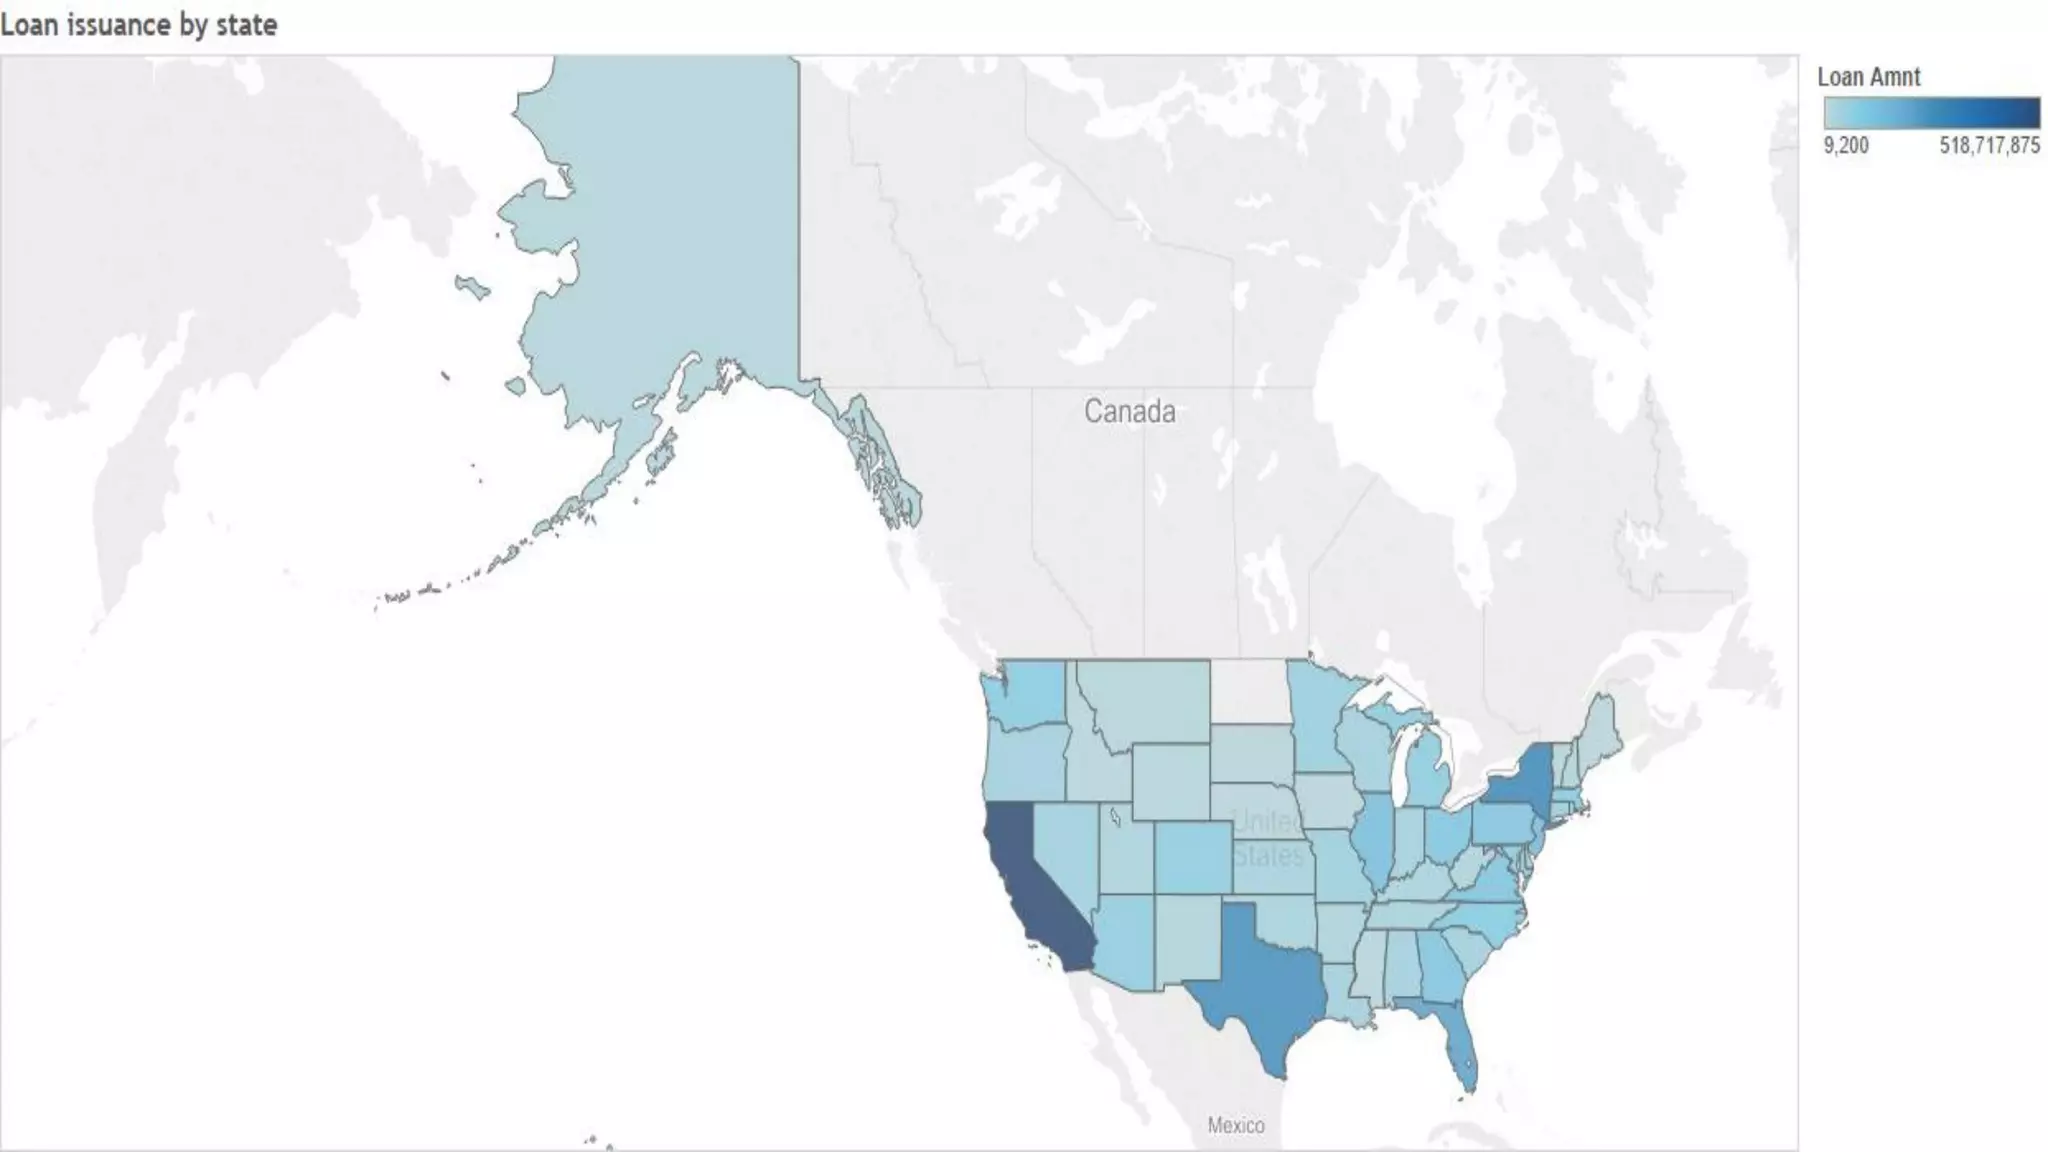
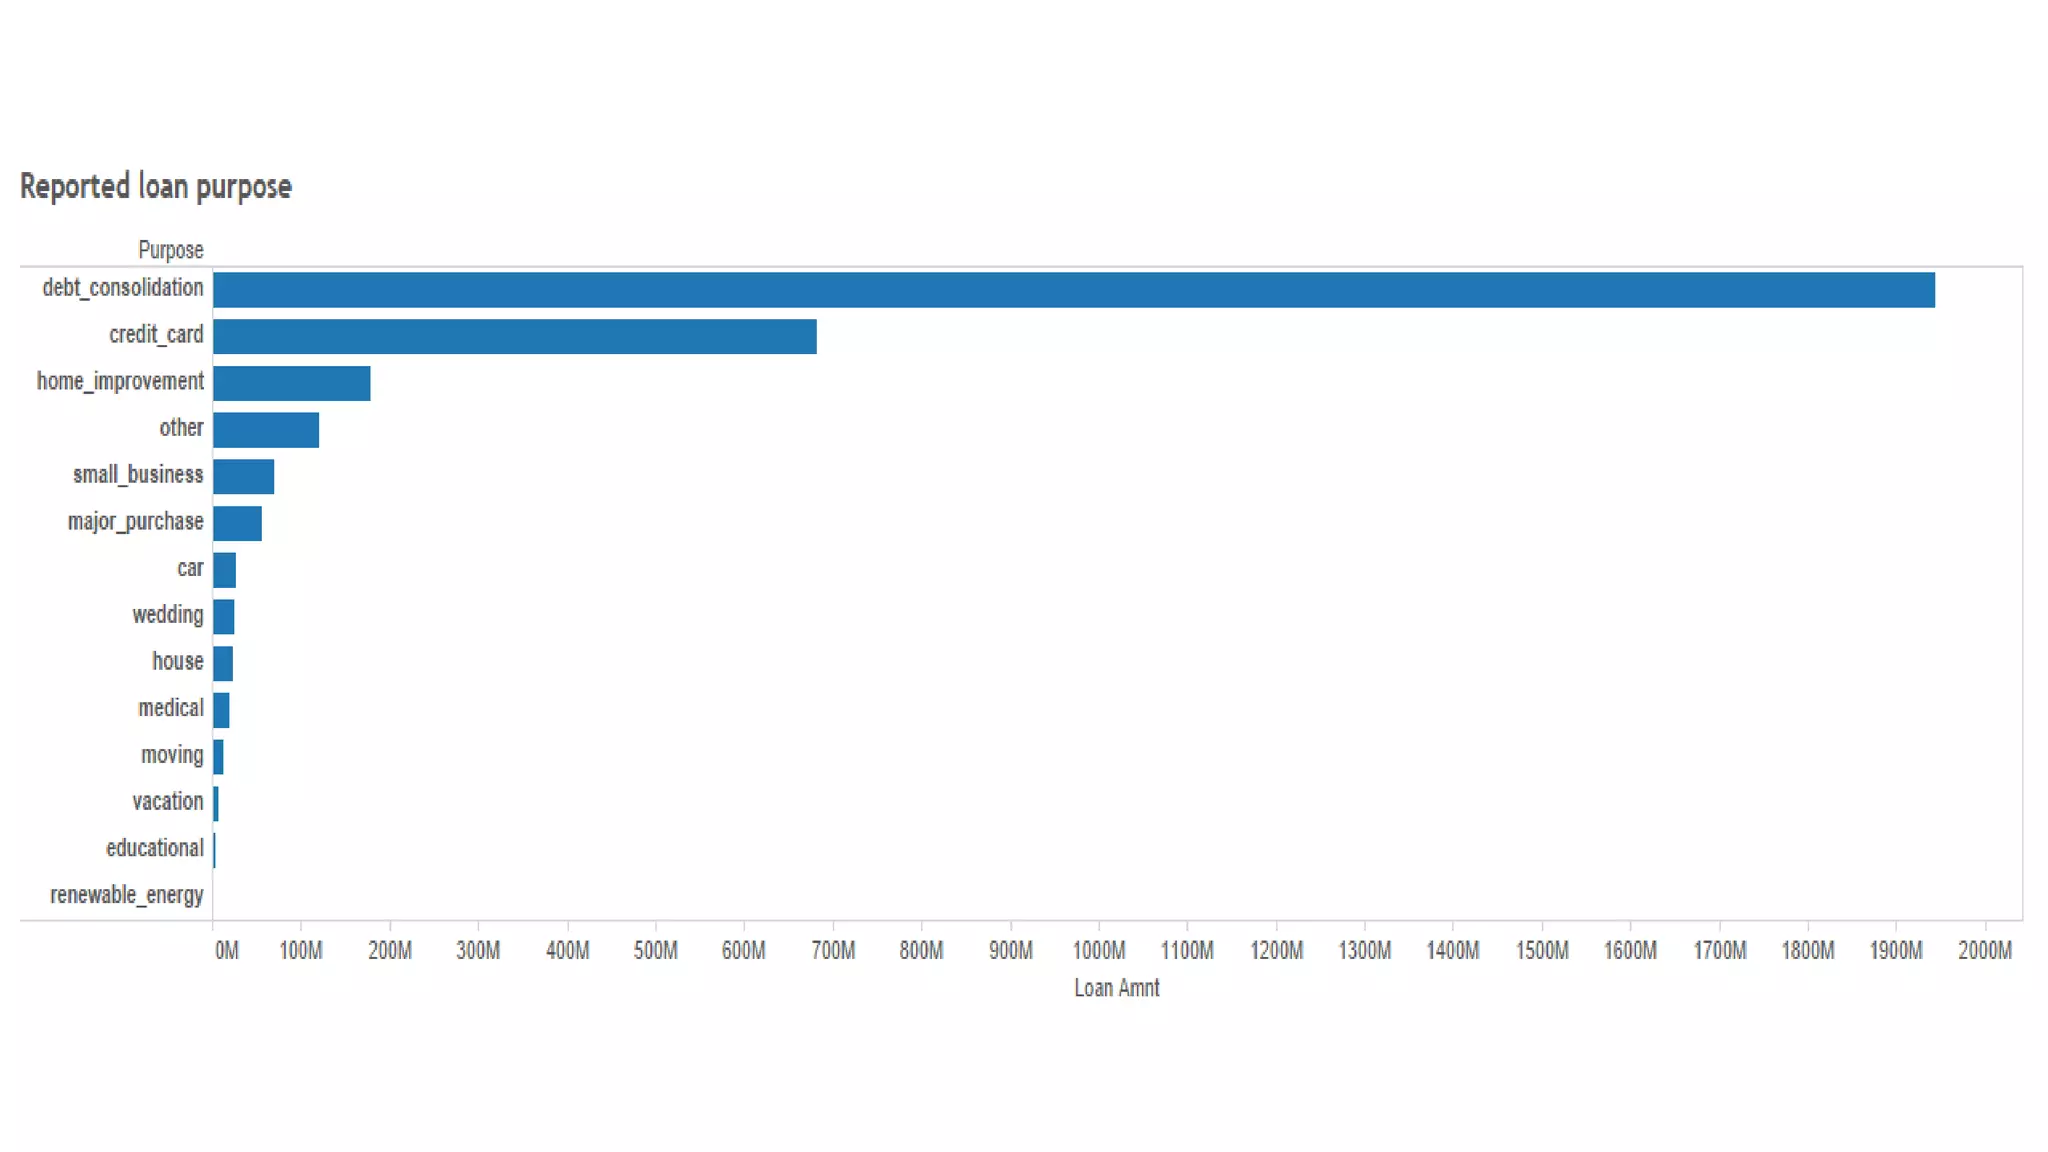
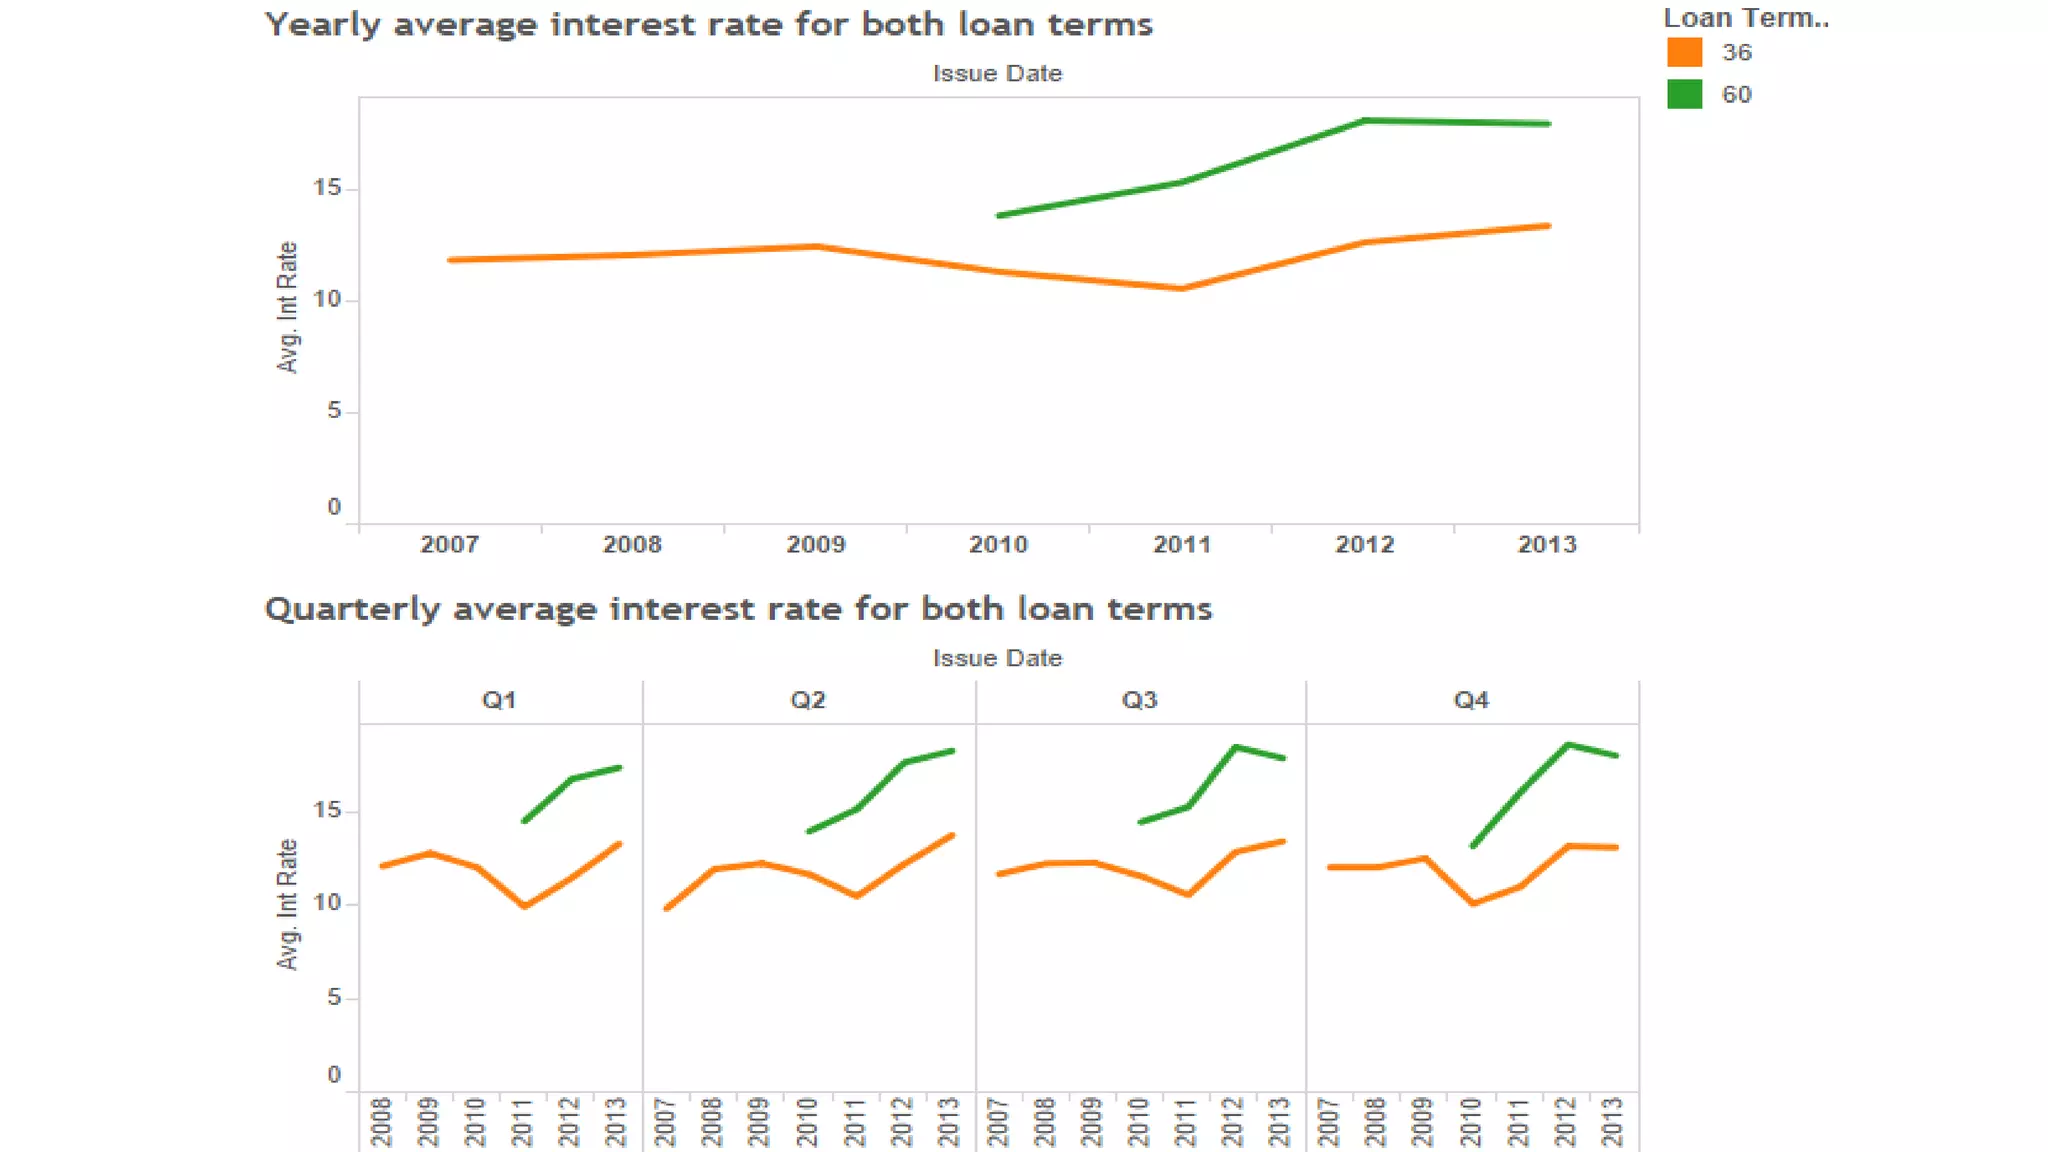
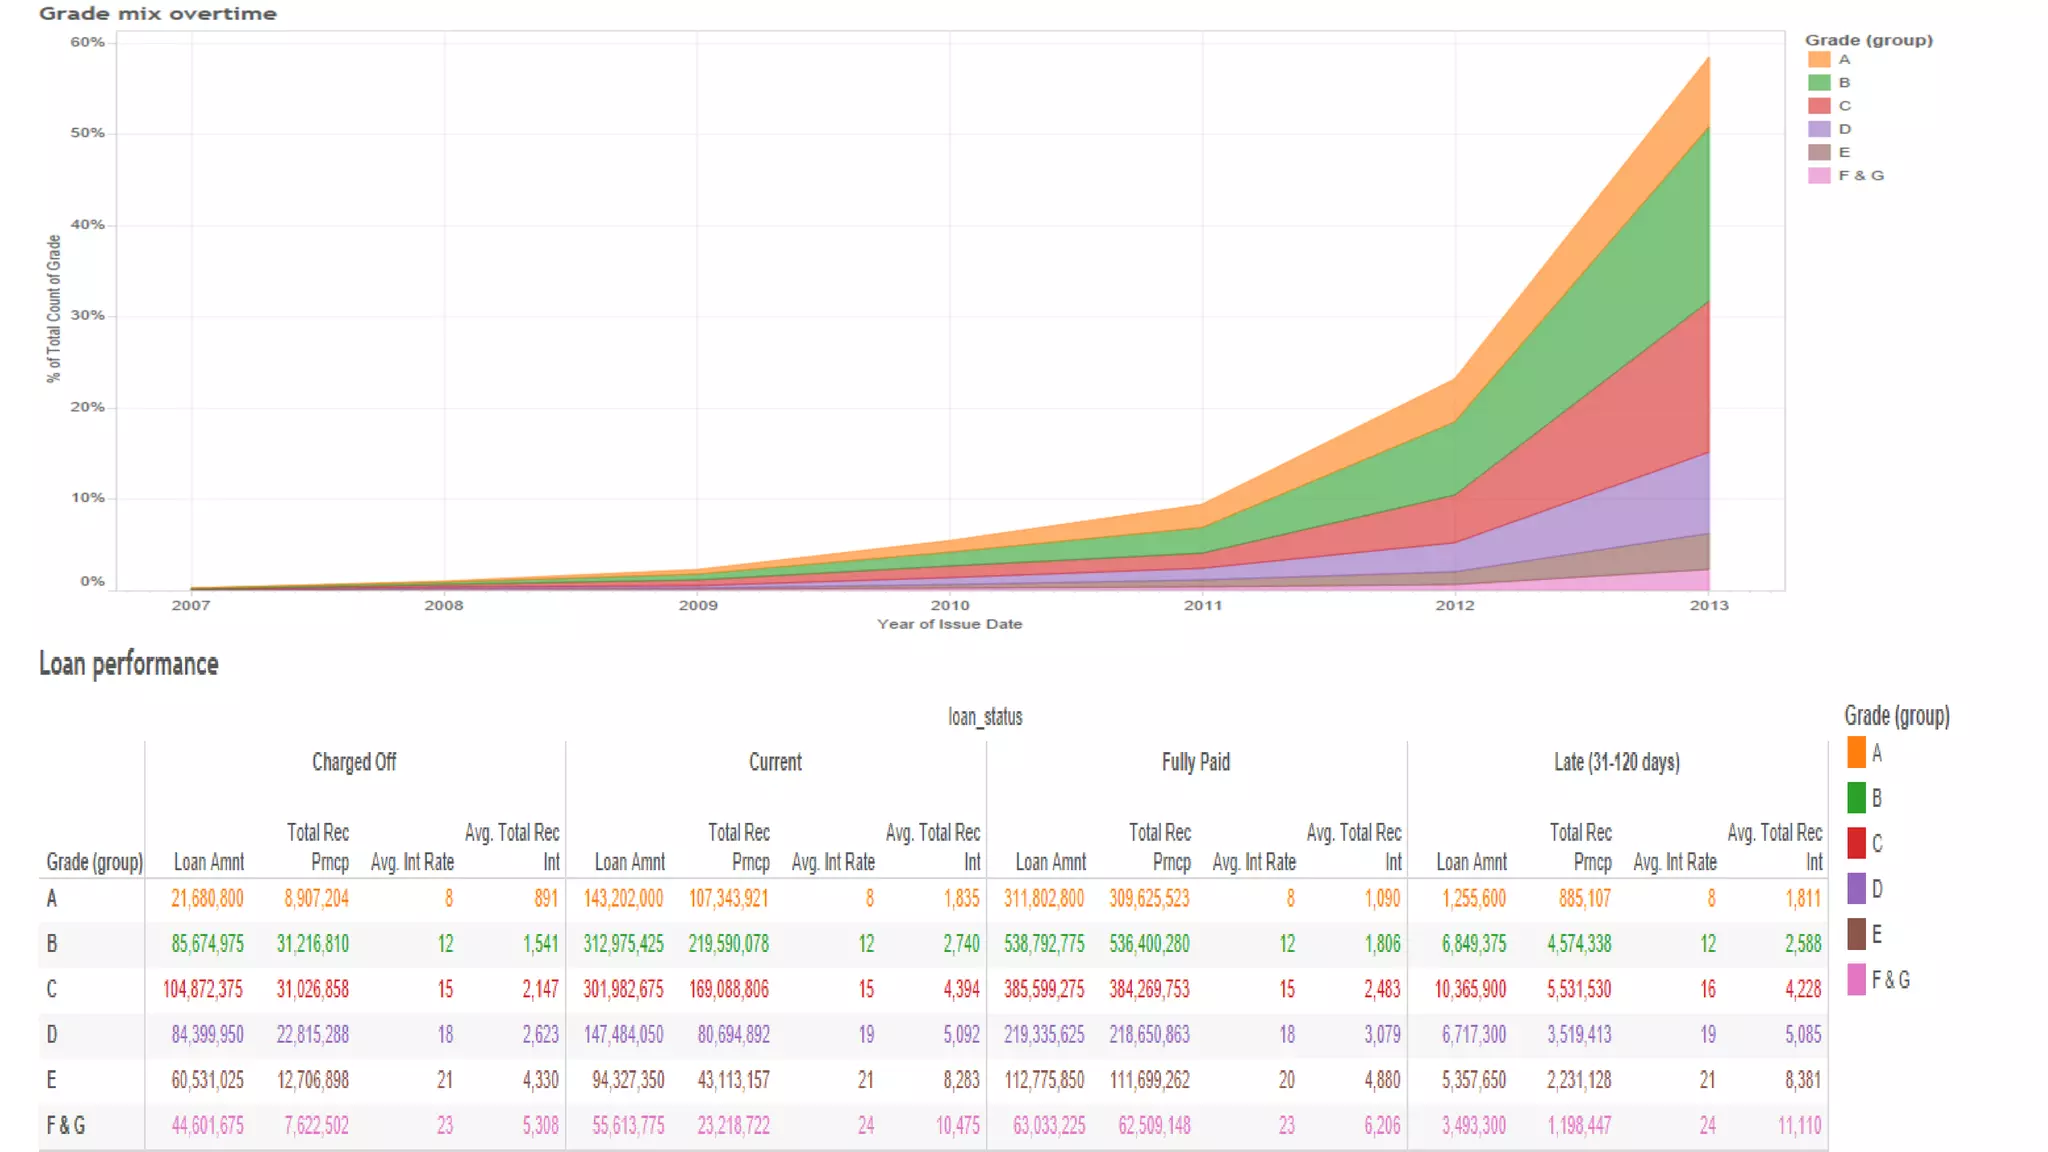
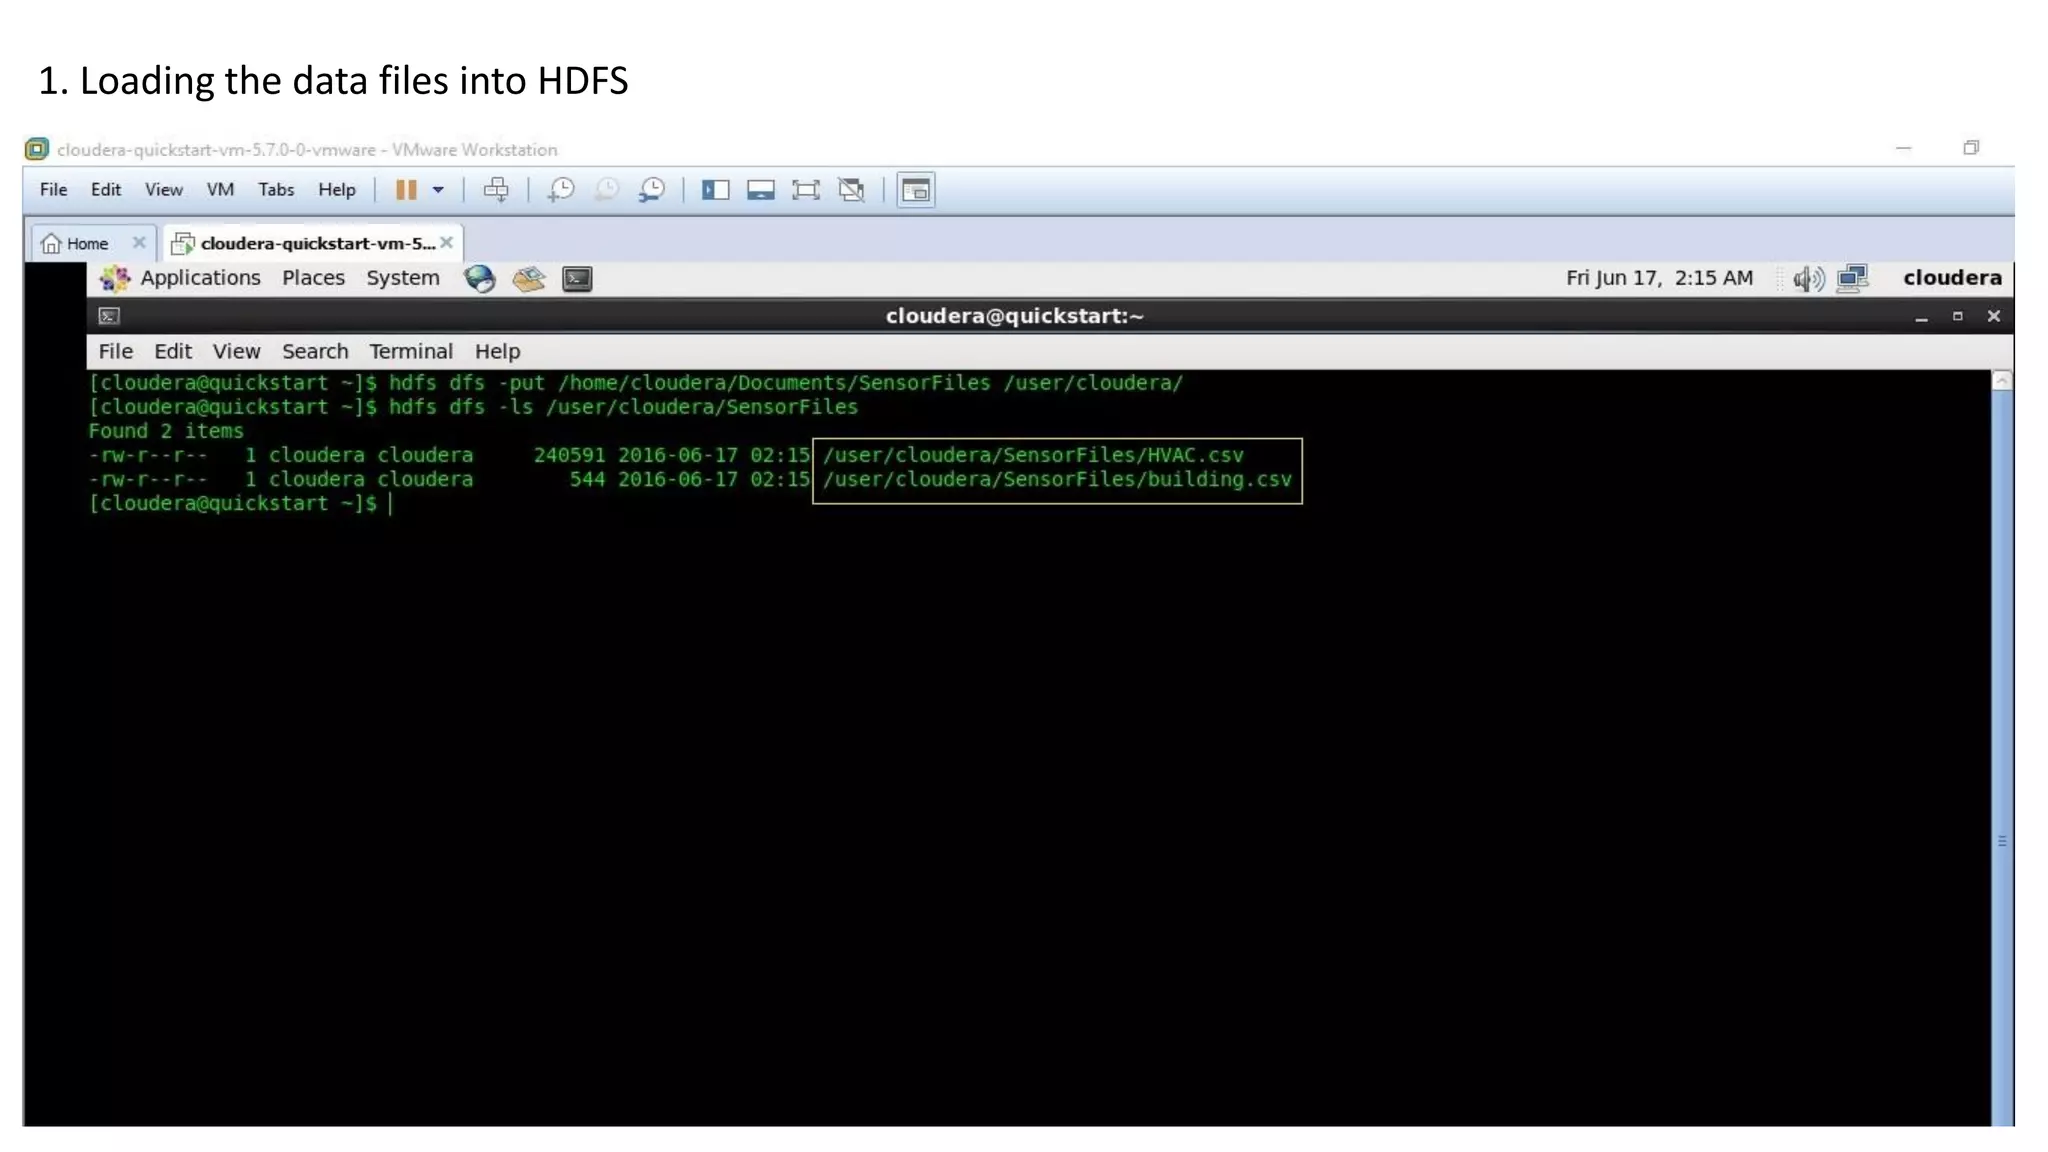
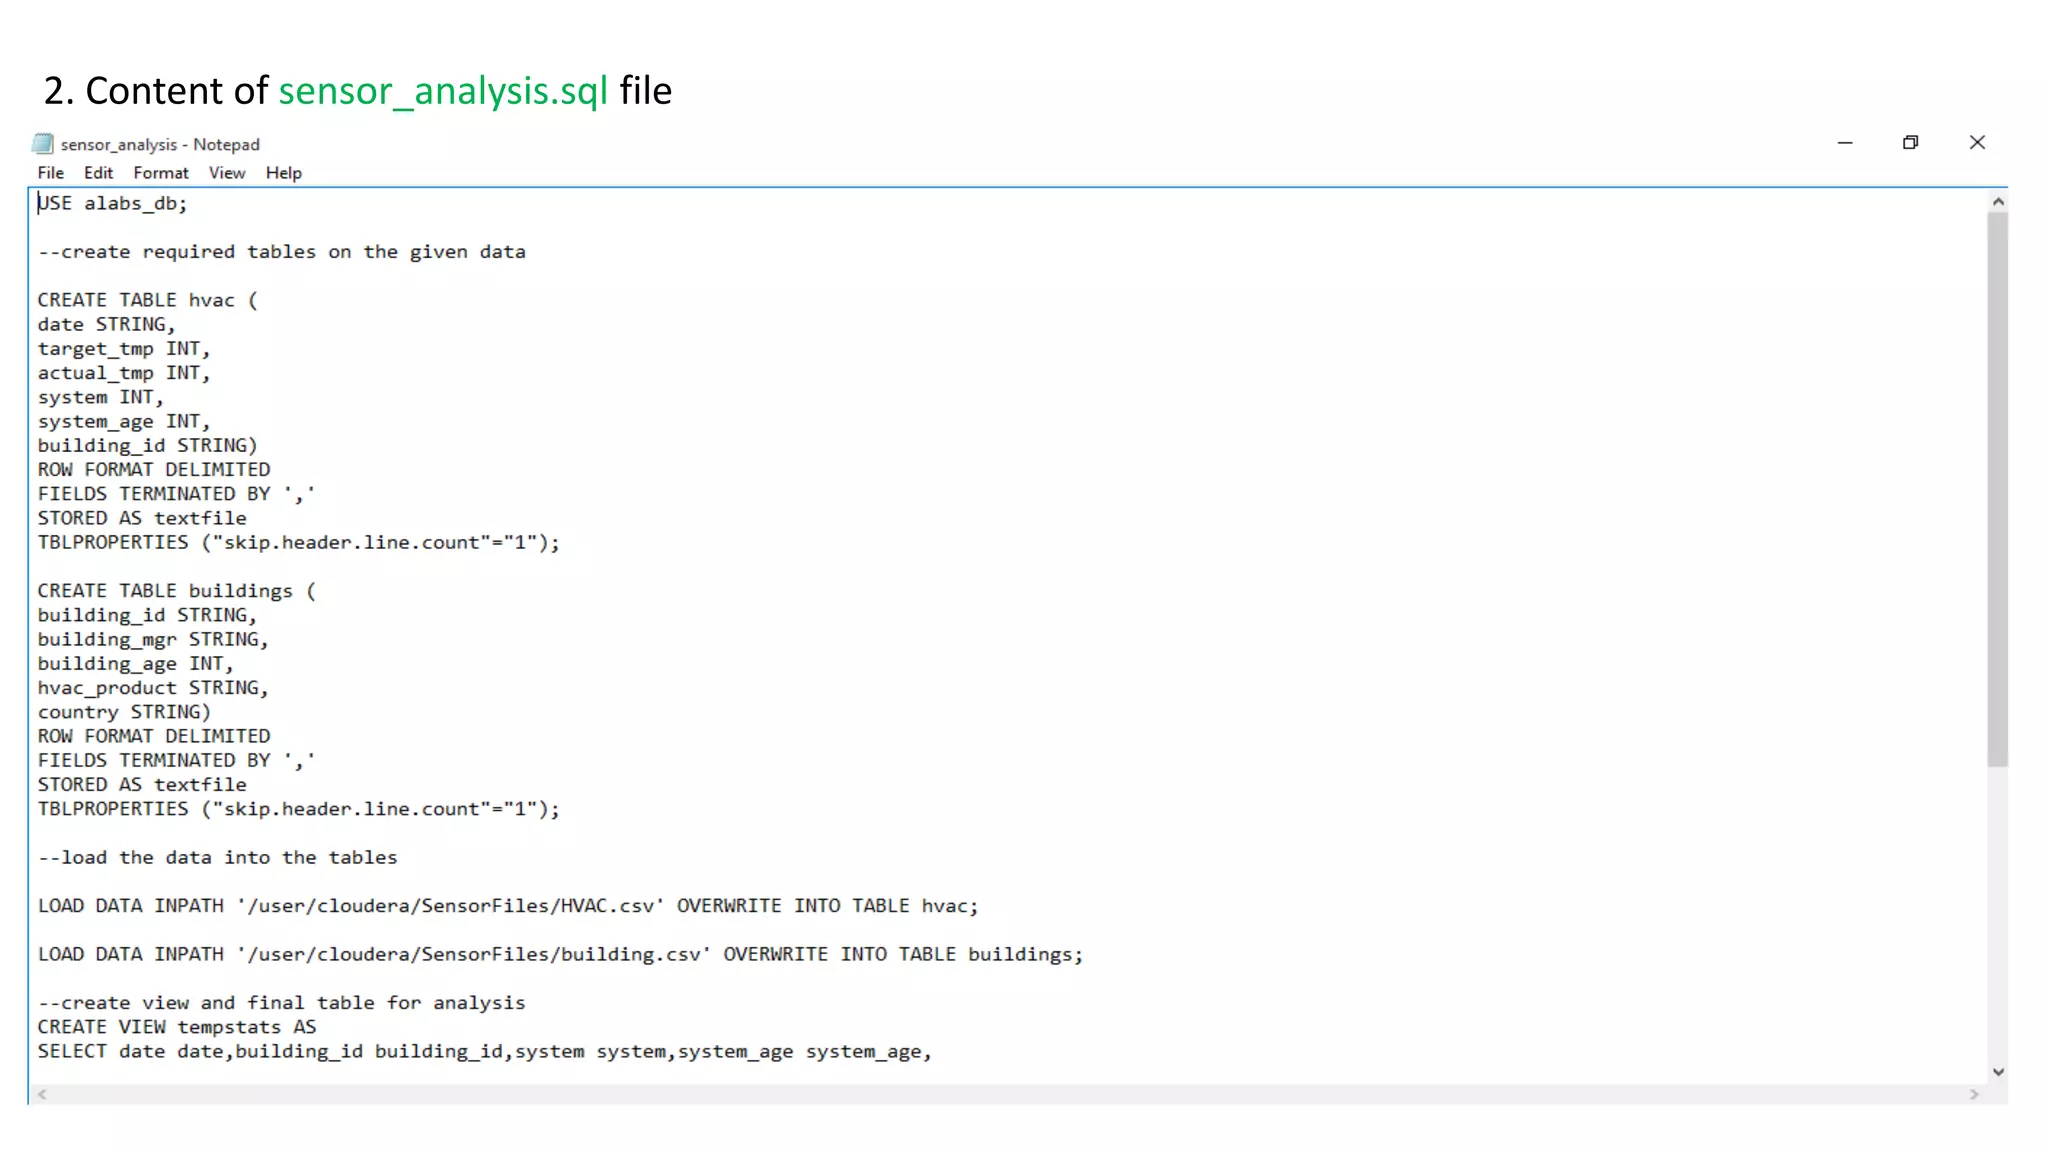
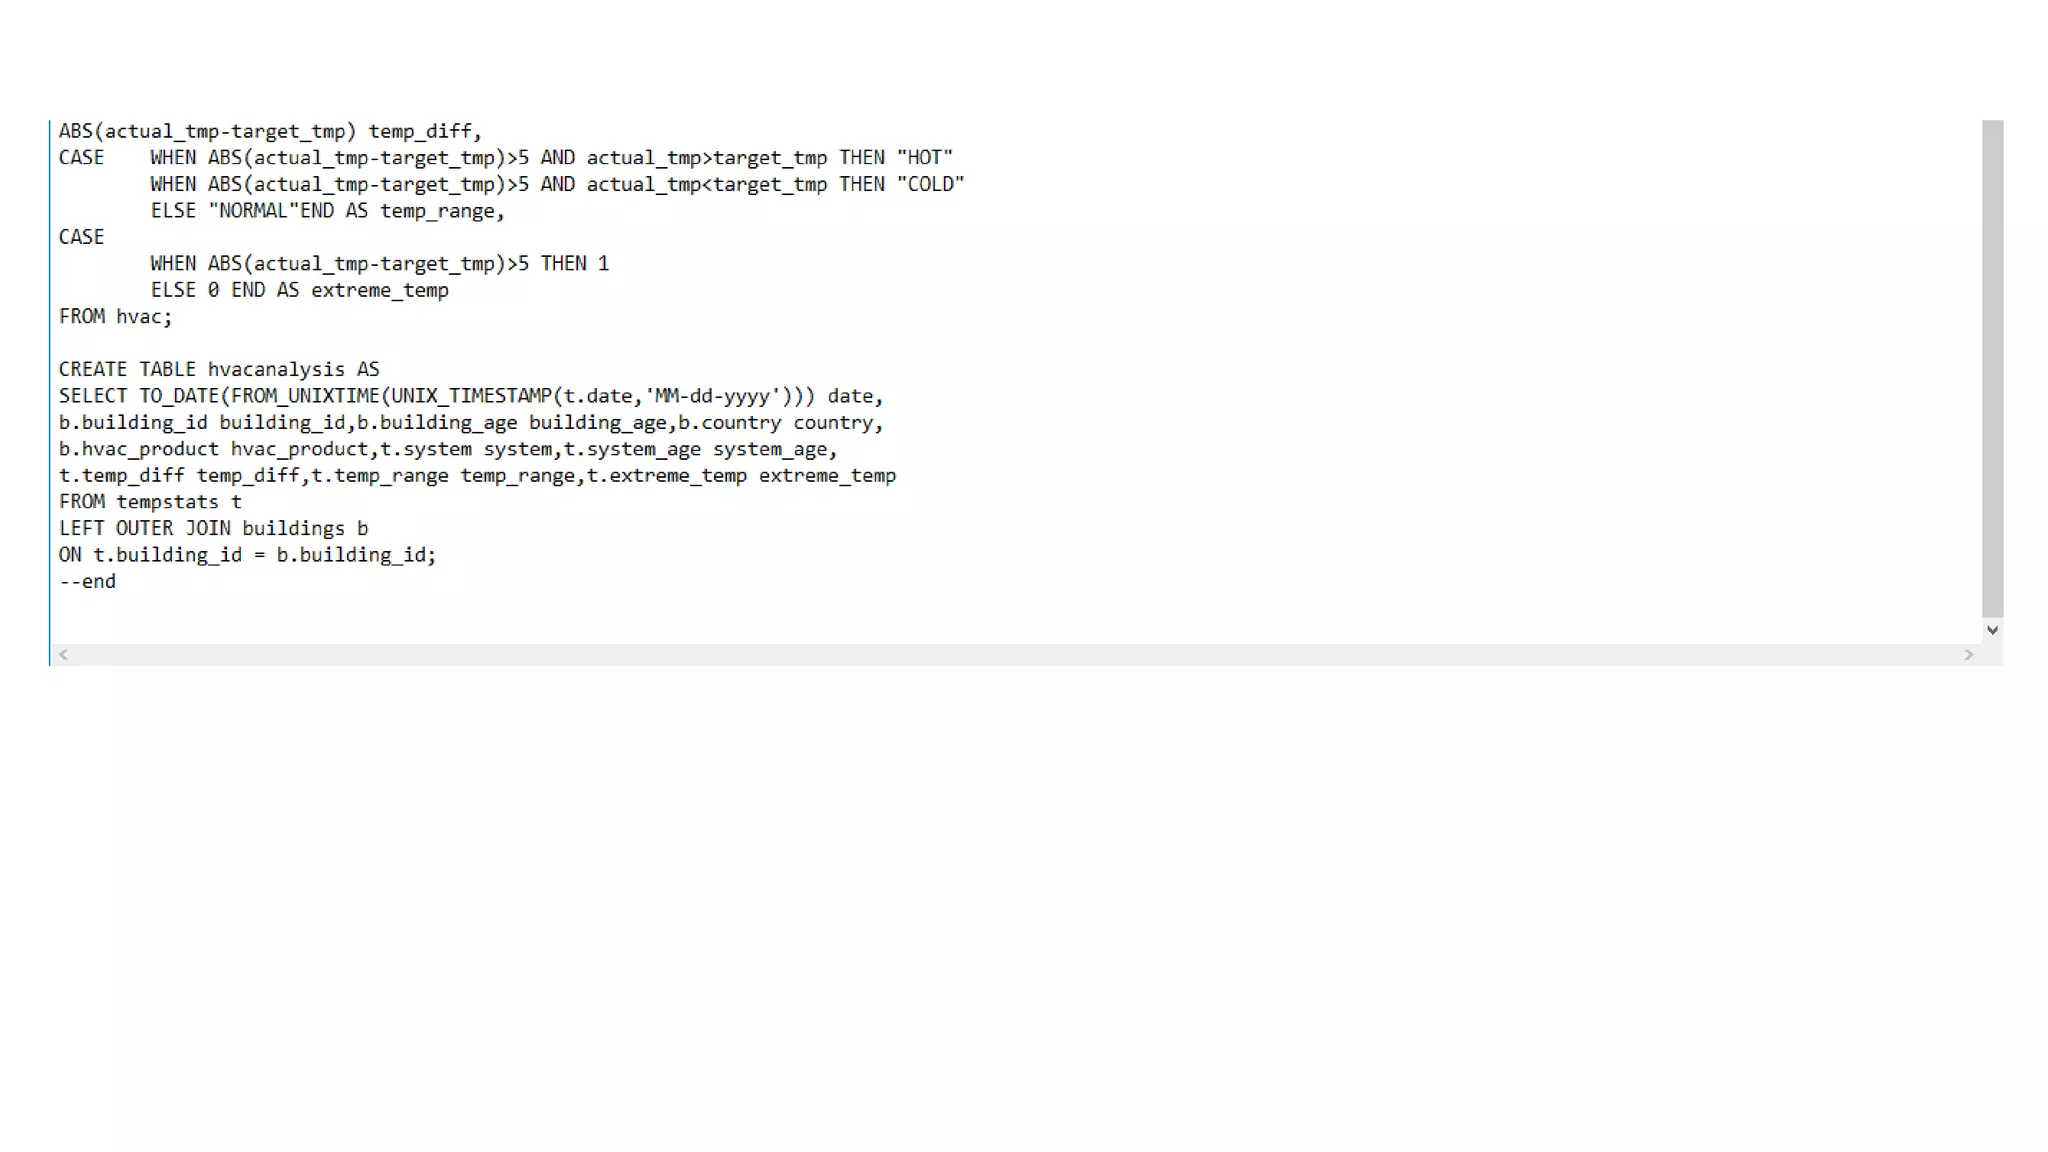
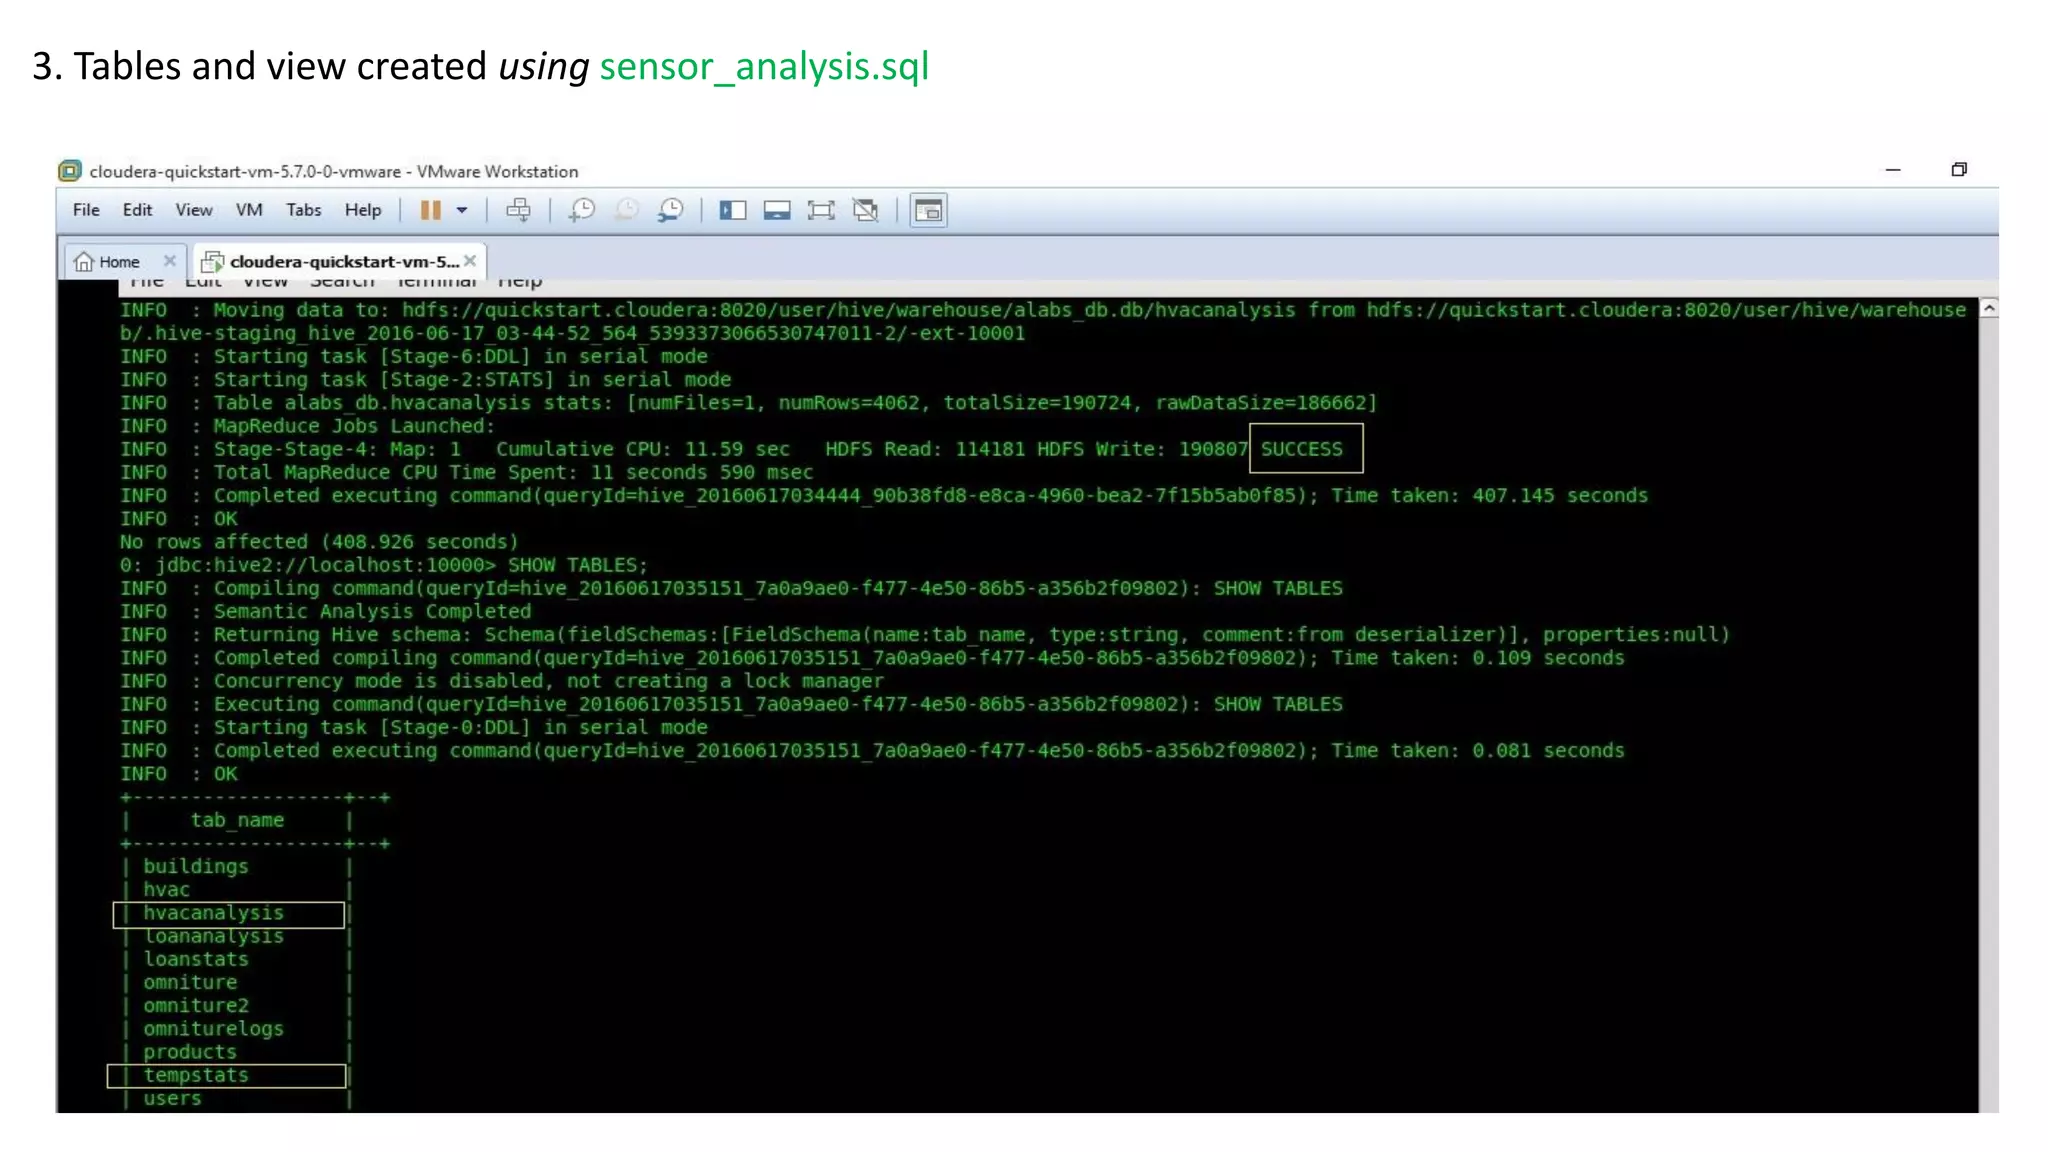
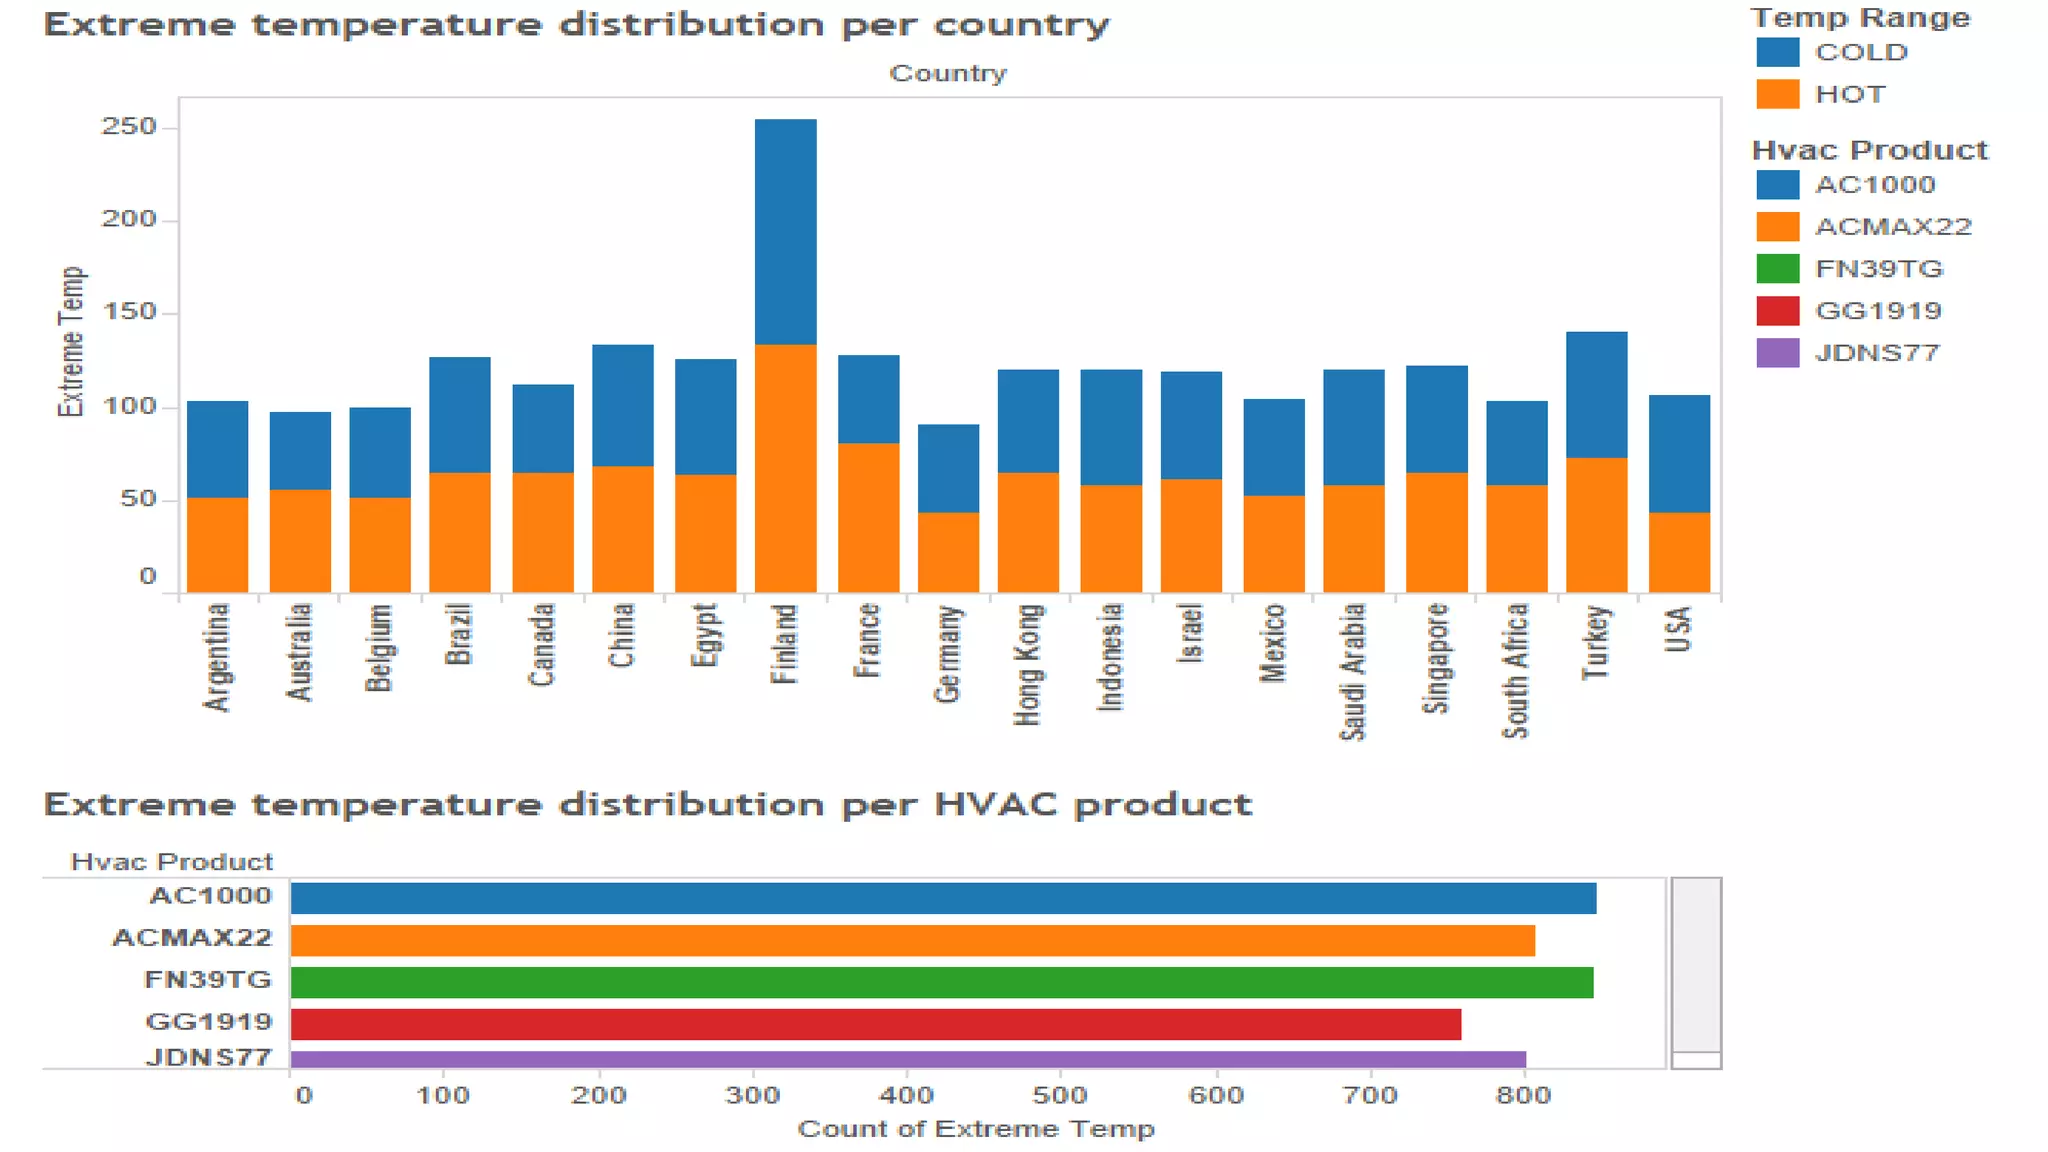
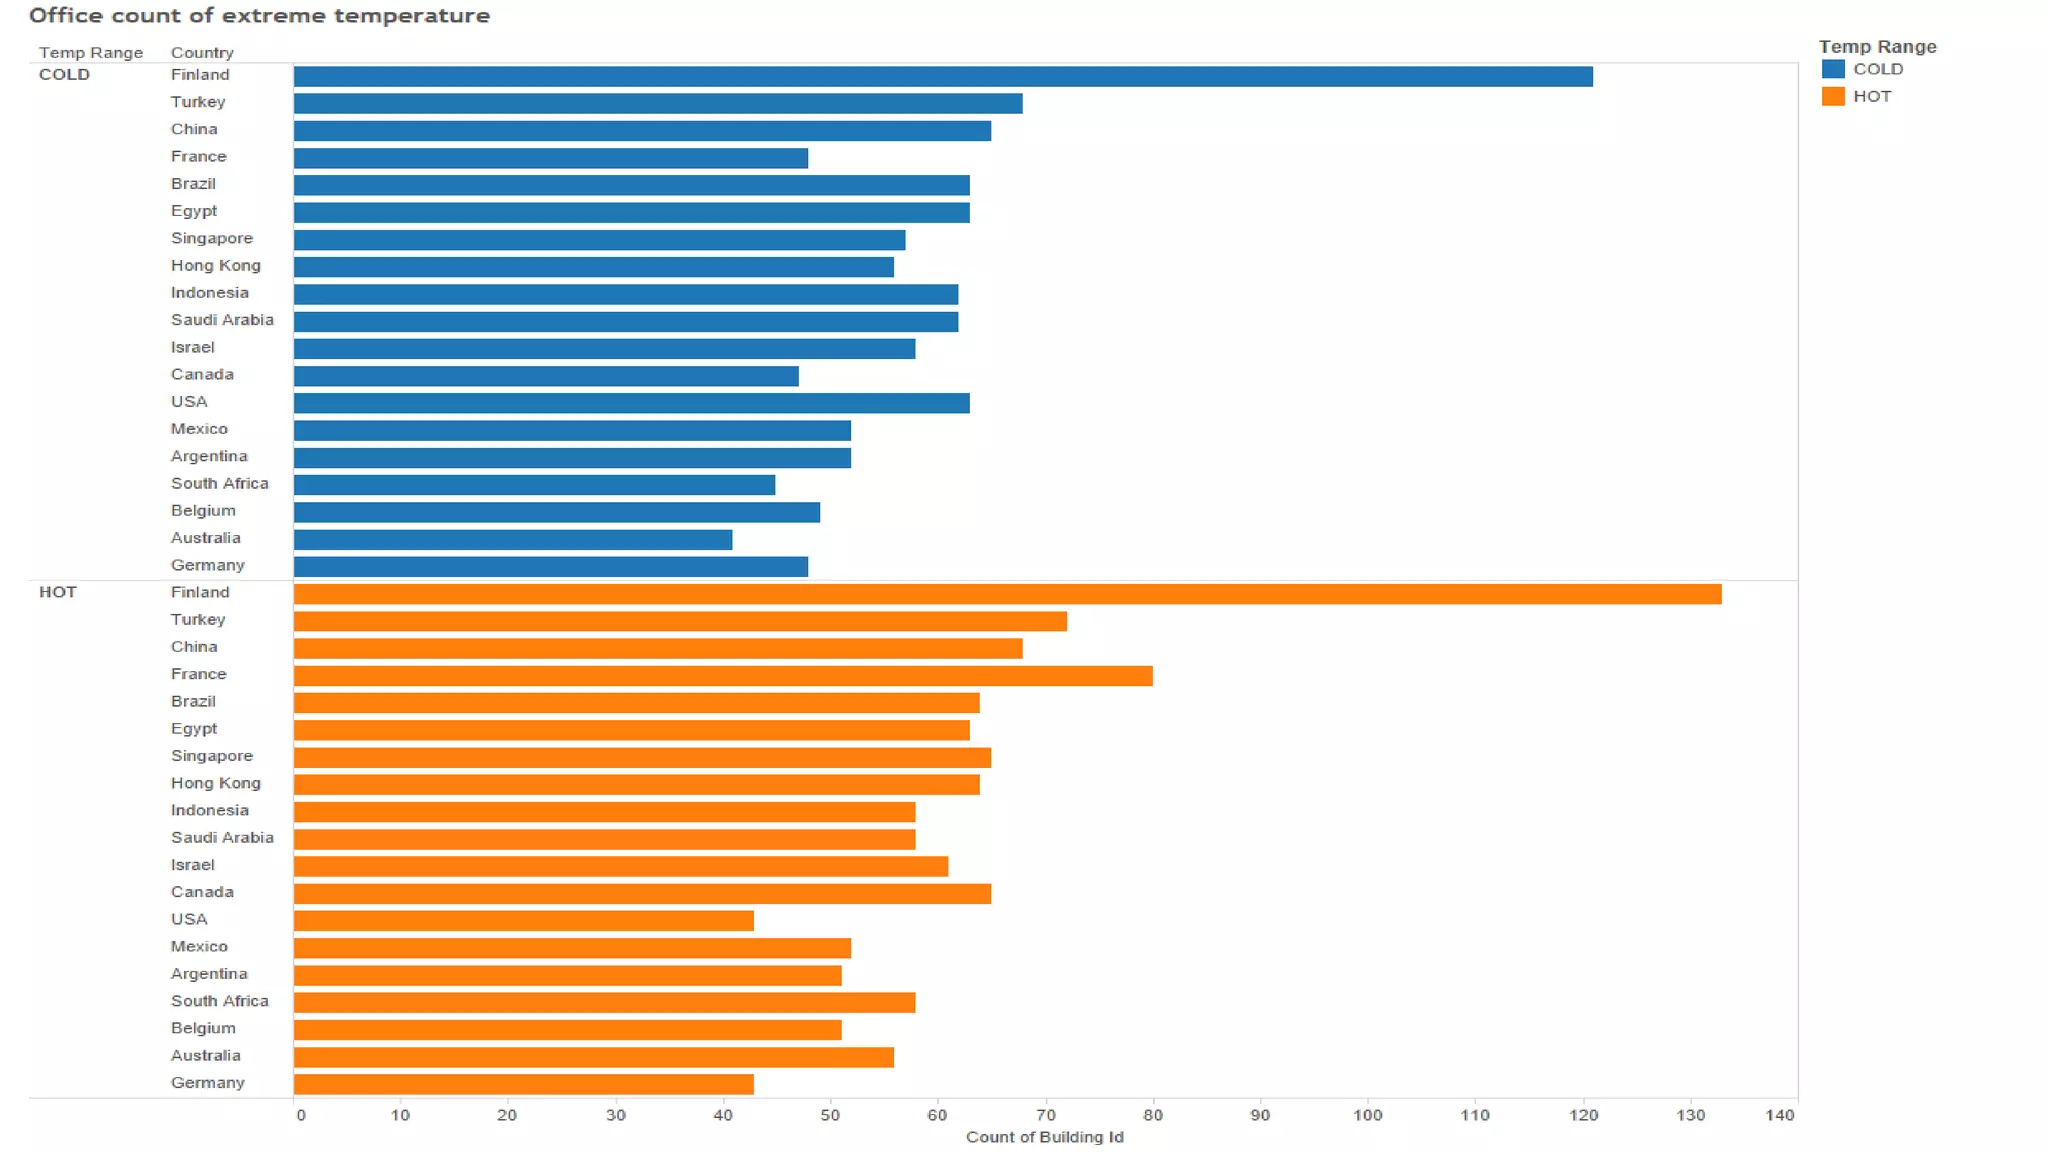
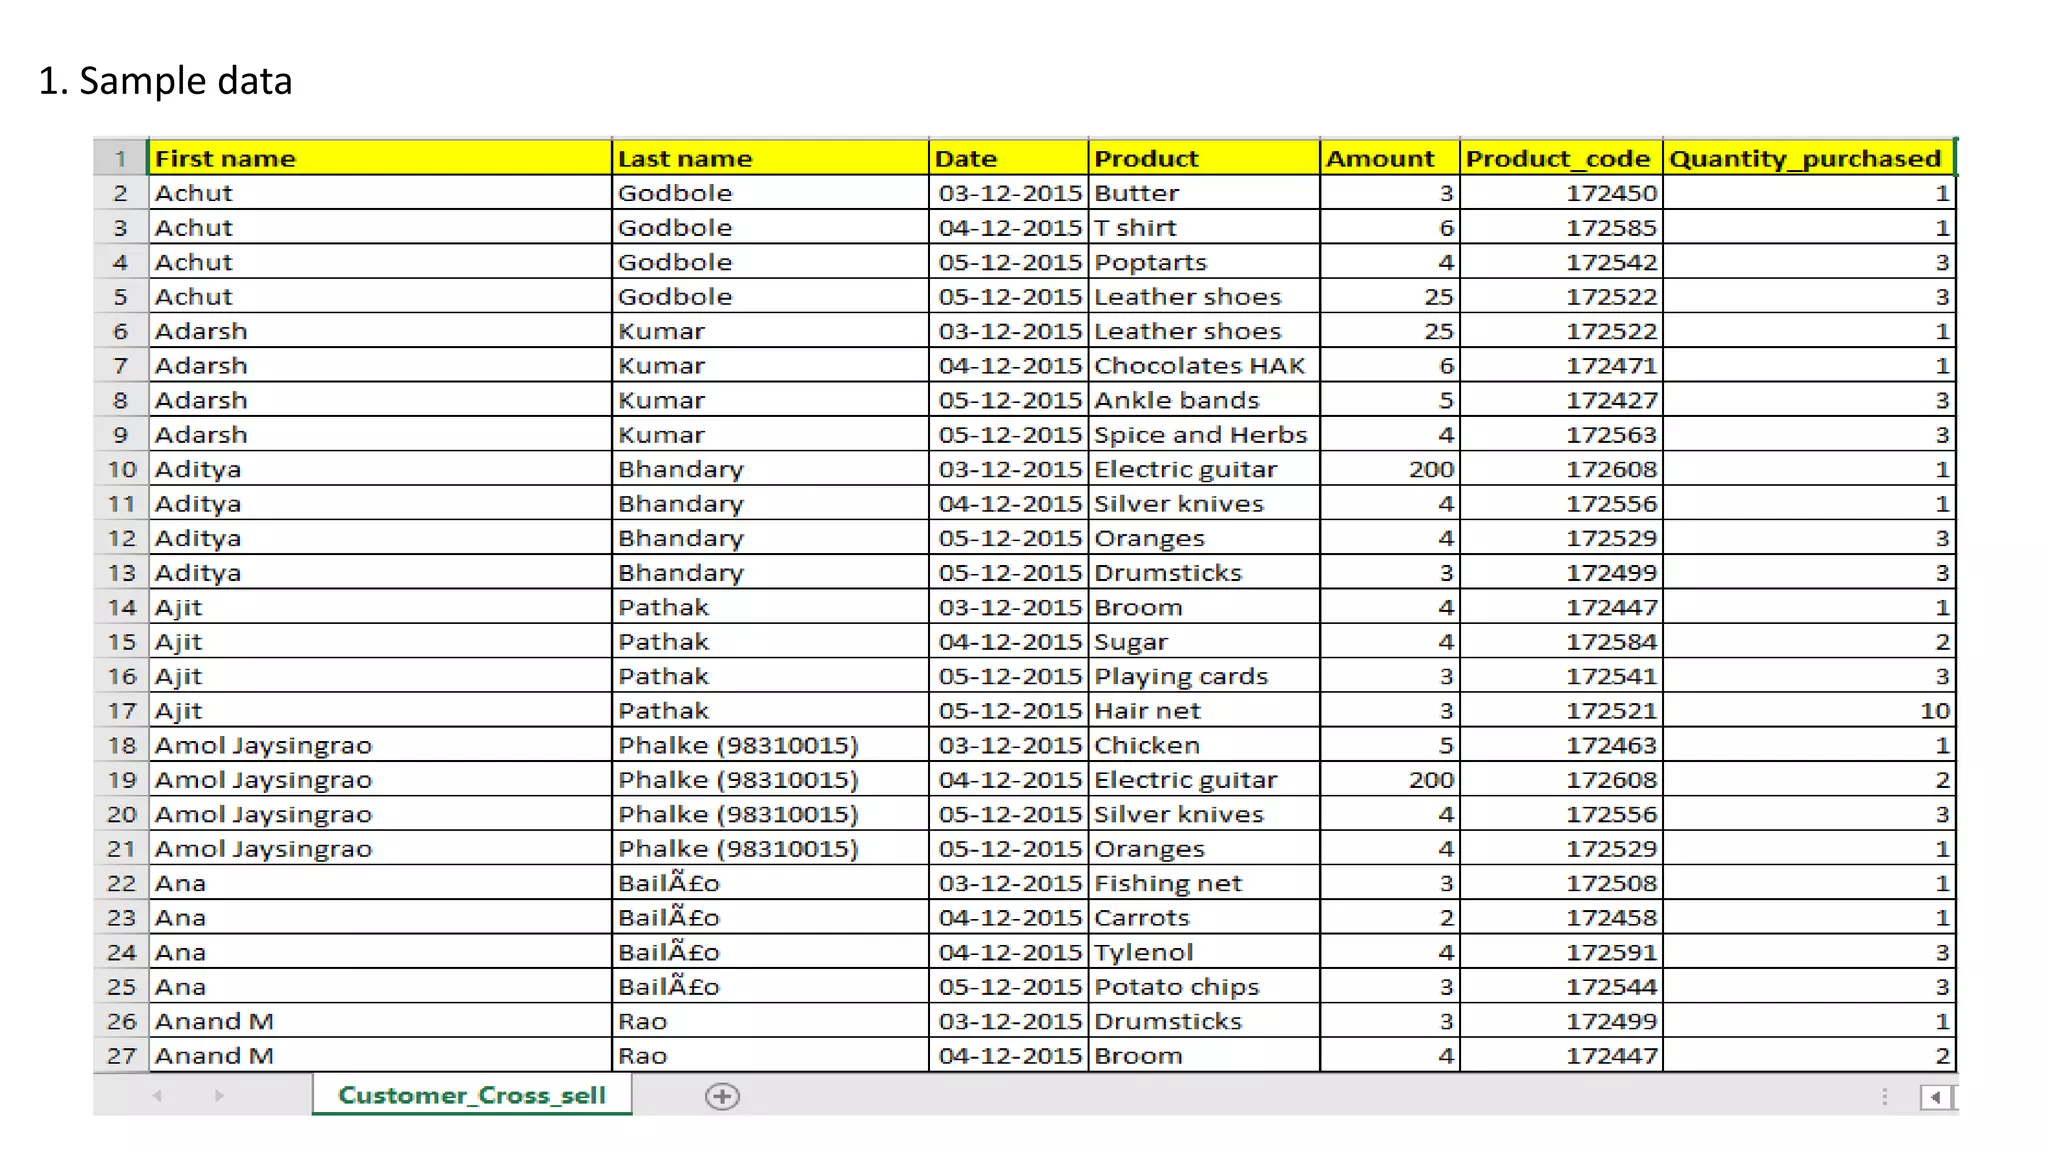
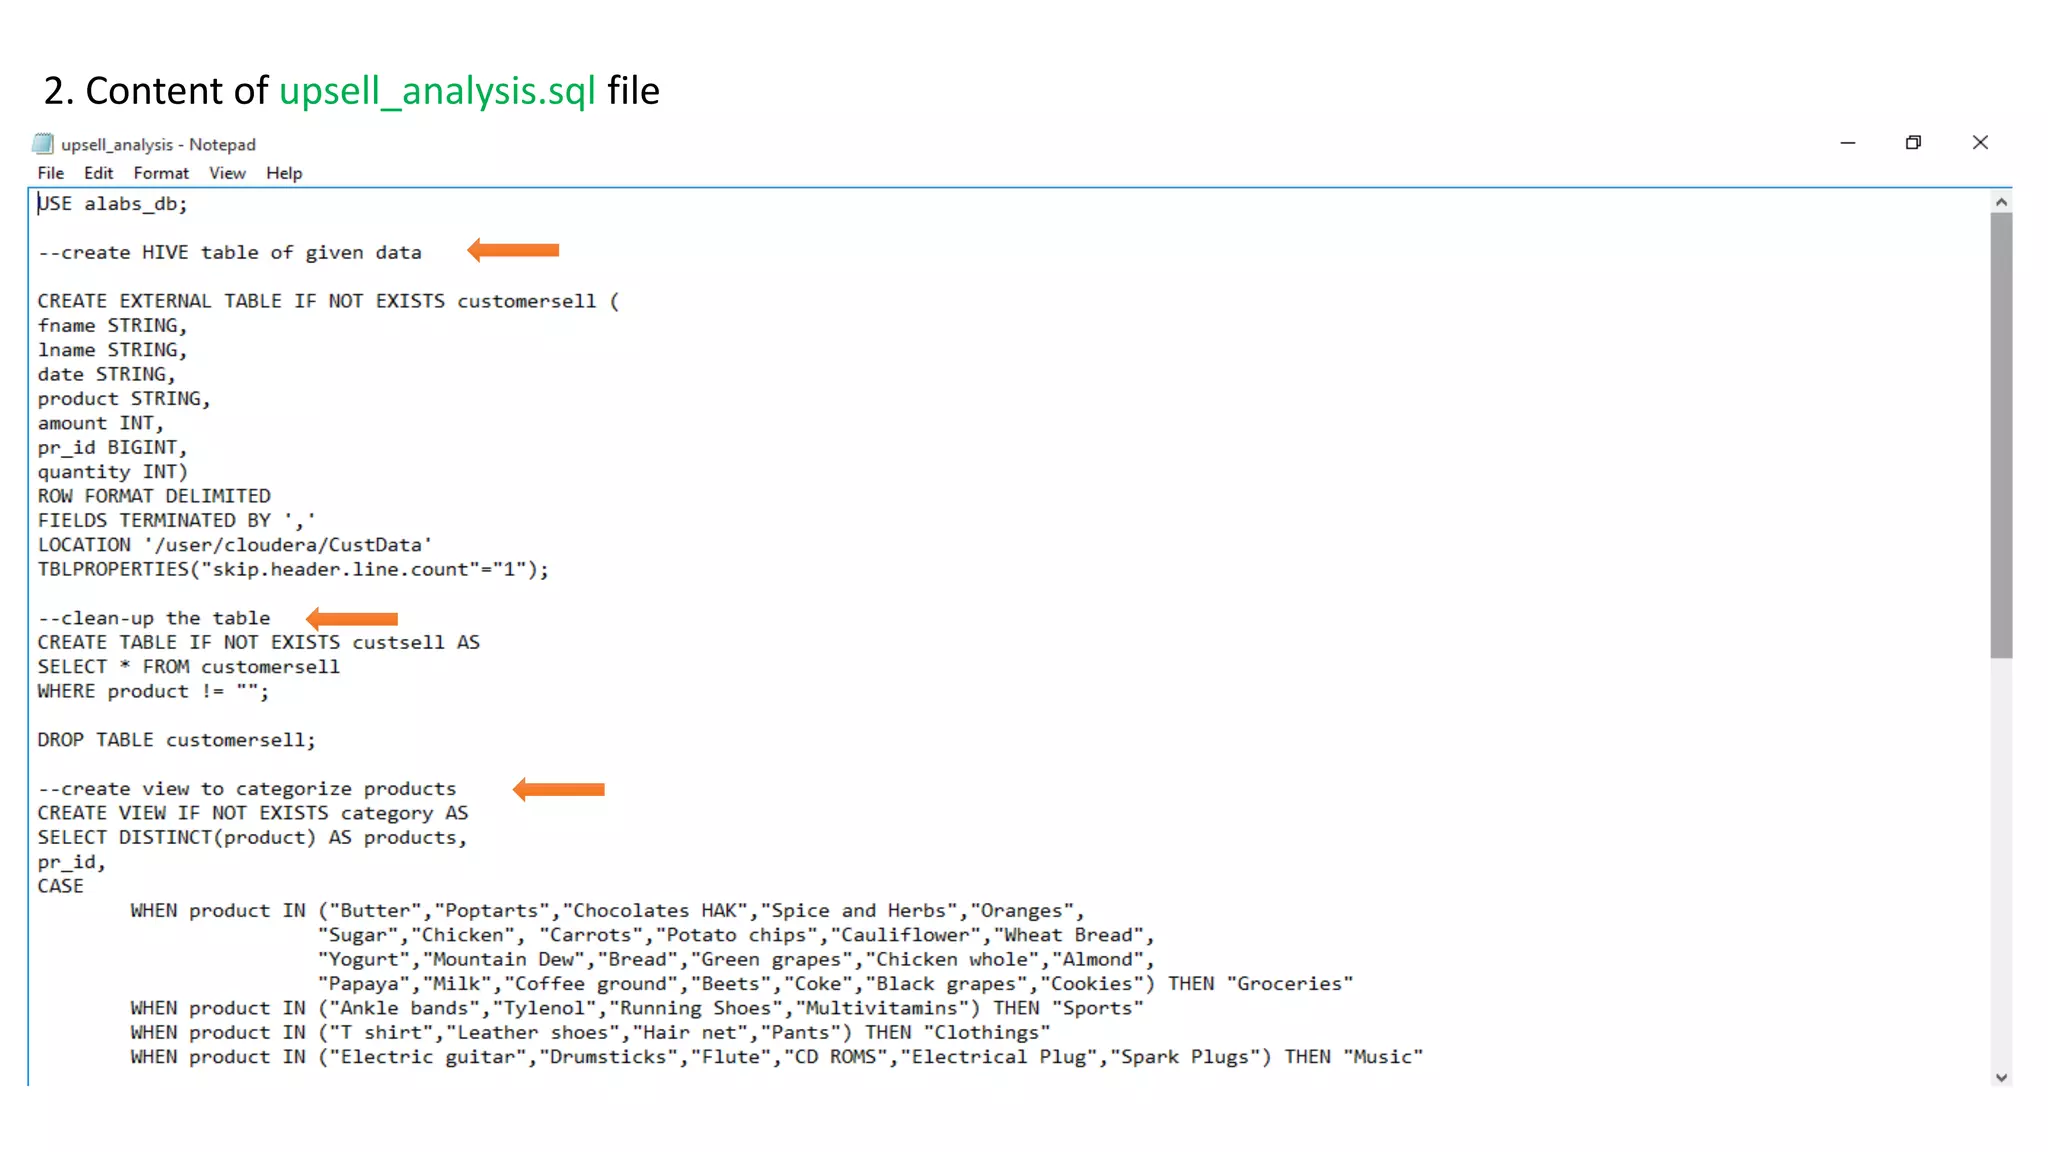
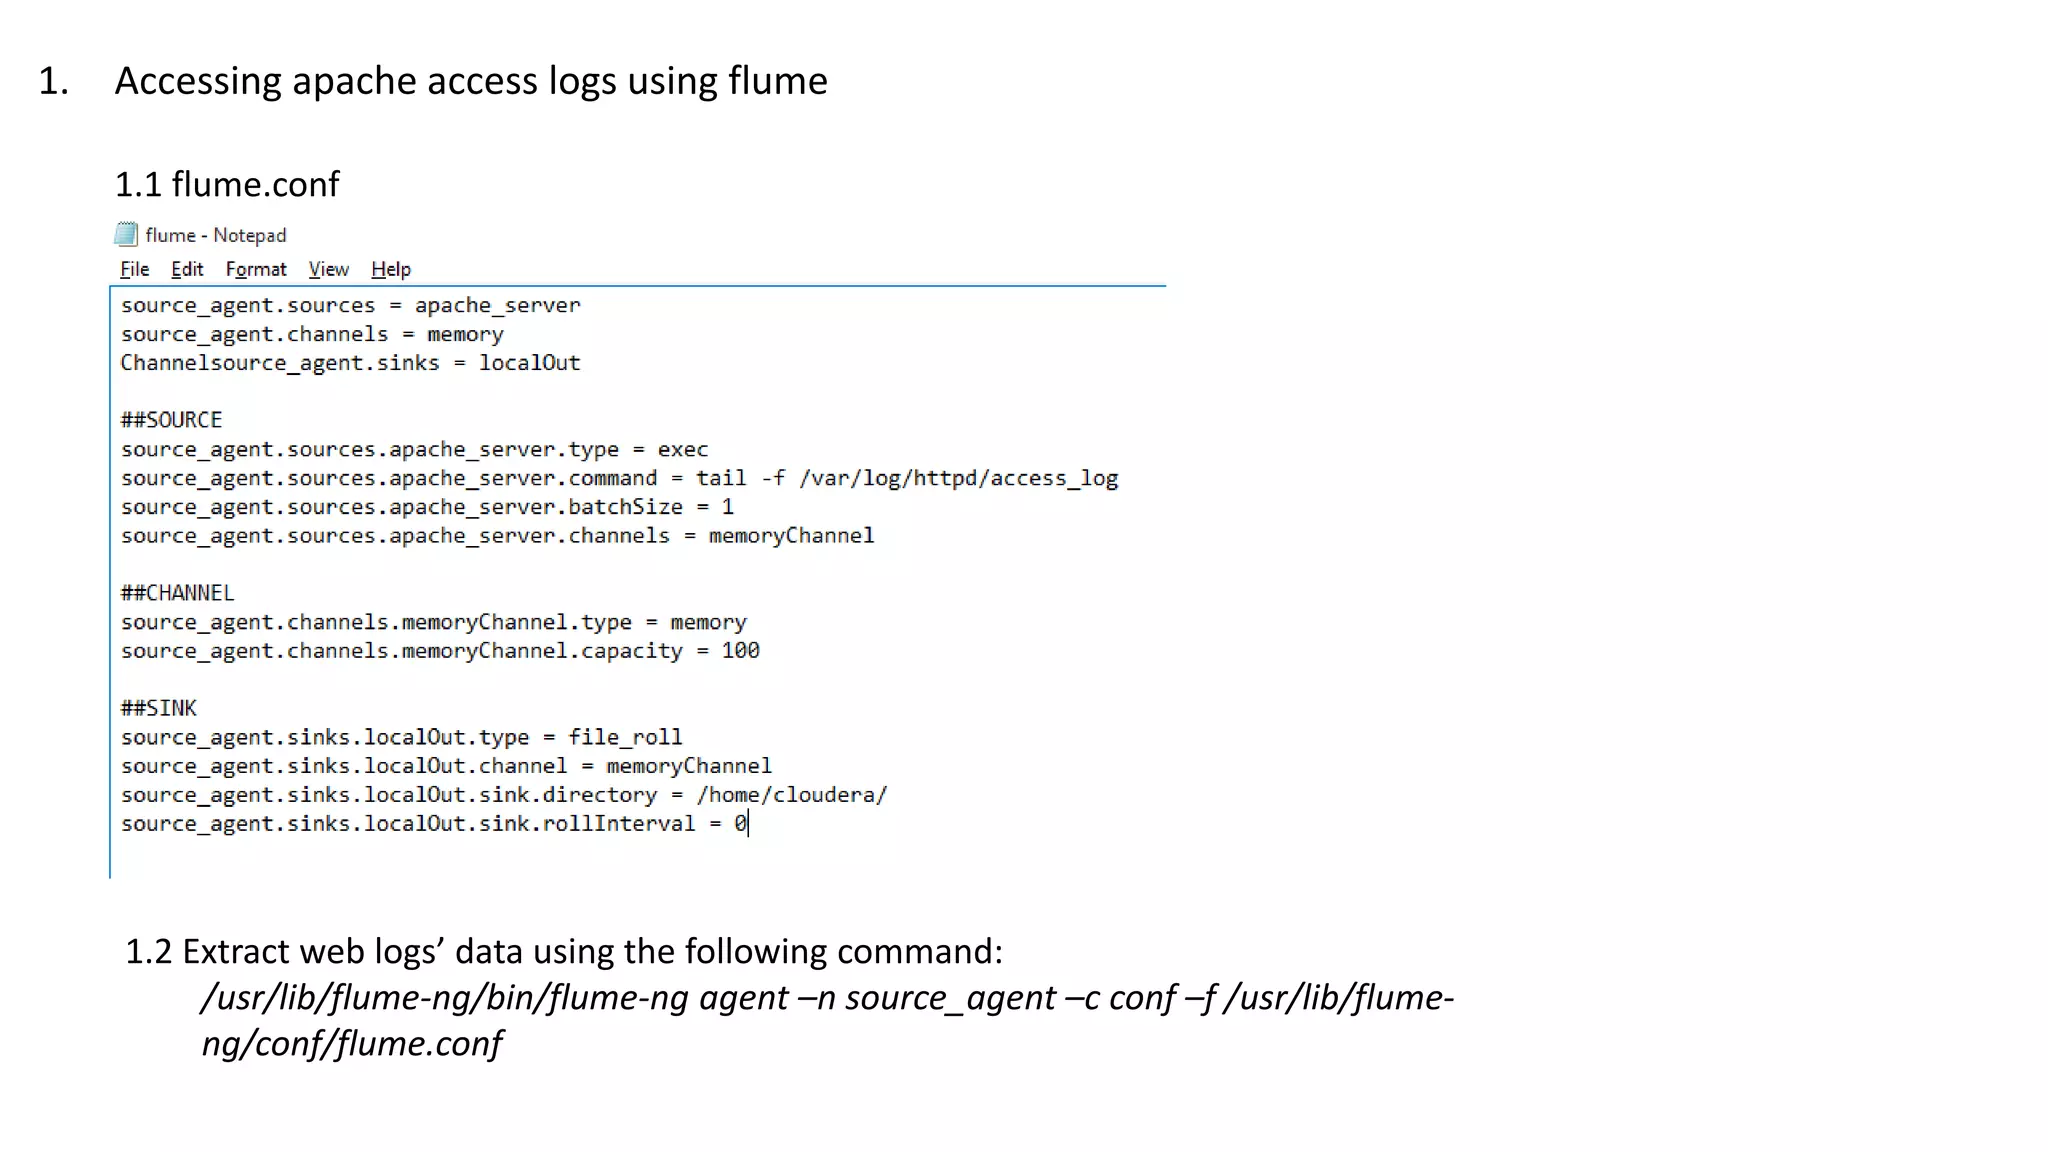
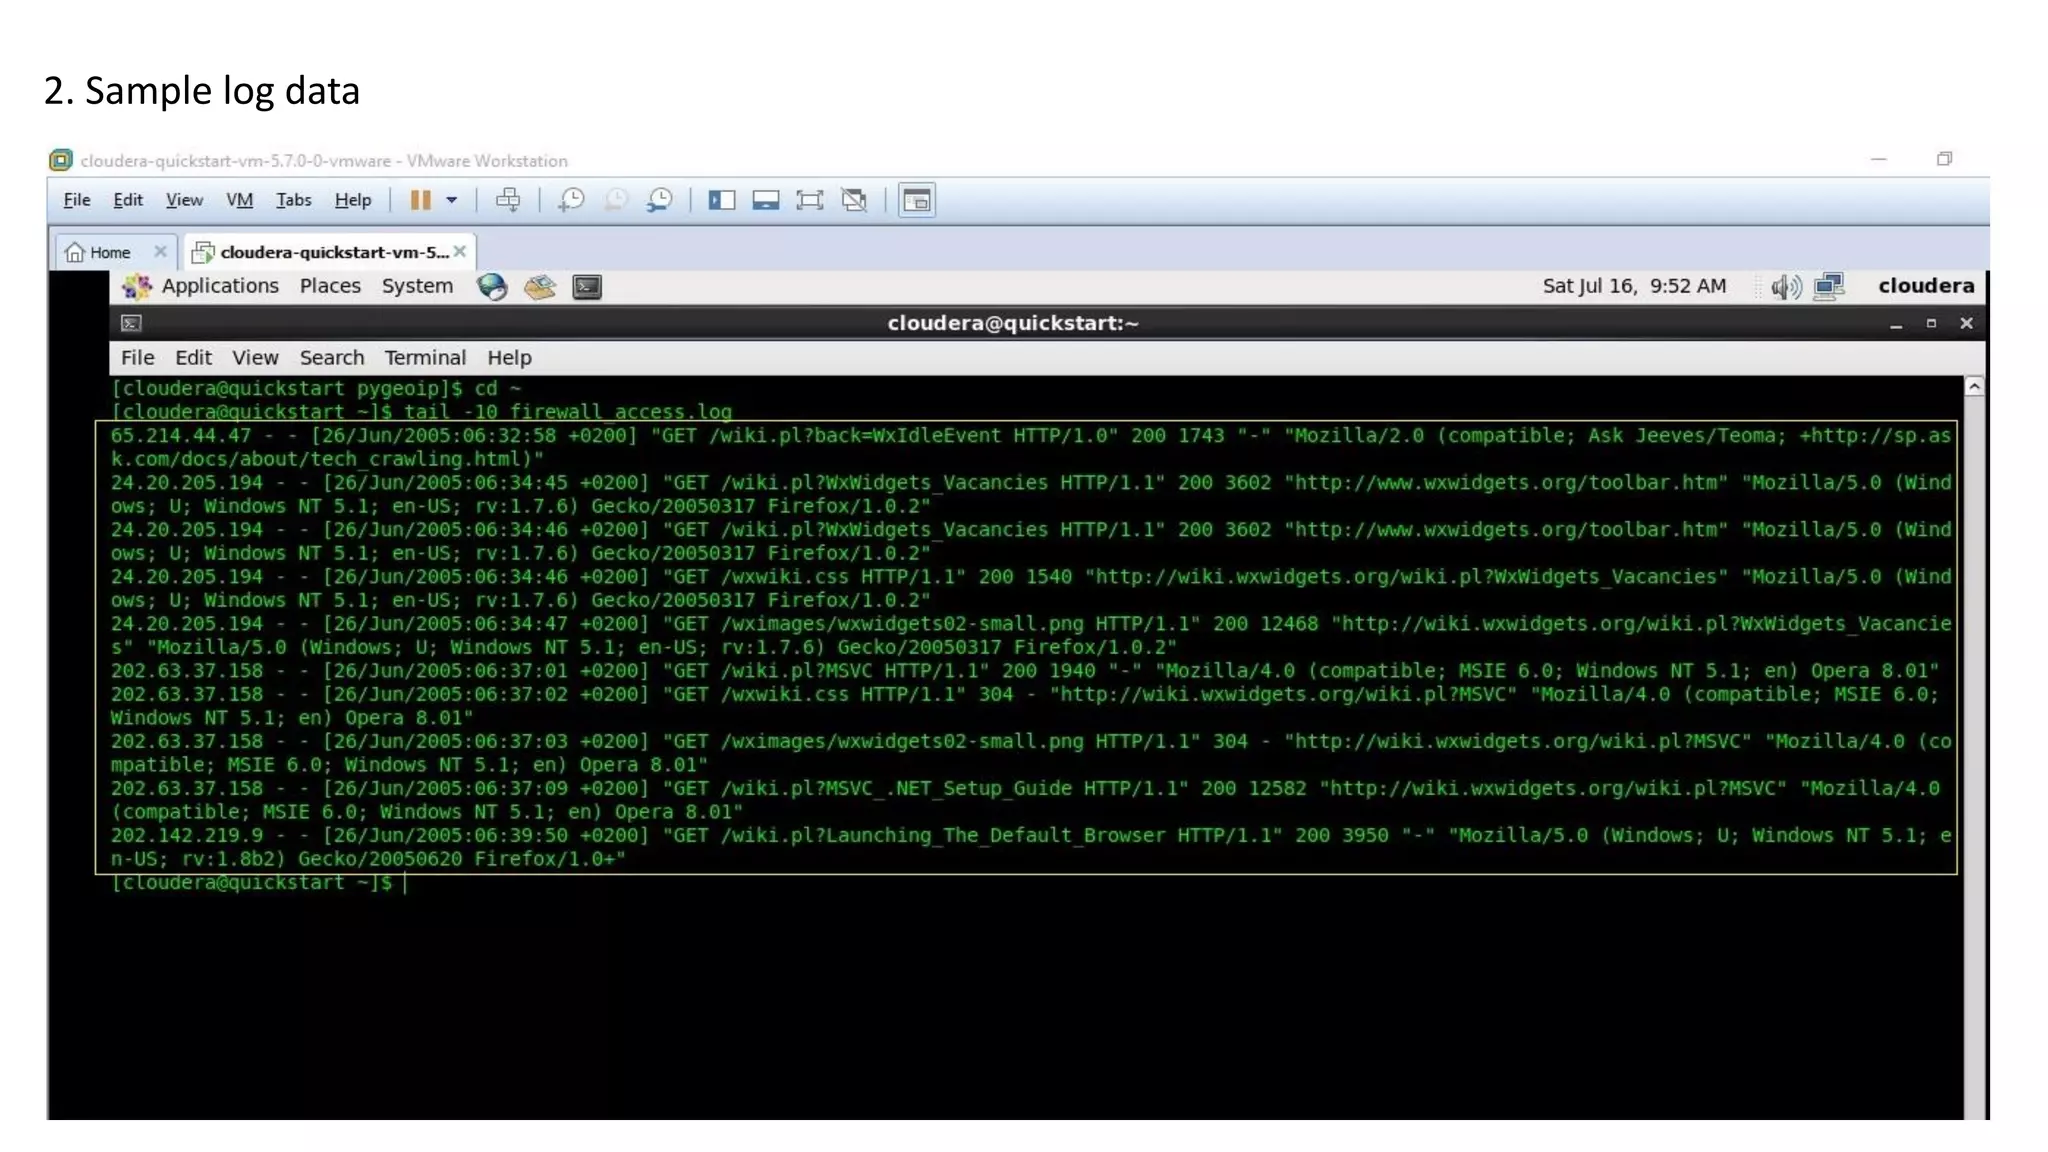
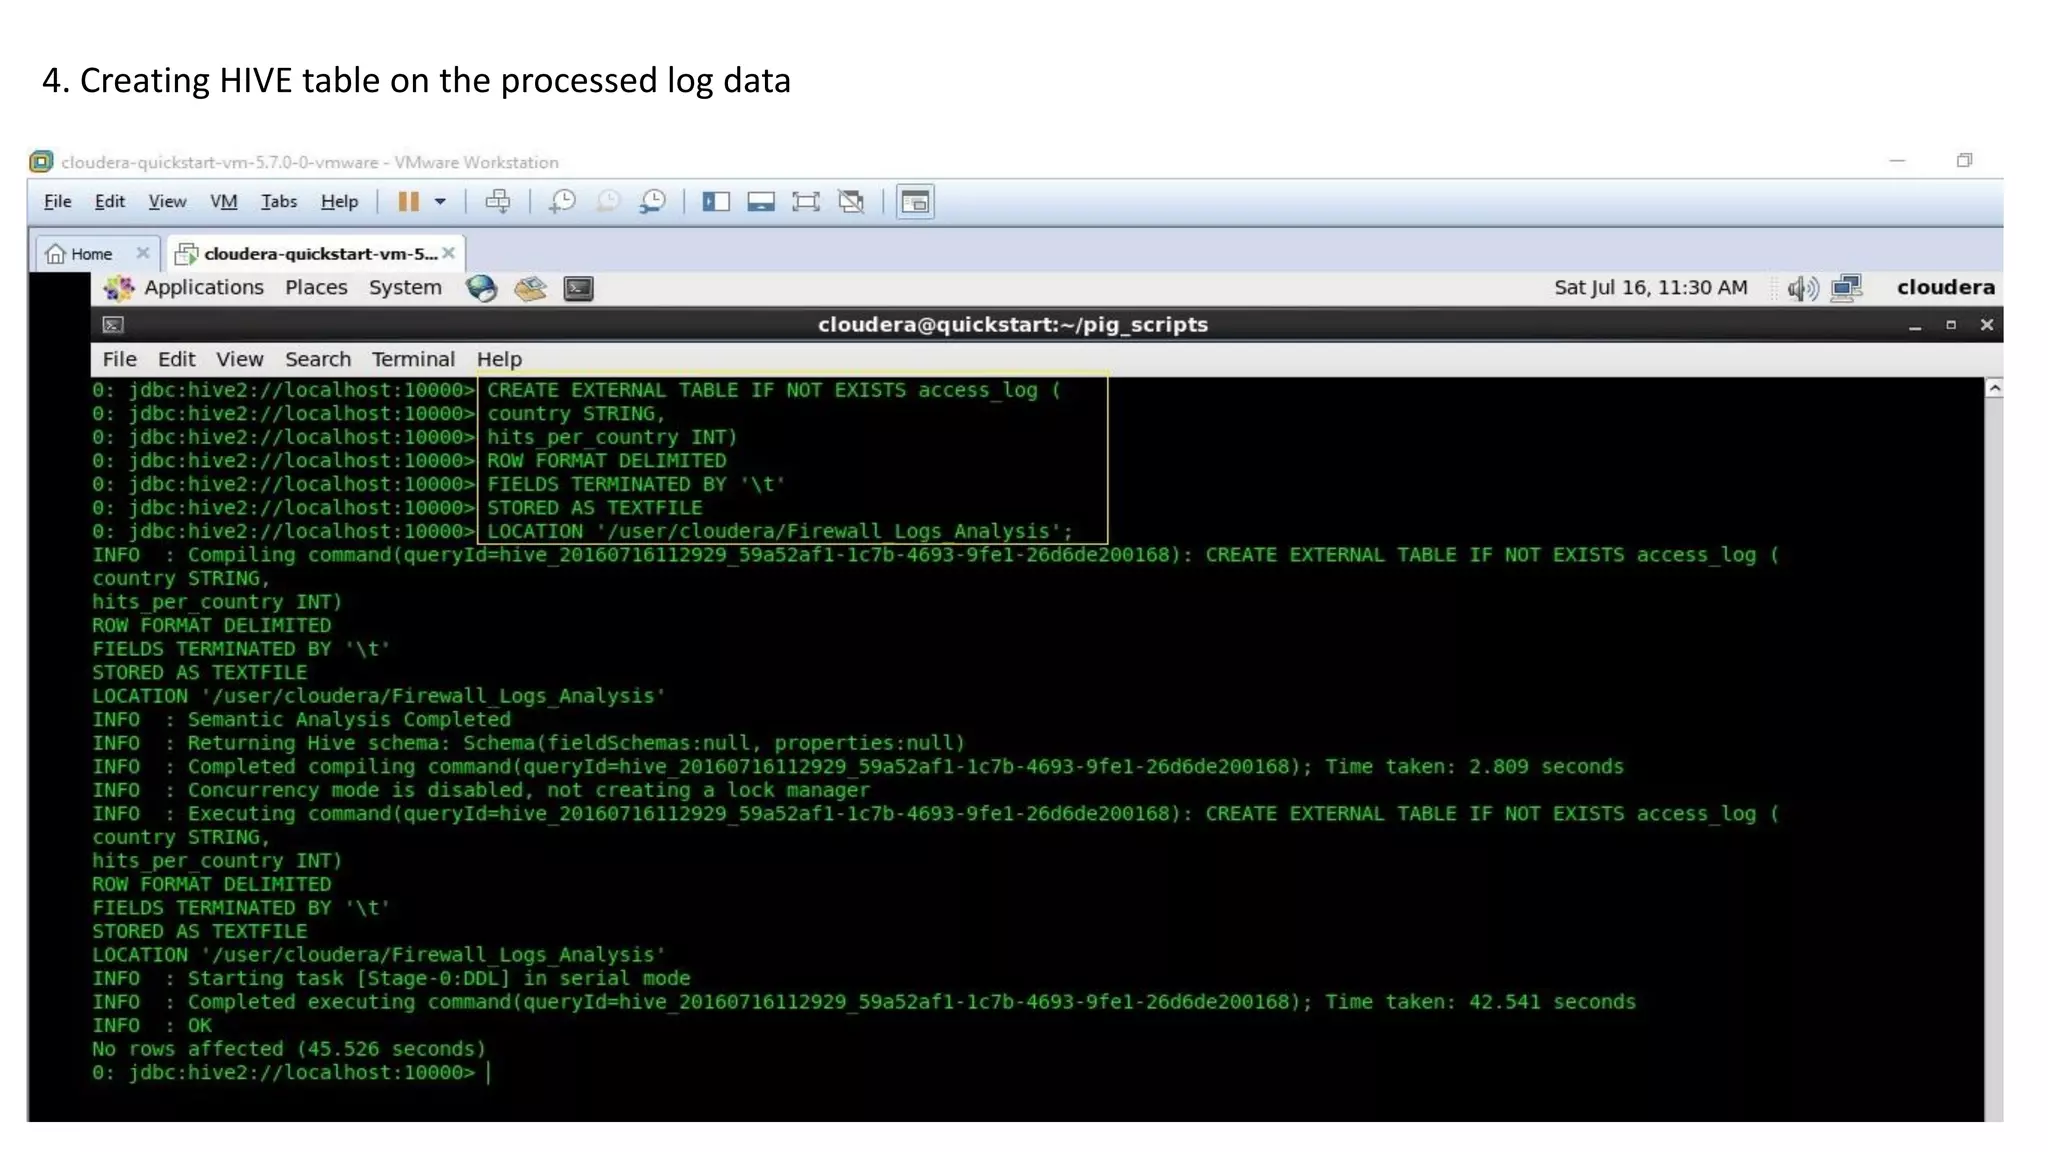
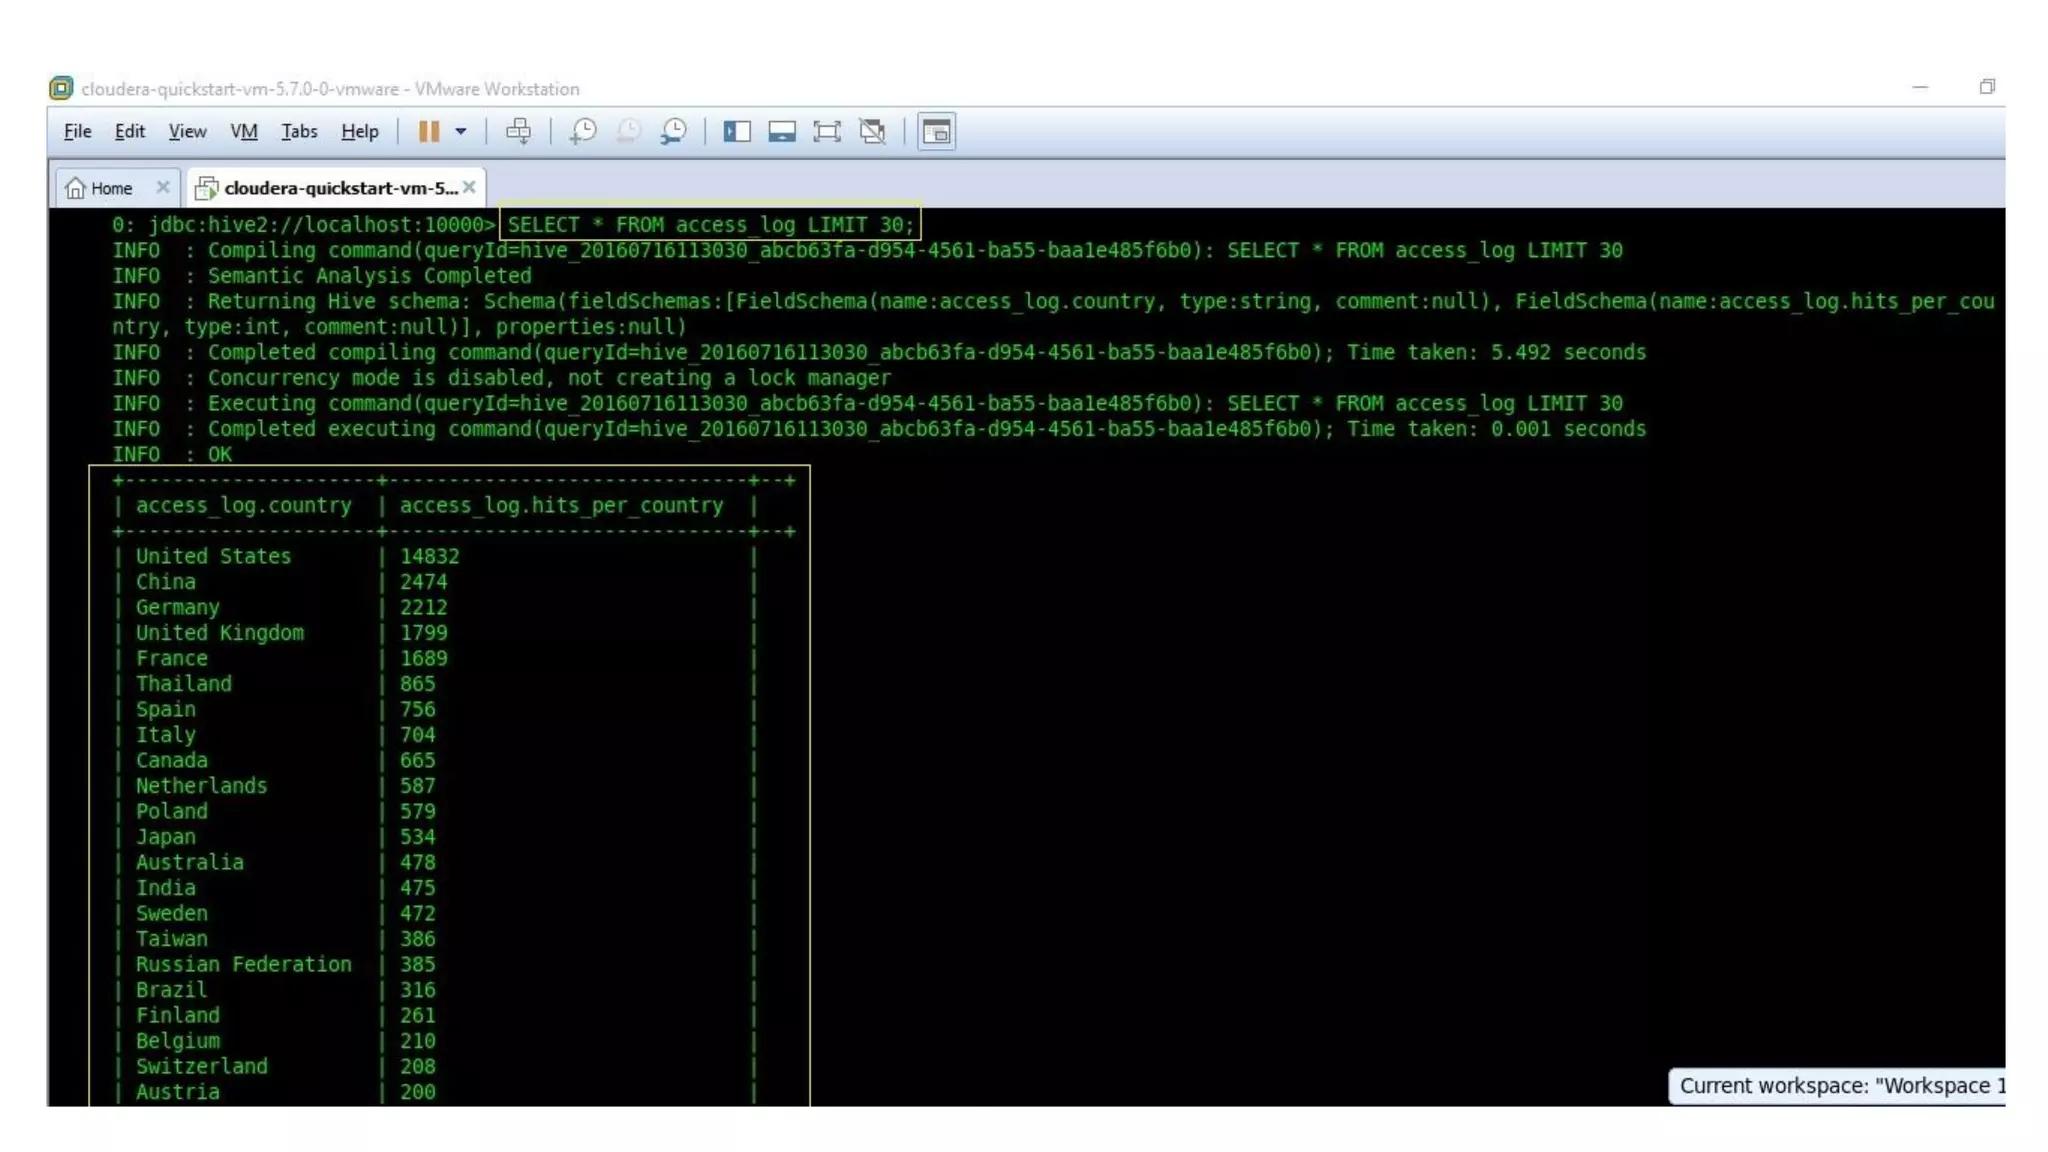
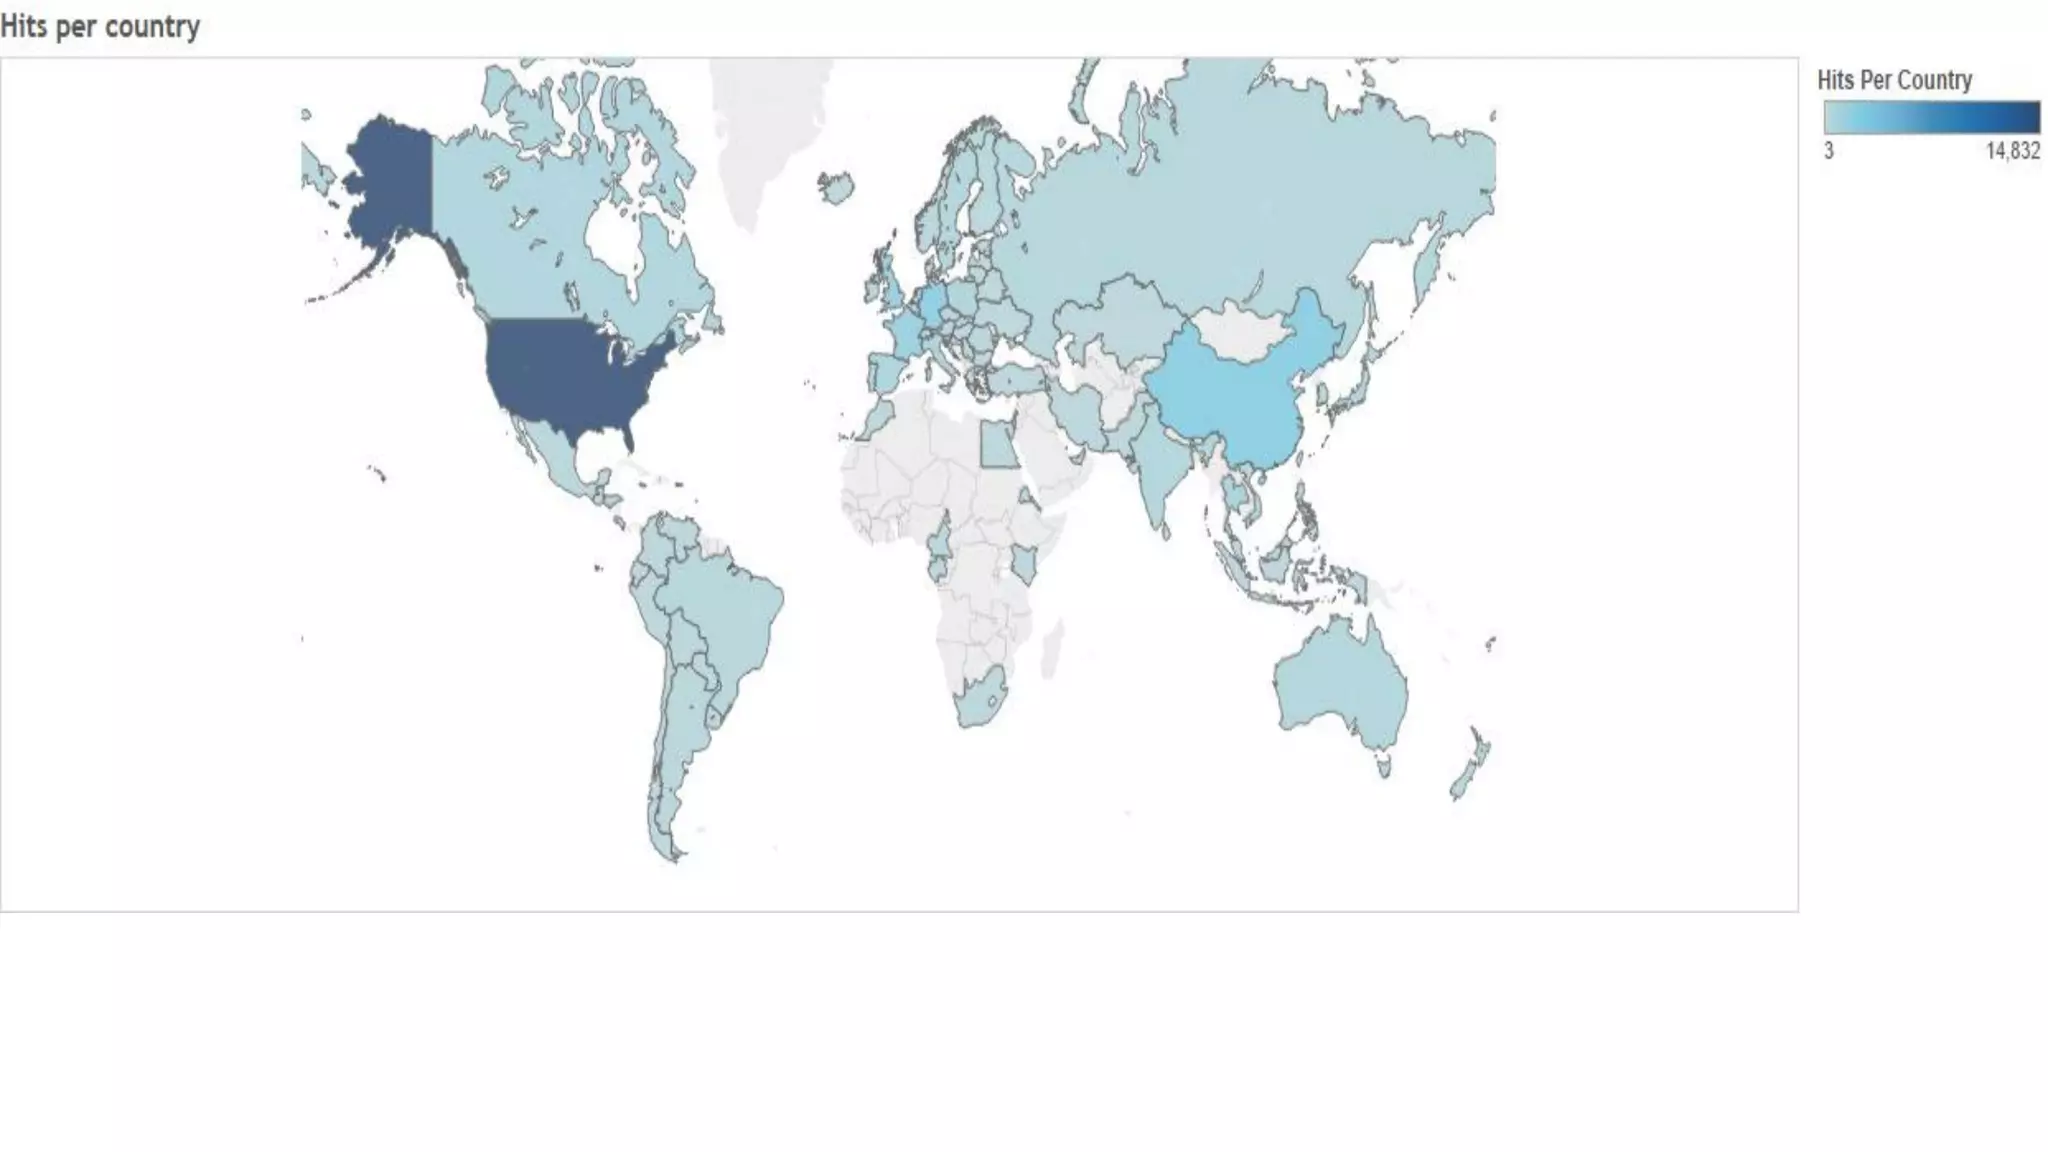
PROJECT 1: Analyzing clickstream data
On a Web site, clickstream analysis (sometimes called clickstream analytics) is the process of collecting, analyzing, and
reporting aggregate data about which pages visitors visit in what order - which are the result of the succession of mouse
clicks each visitor makes (that is, the clickstream).
Download Link
1. Loading the data files into HDFS
2. Starting the new Beeline shell (hive-server 2)
3. Creating new database – alabs_db
4.Creating and loading HIVE table – users
5. All 3 HIVE base tables – omniturelogs, products and users created
6. Content of HIVE script – webanalytics.sql
6. Using webanalytics.sql, omniture and webanalytics tables are created
7. Creating omniture2 view
PROJECT 2: Sentiment
Analysis/Opinion Mining
Sentiment analysis (also known as opinion mining) refers to the use of natural language processing, text analysis and
computational linguistics to identify and extract subjective information in source materials. Sentiment analysis is widely
applied to reviews and social media for a variety of applications, ranging from marketing to customer service.
Data Download Link
Tableau Link
1. Loading the data files into HDFS
2. Content of twitter_conf.conf file
3. Executing the TwitterAgent flume agent using twitter_conf.conf file
4. Twitter data moved to HDFS
5. Content of tweets.sql file
6. Executing tweets.sql to create tables and views for analysis
7. Tables and views for analysis are created
Tweets ID sentiment
PROJECT 3: Lending
Club Loan Analysis
Lending Club is a US peer-to-peer lending company. Lending Club operates an online lending platform that enables
borrowers to obtain a loan, and investors to purchase notes backed by payments made on loans. Lending Club is the
world's largest peer-to-peer lending platform.
Data Download Link
Tableau Link
1. Loading the data files into HDFS
2. Content of loan_analysis.sql file
3. Tables and view created using loan_analysis.sql
PROJECT 4: HVAC
Temperature Analysis
HVAC (stands for Heating, Ventilation and Air Conditioning) equipment needs a control system to regulate the operation of
a heating and/or air conditioning system. Usually a sensing device is used to compare the actual state (e.g. temperature)
with a target state. Then the control system draws a conclusion what action has to be taken.
Data Download Link
Tableau Link
1. Loading the data files into HDFS
2. Content of sensor_analysis.sql file
3. Tables and view created using sensor_analysis.sql
PROJECT 5: Upsell Analysis
Upselling is a sales technique whereby a seller induces the customer to purchase more expensive items, upgrades or other
add-ons in an attempt to make a more profitable sale.
Data Download Link
1. Sample data
2. Content of upsell_analysis.sql file
A
B
C
3. A
What is A doing?
• Concatenates first name and last name to a single field – name
• Assigns each customer a category
• Calculates the total amount spent by the customer in each category
• Order customers by the total amount spent in descending order
4. B
4.1 What is B doing?
• Extracts name from A
• Each customer is assigned his respective categories using COLLECT_LIST() function which converts
multiple rows to a single row of array datatype
• Each customer is assigned his respective amount spent on those categories
• Calculating the overall total amount spent by each customer on all categories
• Evaluating the recommended category for each customer as per the amount spent per category
4.2 Sample data of B
5. Sample data after C
PROJECT 6: Web Logs’ Analysis
An access log is a list of all the requests for individual files that people have requested from a Web site. These files will
include the HTML files and their imbedded graphic images and any other associated files that get transmitted. The access
log (sometimes referred to as the "raw data") can be analysed and summarized by another program.
Data Download Link
Tableau Link
1. Accessing apache access logs using flume
1.1 flume.conf
1.2 Extract web logs’ data using the following command:
/usr/lib/flume-ng/bin/flume-ng agent –n source_agent –c conf –f /usr/lib/flume-
ng/conf/flume.conf
2. Sample log data
3. Moving log file to HDFS
3. PIG script – log_processing.pig
3.1 Content
3.2 Execution
4. Creating HIVE table on the processed log data
Sagnik_AnalytixLabs_Projects

Sagnik_AnalytixLabs_Projects

  • 1.
    PROJECT 1: Analyzingclickstream data On a Web site, clickstream analysis (sometimes called clickstream analytics) is the process of collecting, analyzing, and reporting aggregate data about which pages visitors visit in what order - which are the result of the succession of mouse clicks each visitor makes (that is, the clickstream). Download Link
  • 2.
    1. Loading thedata files into HDFS
  • 3.
    2. Starting thenew Beeline shell (hive-server 2)
  • 4.
    3. Creating newdatabase – alabs_db
  • 5.
    4.Creating and loadingHIVE table – users
  • 7.
    5. All 3HIVE base tables – omniturelogs, products and users created
  • 8.
    6. Content ofHIVE script – webanalytics.sql
  • 9.
    6. Using webanalytics.sql,omniture and webanalytics tables are created
  • 10.
  • 17.
    PROJECT 2: Sentiment Analysis/OpinionMining Sentiment analysis (also known as opinion mining) refers to the use of natural language processing, text analysis and computational linguistics to identify and extract subjective information in source materials. Sentiment analysis is widely applied to reviews and social media for a variety of applications, ranging from marketing to customer service. Data Download Link Tableau Link
  • 18.
    1. Loading thedata files into HDFS
  • 19.
    2. Content oftwitter_conf.conf file
  • 20.
    3. Executing theTwitterAgent flume agent using twitter_conf.conf file
  • 21.
    4. Twitter datamoved to HDFS
  • 22.
    5. Content oftweets.sql file
  • 25.
    6. Executing tweets.sqlto create tables and views for analysis
  • 26.
    7. Tables andviews for analysis are created
  • 27.
  • 28.
    PROJECT 3: Lending ClubLoan Analysis Lending Club is a US peer-to-peer lending company. Lending Club operates an online lending platform that enables borrowers to obtain a loan, and investors to purchase notes backed by payments made on loans. Lending Club is the world's largest peer-to-peer lending platform. Data Download Link Tableau Link
  • 29.
    1. Loading thedata files into HDFS
  • 30.
    2. Content ofloan_analysis.sql file
  • 33.
    3. Tables andview created using loan_analysis.sql
  • 39.
    PROJECT 4: HVAC TemperatureAnalysis HVAC (stands for Heating, Ventilation and Air Conditioning) equipment needs a control system to regulate the operation of a heating and/or air conditioning system. Usually a sensing device is used to compare the actual state (e.g. temperature) with a target state. Then the control system draws a conclusion what action has to be taken. Data Download Link Tableau Link
  • 40.
    1. Loading thedata files into HDFS
  • 41.
    2. Content ofsensor_analysis.sql file
  • 43.
    3. Tables andview created using sensor_analysis.sql
  • 46.
    PROJECT 5: UpsellAnalysis Upselling is a sales technique whereby a seller induces the customer to purchase more expensive items, upgrades or other add-ons in an attempt to make a more profitable sale. Data Download Link
  • 47.
  • 48.
    2. Content ofupsell_analysis.sql file
  • 49.
  • 50.
    3. A What isA doing? • Concatenates first name and last name to a single field – name • Assigns each customer a category • Calculates the total amount spent by the customer in each category • Order customers by the total amount spent in descending order
  • 51.
    4. B 4.1 Whatis B doing? • Extracts name from A • Each customer is assigned his respective categories using COLLECT_LIST() function which converts multiple rows to a single row of array datatype • Each customer is assigned his respective amount spent on those categories • Calculating the overall total amount spent by each customer on all categories • Evaluating the recommended category for each customer as per the amount spent per category
  • 52.
  • 53.
  • 54.
    PROJECT 6: WebLogs’ Analysis An access log is a list of all the requests for individual files that people have requested from a Web site. These files will include the HTML files and their imbedded graphic images and any other associated files that get transmitted. The access log (sometimes referred to as the "raw data") can be analysed and summarized by another program. Data Download Link Tableau Link
  • 55.
    1. Accessing apacheaccess logs using flume 1.1 flume.conf 1.2 Extract web logs’ data using the following command: /usr/lib/flume-ng/bin/flume-ng agent –n source_agent –c conf –f /usr/lib/flume- ng/conf/flume.conf
  • 56.
  • 57.
    3. Moving logfile to HDFS
  • 58.
    3. PIG script– log_processing.pig 3.1 Content
  • 59.
  • 61.
    4. Creating HIVEtable on the processed log data