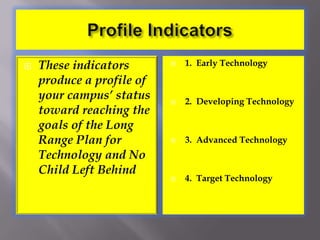
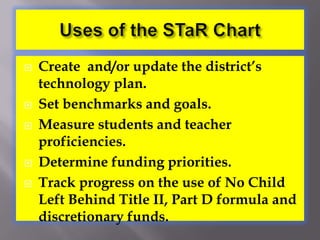
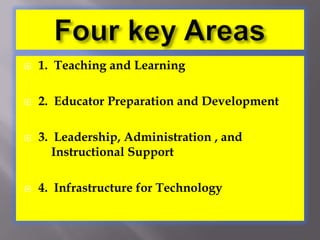
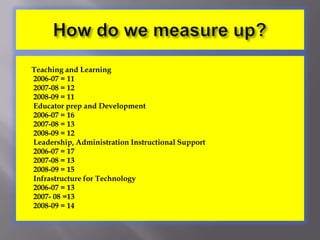
STaRSchool Technology and Readiness Chart
So what is the STaR Chart?* Tool designed for use in technology 	planning.*  Budgeting for resources*  Evaluation of progress in local technology        	projects.
ProfileIndicatorsThese indicators produce a profile of your campus’ status toward reaching the goals of the Long Range Plan for Technology and No Child Left Behind1.  Early Technology2.  Developing Technology3.  Advanced Technology4.  Target Technology
Uses of the STaR ChartCreate  and/or update the district’s technology plan.Set benchmarks and goals.Measure students and teacher proficiencies.Determine funding priorities.Track progress on the use of No Child Left Behind Title II, Part D formula and discretionary funds.
Four key Areas1.  Teaching and Learning2.  Educator Preparation and Development3.  Leadership, Administration , and 	Instructional Support4.  Infrastructure for Technology
How do we measure up?    Teaching and Learning      2006-07 = 11     2007-08 = 12     2008-09 = 11     Educator prep and Development    2006-07 = 16    2007-08 = 13    2008-09 = 12    Leadership, Administration Instructional Support    2006-07 = 17    2007-08 = 13    2008-09 = 15    Infrastructure for Technology    2006-07 = 13    2007- 08 =13    2008-09 = 14
Summary  Learning for the 21st Century requires:    New Skills     New Tools     New Online Assessments     New Knowledge     New Opportunities for when, where, and how learning takes place
Check Out!!!     Texas Campus STaR Chart               http://starchart.esc12.net

S ta r power point

  • 1.
  • 2.
    So what isthe STaR Chart?* Tool designed for use in technology planning.* Budgeting for resources* Evaluation of progress in local technology projects.
  • 3.
    ProfileIndicatorsThese indicators producea profile of your campus’ status toward reaching the goals of the Long Range Plan for Technology and No Child Left Behind1. Early Technology2. Developing Technology3. Advanced Technology4. Target Technology
  • 4.
    Uses of theSTaR ChartCreate and/or update the district’s technology plan.Set benchmarks and goals.Measure students and teacher proficiencies.Determine funding priorities.Track progress on the use of No Child Left Behind Title II, Part D formula and discretionary funds.
  • 5.
    Four key Areas1. Teaching and Learning2. Educator Preparation and Development3. Leadership, Administration , and Instructional Support4. Infrastructure for Technology
  • 6.
    How do wemeasure up? Teaching and Learning 2006-07 = 11 2007-08 = 12 2008-09 = 11 Educator prep and Development 2006-07 = 16 2007-08 = 13 2008-09 = 12 Leadership, Administration Instructional Support 2006-07 = 17 2007-08 = 13 2008-09 = 15 Infrastructure for Technology 2006-07 = 13 2007- 08 =13 2008-09 = 14
  • 7.
    Summary Learningfor the 21st Century requires: New Skills New Tools New Online Assessments New Knowledge New Opportunities for when, where, and how learning takes place
  • 8.
    Check Out!!! Texas Campus STaR Chart http://starchart.esc12.net