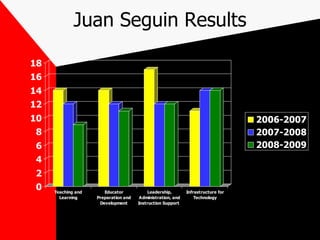
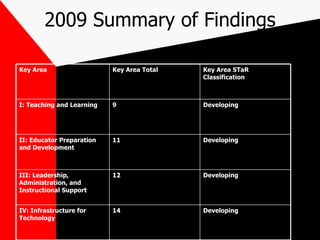
STaR Charts: What are they and why do we do them?
Agenda Introduction to STaR Juan Seguin School Results Summary of findings
STaR STaR= School Technology and Readiness Tool designed to use in technology planning, budgeting, and evaluation Produces a campus profile towards reaching goals of Long-Range Technology Plan http://starchart.esc12.net/
Four Measurement Areas I: Teaching and Learning II: Educator Preparation and Development III: Leadership, Administration, and Instructional Support Infrastructure for Technology
Juan Seguin Results
2009 Summary of Findings Developing 14 IV: Infrastructure for Technology  Developing 12 III: Leadership, Administration, and Instructional Support Developing 11 II: Educator Preparation and Development Developing 9 I: Teaching and Learning Key Area STaR Classification Key Area Total Key Area

S ta r charts

  • 1.
    STaR Charts: Whatare they and why do we do them?
  • 2.
    Agenda Introduction toSTaR Juan Seguin School Results Summary of findings
  • 3.
    STaR STaR= SchoolTechnology and Readiness Tool designed to use in technology planning, budgeting, and evaluation Produces a campus profile towards reaching goals of Long-Range Technology Plan http://starchart.esc12.net/
  • 4.
    Four Measurement AreasI: Teaching and Learning II: Educator Preparation and Development III: Leadership, Administration, and Instructional Support Infrastructure for Technology
  • 5.
  • 6.
    2009 Summary ofFindings Developing 14 IV: Infrastructure for Technology Developing 12 III: Leadership, Administration, and Instructional Support Developing 11 II: Educator Preparation and Development Developing 9 I: Teaching and Learning Key Area STaR Classification Key Area Total Key Area