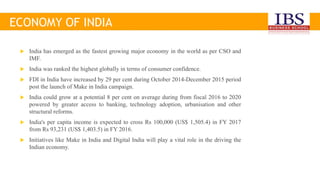
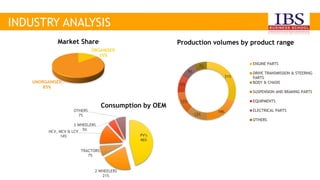
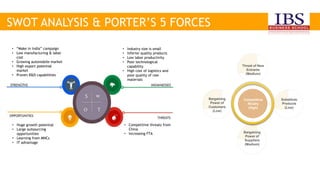
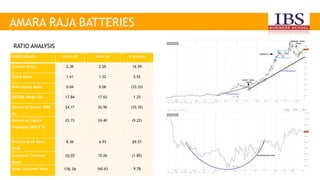
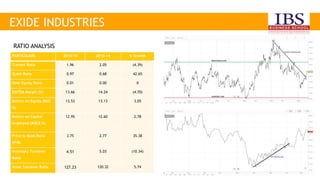
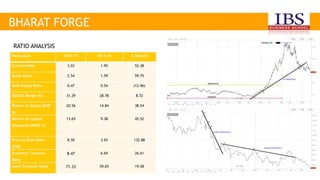
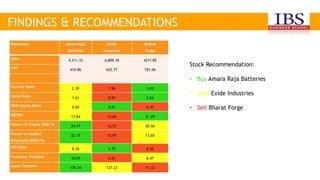
Fundamental And
Technical Analysis Of
Indian Automobile Industry
By Rushil Shah
(15BSP1879)
 India has emerged as the fastest growing major economy in the world as per CSO and
IMF.
 India was ranked the highest globally in terms of consumer confidence.
 FDI in India have increased by 29 per cent during October 2014-December 2015 period
post the launch of Make in India campaign.
 India could grow at a potential 8 per cent on average during from fiscal 2016 to 2020
powered by greater access to banking, technology adoption, urbanisation and other
structural reforms.
 India's per capita income is expected to cross Rs 100,000 (US$ 1,505.4) in FY 2017
from Rs 93,231 (US$ 1,403.5) in FY 2016.
 Initiatives like Make in India and Digital India will play a vital role in the driving the
Indian economy.
ECONOMY OF INDIA
INDUSTRY ANALYSIS
31%
19%
12%
12%
10%
9%
7%
Production volumes by product range
ENGINE PARTS
DRIVE TRANSMISSION & STEERING
PARTS
BODY & CHASIS
SUSPENSION AND BRAKING PARTS
EQUIPMENTS
ELECTRICAL PARTS
OTHERS
ORGANISED
15%
UNORGANISED
85%
Market Share
PV's
46%
2 WHEELERS
21%
TRACTORS
7%
HCV, MCV & LCV
14%
3 WHEELERS
5%
OTHERS
7%
Consumption by OEM
SWOT ANALYSIS & PORTER’S 5 FORCES
Bargaining
Power of
Customers
(Low)
Bargaining
Power of
Suppliers
(Medium)
Substitute
Products
(Low)
Threat of New
Entrants
(Medium)
Competitive
Rivalry
(High)
• “Make in India” campaign
• Low manufacturing & labor
cost
• Growing automobile market
• High export potential
market
• Proven R&D capabilities
• Industry size is small
• Inferior quality products
• Low labor productivity
• Poor technological
capability
• High cost of logistics and
poor quality of raw
materials
• Huge growth potential
• Large outsourcing
opportunities
• Learning from MNCs
• IT advantage
• Competitive threats from
China
• Increasing FTA
AMARA RAJA BATTERIES
PARTICULARS 2014-15 2013-14 % Growth
Current Ratio 2.39 2.05 16.59
Quick Ratio 1.61 1.52 5.92
Debt Equity Ratio 0.04 0.06 (33.33)
EBITDA Margin (%) 17.84 17.62 1.25
Return on Equity (ROE
%)
24.17 26.96 (10.35)
Return on Capital
Employed (ROCE %)
22.15 24.40 (9.22)
Price to Book Ratio
(P/B)
8.36 4.93 69.57
Inventory Turnover
Ratio
10.07 10.26 (1.85)
Asset Turnover Ratio 176.34 160.63 9.78
RATIO ANALYSIS
EXIDE INDUSTRIES
PARTICULARS 2014-15 2013-14 % Growth
Current Ratio 1.96 2.05 (4.39)
Quick Ratio 0.97 0.68 42.65
Debt Equity Ratio 0.01 0.00 0
EBITDA Margin (%) 13.66 14.24 (4.70)
Return on Equity (ROE
%)
13.53 13.13 3.05
Return on Capital
Employed (ROCE %)
12.95 12.60 2.78
Price to Book Ratio
(P/B)
3.75 2.77 35.38
Inventory Turnover
Ratio
4.51 5.03 (10.34)
Asset Turnover Ratio 127.23 120.32 5.74
RATIO ANALYSIS
BHARAT FORGE
Particulars 2014-15 2013-14 % Growth
Current Ratio 3.03 1.95 55.38
Quick Ratio 2.54 1.59 59.75
Debt Equity Ratio 0.47 0.54 (12.96)
EBITDA Margin (%) 31.29 28.78 8.72
Return on Equity (ROE
%)
20.56 14.84 38.54
Return on Capital
Employed (ROCE %)
13.65 9.38 45.52
Price to Book Ratio
(P/B)
8.50 3.65 132.88
Inventory Turnover
Ratio
8.47 6.69 26.61
Asset Turnover Ratio 71.33 59.65 19.58
RATIO ANALYSIS
FINDINGS & RECOMMENDATIONS
Particulars Amara Raja
Batteries
Exide
Industries
Bharat
Forge
Sales 4,211.33 6,809.18 4211.85
PAT 410.86 622.77 701.06
Current Ratio 2.39 1.96 3.03
Quick Ratio 1.61 0.97 2.54
Debt Equity Ratio 0.04 0.01 0.47
EBITDA 17.84 13.66 31.29
Return on Equity (ROE %) 24.17 13.53 20.56
Return on Capital
Employed (ROCE %)
22.15 12.95 13.65
P/B Ratio 8.36 3.75 8.50
Inventory Turnover 10.07 4.51 8.47
Asset Turnover 176.34 127.23 71.33
Stock Recommendation:
• Buy Amara Raja Batteries
• Hold Exide Industries
• Sell Bharat Forge
THANK YOU

Rushil (15BSP1879)

  • 1.
    Fundamental And Technical AnalysisOf Indian Automobile Industry By Rushil Shah (15BSP1879)
  • 2.
     India hasemerged as the fastest growing major economy in the world as per CSO and IMF.  India was ranked the highest globally in terms of consumer confidence.  FDI in India have increased by 29 per cent during October 2014-December 2015 period post the launch of Make in India campaign.  India could grow at a potential 8 per cent on average during from fiscal 2016 to 2020 powered by greater access to banking, technology adoption, urbanisation and other structural reforms.  India's per capita income is expected to cross Rs 100,000 (US$ 1,505.4) in FY 2017 from Rs 93,231 (US$ 1,403.5) in FY 2016.  Initiatives like Make in India and Digital India will play a vital role in the driving the Indian economy. ECONOMY OF INDIA
  • 3.
    INDUSTRY ANALYSIS 31% 19% 12% 12% 10% 9% 7% Production volumesby product range ENGINE PARTS DRIVE TRANSMISSION & STEERING PARTS BODY & CHASIS SUSPENSION AND BRAKING PARTS EQUIPMENTS ELECTRICAL PARTS OTHERS ORGANISED 15% UNORGANISED 85% Market Share PV's 46% 2 WHEELERS 21% TRACTORS 7% HCV, MCV & LCV 14% 3 WHEELERS 5% OTHERS 7% Consumption by OEM
  • 4.
    SWOT ANALYSIS &PORTER’S 5 FORCES Bargaining Power of Customers (Low) Bargaining Power of Suppliers (Medium) Substitute Products (Low) Threat of New Entrants (Medium) Competitive Rivalry (High) • “Make in India” campaign • Low manufacturing & labor cost • Growing automobile market • High export potential market • Proven R&D capabilities • Industry size is small • Inferior quality products • Low labor productivity • Poor technological capability • High cost of logistics and poor quality of raw materials • Huge growth potential • Large outsourcing opportunities • Learning from MNCs • IT advantage • Competitive threats from China • Increasing FTA
  • 5.
    AMARA RAJA BATTERIES PARTICULARS2014-15 2013-14 % Growth Current Ratio 2.39 2.05 16.59 Quick Ratio 1.61 1.52 5.92 Debt Equity Ratio 0.04 0.06 (33.33) EBITDA Margin (%) 17.84 17.62 1.25 Return on Equity (ROE %) 24.17 26.96 (10.35) Return on Capital Employed (ROCE %) 22.15 24.40 (9.22) Price to Book Ratio (P/B) 8.36 4.93 69.57 Inventory Turnover Ratio 10.07 10.26 (1.85) Asset Turnover Ratio 176.34 160.63 9.78 RATIO ANALYSIS
  • 6.
    EXIDE INDUSTRIES PARTICULARS 2014-152013-14 % Growth Current Ratio 1.96 2.05 (4.39) Quick Ratio 0.97 0.68 42.65 Debt Equity Ratio 0.01 0.00 0 EBITDA Margin (%) 13.66 14.24 (4.70) Return on Equity (ROE %) 13.53 13.13 3.05 Return on Capital Employed (ROCE %) 12.95 12.60 2.78 Price to Book Ratio (P/B) 3.75 2.77 35.38 Inventory Turnover Ratio 4.51 5.03 (10.34) Asset Turnover Ratio 127.23 120.32 5.74 RATIO ANALYSIS
  • 7.
    BHARAT FORGE Particulars 2014-152013-14 % Growth Current Ratio 3.03 1.95 55.38 Quick Ratio 2.54 1.59 59.75 Debt Equity Ratio 0.47 0.54 (12.96) EBITDA Margin (%) 31.29 28.78 8.72 Return on Equity (ROE %) 20.56 14.84 38.54 Return on Capital Employed (ROCE %) 13.65 9.38 45.52 Price to Book Ratio (P/B) 8.50 3.65 132.88 Inventory Turnover Ratio 8.47 6.69 26.61 Asset Turnover Ratio 71.33 59.65 19.58 RATIO ANALYSIS
  • 8.
    FINDINGS & RECOMMENDATIONS ParticularsAmara Raja Batteries Exide Industries Bharat Forge Sales 4,211.33 6,809.18 4211.85 PAT 410.86 622.77 701.06 Current Ratio 2.39 1.96 3.03 Quick Ratio 1.61 0.97 2.54 Debt Equity Ratio 0.04 0.01 0.47 EBITDA 17.84 13.66 31.29 Return on Equity (ROE %) 24.17 13.53 20.56 Return on Capital Employed (ROCE %) 22.15 12.95 13.65 P/B Ratio 8.36 3.75 8.50 Inventory Turnover 10.07 4.51 8.47 Asset Turnover 176.34 127.23 71.33 Stock Recommendation: • Buy Amara Raja Batteries • Hold Exide Industries • Sell Bharat Forge
  • 9.