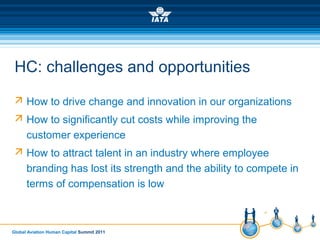
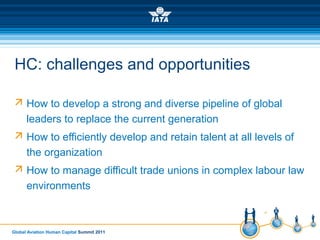
Human Capital opportunitiesHuman Capital opportunities
and challenges in aviationand challenges in aviation
Guido Gianasso
VP, Human Capital, IATA
Global Aviation Human Capital Summit 2011
Why are we here
 To review and discuss challenges and opportunities for the
HR leaders in the air transport industry
 To share best practices and learn from each other
 To identify areas of future cooperation
 To identify how IATA can better support the air transport
industry in the human capital area
Global Aviation Human Capital Summit 2011
IATA – who we are
HC team
Providing HC support to
1500 IATA employees in
65 countries around the
world
ITDI
Providing combined
training solutions for the
commercial air transport
industry:
30.000 students and
participants every year
Global Aviation Human Capital Summit 2011
Who is here
 500 HR leaders in the air transport industry were invited:
 IATA member airlines / Non-IATA member airlines
 Airports
 Air Navigation Service Providers
 Civil Aviation Authorities
 International organizations and regional air transport trade
associations
 170 participants in Singapore
Global Aviation Human Capital Summit 2011
Who is here – some statistics
Global Aviation Human Capital Summit 2011
Who is here – some statistics
Global Aviation Human Capital Summit 2011
Our sponsors
Global Aviation Human Capital Summit 2011
Our partners
Supported by Held in
To represent, lead and serve the airline industry
Updated outlook for theUpdated outlook for the
global airline industryglobal airline industry
Cash flows are being squeezed
-5%
0%
5%
10%
15%
20%
2005 2006 2007 2008 2009 2010 2011
%revenues
EBITDA as % revenues
seasonally adjusted
US
airlines
Asia-Pacific
airlines
European
airlines
550
600
650
700
750
800
850
900
40
60
80
100
120
140
160
180
2007 2008 2009 2010 2011
Averageinternationalreturnfare,US$
Jetkerosenprices,US$perbarrel
Fuel prices and average fares
Jet kerosene price
(left scale)
Average return fare
(right scale)
Mainly by the rise in fuel costs
Fleet changes adding seats at 8%
annualized rate
-0.4%
-0.2%
0.0%
0.2%
0.4%
0.6%
0.8%
1.0%
-200
-150
-100
-50
0
50
100
150
%changeinairlineseats
Changeinoperatingfleet(a/cpermonth)
Airline fleet development
Source: Ascend
Deliveries Other factors Storage activity % change in seats m-o-m
Travel has held up but outlook is weaker
-15%
-10%
-5%
0%
5%
10%
15%
30
35
40
45
50
55
60
65
2006 2007 2008 2009 2010 2011
%changeoveryear
Indexofbusinessconfidence
Worldwide growth in air travel and business confidence
Growth in RPKs
(right scale)
Business
confidence
(left scale)
Freight markets have stopped growing
11
12
13
14
15
16
17
115
125
135
145
155
165
175
2007 2008 2009 2010 2011
AirfreightFTKs,billionspermonth
Worldtradevolume,2000=100
Air freight volumes and world trade
World trade
(left scale)
Air freight volumes
(right scale)
Global growth slowing towards critical level
-3%
-2%
-1%
0%
1%
2%
3%
4%
5%
6%
7%
-6%
-5%
-4%
-3%
-2%
-1%
1%
2%
3%
4%
5%
6%
1970 1975 1980 1985 1990 1995 2000 2005 2010
WorldGDPgrowth
Netpost-taxprofitsas%revenues
World economic growth and airline profit margins
Net post-
tax profit
margin
World
economic
growth
Financial markets expect defaults in Europe
0
2
4
6
8
10
12
14
16
18
Jan-2007 Jan-2008 Jan-2009 Jan-2010 Jan-2011
Government bond yields in Europe
Greece
Ireland
Portugal
Spain
Italy
France
UK
Germany
Will reinforce medium-term geographical
shifts – driven by growth of middle incomes
Global middle class in 2009 and prediction for 2030
And the potential to better connect large
cities, particularly in ASPAC and LATAM
Source: UN, SRS Analyser
5-10 mln
10-15 mln
15-20 mln
> 20 mln
Urban Popn. 2015
Short-term will add to growth disparities
-1
0
1
2
3
4
5
6
7
8
9
Euro area US Japan Latin America MENA Asia ex Japan
EIU's forecasts for GDP growth
2010
2011
2012
20
40
60
80
100
120
140
2007 2008 2009 2010 2011 2012
Brent crude oil price and forecasts, US$/b
Futures
19 Sep
Highest
Bloomberg
forecast
Lowest
Bloomberg
forecast
Fuel costs expected to stay relatively high
In this environment we expect profits to be
positive but not strong
-30
-25
-20
-15
-10
-5
0
5
10
15
20
-9.0
-6.0
-3.0
0.0
3.0
6.0
1996
1997
1998
1999
2000
2001
2002
2003
2004
2005
2006
2007
2008
2009
2010
2011F
2012F
US$billion
%revenues
Global commercial airline profitability
Net post-tax losses
(right scale)
EBIT margin
(left scale)
Global Aviation Human Capital Summit 2011
HC: challenges and opportunities
 How to drive change and innovation in our organizations
 How to significantly cut costs while improving the
customer experience
 How to attract talent in an industry where employee
branding has lost its strength and the ability to compete in
terms of compensation is low
Global Aviation Human Capital Summit 2011
HC: challenges and opportunities
 How to develop a strong and diverse pipeline of global
leaders to replace the current generation
 How to efficiently develop and retain talent at all levels of
the organization
 How to manage difficult trade unions in complex labour law
environments
Global Aviation Human Capital Summit 2011
HC: challenges and opportunities
 In order to better understand your view, we have
conducted a survey with Egon Zehnder International
Global Aviation Human Capital Summit 2011
We look forward to…
 Network
 Learn from each other
 Have some fun together
Global Aviation Human Capital Summit 2011
Thank you!Thank you!
Human Capital Opportunities and Challenges in Aviation

Human Capital Opportunities and Challenges in Aviation

  • 2.
    Human Capital opportunitiesHumanCapital opportunities and challenges in aviationand challenges in aviation Guido Gianasso VP, Human Capital, IATA
  • 3.
    Global Aviation HumanCapital Summit 2011 Why are we here  To review and discuss challenges and opportunities for the HR leaders in the air transport industry  To share best practices and learn from each other  To identify areas of future cooperation  To identify how IATA can better support the air transport industry in the human capital area
  • 4.
    Global Aviation HumanCapital Summit 2011 IATA – who we are HC team Providing HC support to 1500 IATA employees in 65 countries around the world ITDI Providing combined training solutions for the commercial air transport industry: 30.000 students and participants every year
  • 5.
    Global Aviation HumanCapital Summit 2011 Who is here  500 HR leaders in the air transport industry were invited:  IATA member airlines / Non-IATA member airlines  Airports  Air Navigation Service Providers  Civil Aviation Authorities  International organizations and regional air transport trade associations  170 participants in Singapore
  • 6.
    Global Aviation HumanCapital Summit 2011 Who is here – some statistics
  • 7.
    Global Aviation HumanCapital Summit 2011 Who is here – some statistics
  • 8.
    Global Aviation HumanCapital Summit 2011 Our sponsors
  • 9.
    Global Aviation HumanCapital Summit 2011 Our partners Supported by Held in
  • 10.
    To represent, leadand serve the airline industry Updated outlook for theUpdated outlook for the global airline industryglobal airline industry
  • 11.
    Cash flows arebeing squeezed -5% 0% 5% 10% 15% 20% 2005 2006 2007 2008 2009 2010 2011 %revenues EBITDA as % revenues seasonally adjusted US airlines Asia-Pacific airlines European airlines
  • 12.
    550 600 650 700 750 800 850 900 40 60 80 100 120 140 160 180 2007 2008 20092010 2011 Averageinternationalreturnfare,US$ Jetkerosenprices,US$perbarrel Fuel prices and average fares Jet kerosene price (left scale) Average return fare (right scale) Mainly by the rise in fuel costs
  • 13.
    Fleet changes addingseats at 8% annualized rate -0.4% -0.2% 0.0% 0.2% 0.4% 0.6% 0.8% 1.0% -200 -150 -100 -50 0 50 100 150 %changeinairlineseats Changeinoperatingfleet(a/cpermonth) Airline fleet development Source: Ascend Deliveries Other factors Storage activity % change in seats m-o-m
  • 14.
    Travel has heldup but outlook is weaker -15% -10% -5% 0% 5% 10% 15% 30 35 40 45 50 55 60 65 2006 2007 2008 2009 2010 2011 %changeoveryear Indexofbusinessconfidence Worldwide growth in air travel and business confidence Growth in RPKs (right scale) Business confidence (left scale)
  • 15.
    Freight markets havestopped growing 11 12 13 14 15 16 17 115 125 135 145 155 165 175 2007 2008 2009 2010 2011 AirfreightFTKs,billionspermonth Worldtradevolume,2000=100 Air freight volumes and world trade World trade (left scale) Air freight volumes (right scale)
  • 16.
    Global growth slowingtowards critical level -3% -2% -1% 0% 1% 2% 3% 4% 5% 6% 7% -6% -5% -4% -3% -2% -1% 1% 2% 3% 4% 5% 6% 1970 1975 1980 1985 1990 1995 2000 2005 2010 WorldGDPgrowth Netpost-taxprofitsas%revenues World economic growth and airline profit margins Net post- tax profit margin World economic growth
  • 17.
    Financial markets expectdefaults in Europe 0 2 4 6 8 10 12 14 16 18 Jan-2007 Jan-2008 Jan-2009 Jan-2010 Jan-2011 Government bond yields in Europe Greece Ireland Portugal Spain Italy France UK Germany
  • 18.
    Will reinforce medium-termgeographical shifts – driven by growth of middle incomes Global middle class in 2009 and prediction for 2030
  • 19.
    And the potentialto better connect large cities, particularly in ASPAC and LATAM Source: UN, SRS Analyser 5-10 mln 10-15 mln 15-20 mln > 20 mln Urban Popn. 2015
  • 20.
    Short-term will addto growth disparities -1 0 1 2 3 4 5 6 7 8 9 Euro area US Japan Latin America MENA Asia ex Japan EIU's forecasts for GDP growth 2010 2011 2012
  • 21.
    20 40 60 80 100 120 140 2007 2008 20092010 2011 2012 Brent crude oil price and forecasts, US$/b Futures 19 Sep Highest Bloomberg forecast Lowest Bloomberg forecast Fuel costs expected to stay relatively high
  • 22.
    In this environmentwe expect profits to be positive but not strong -30 -25 -20 -15 -10 -5 0 5 10 15 20 -9.0 -6.0 -3.0 0.0 3.0 6.0 1996 1997 1998 1999 2000 2001 2002 2003 2004 2005 2006 2007 2008 2009 2010 2011F 2012F US$billion %revenues Global commercial airline profitability Net post-tax losses (right scale) EBIT margin (left scale)
  • 23.
    Global Aviation HumanCapital Summit 2011 HC: challenges and opportunities  How to drive change and innovation in our organizations  How to significantly cut costs while improving the customer experience  How to attract talent in an industry where employee branding has lost its strength and the ability to compete in terms of compensation is low
  • 24.
    Global Aviation HumanCapital Summit 2011 HC: challenges and opportunities  How to develop a strong and diverse pipeline of global leaders to replace the current generation  How to efficiently develop and retain talent at all levels of the organization  How to manage difficult trade unions in complex labour law environments
  • 25.
    Global Aviation HumanCapital Summit 2011 HC: challenges and opportunities  In order to better understand your view, we have conducted a survey with Egon Zehnder International
  • 26.
    Global Aviation HumanCapital Summit 2011 We look forward to…  Network  Learn from each other  Have some fun together
  • 27.
    Global Aviation HumanCapital Summit 2011 Thank you!Thank you!

Editor's Notes

  • #3 WELCOME: Why are we here Who we are Thanks to our sponsors The air transport industry challenges and trends Challenges and opportunities for the HR function The Global Aviation HC Summit Agenda
  • #20 And air travel flows are primarily between large cities Shift in traffic flows to East & South will be accelerated by situation in Europe Bulk of today’s capacity serves N America and Europe (with 2-3 available seats a year per head of population) But by 2015 (just 5 years) 15 mega-cities in S/SE/E Asia (with capacity only 0.1-0.3 seats per head) Coupled with middle class expansion clearly tremendous potential for air travel growth Likely majority between these cities in the A-P region