Running head Final Project Data Analysis1Final Project Data A.docx
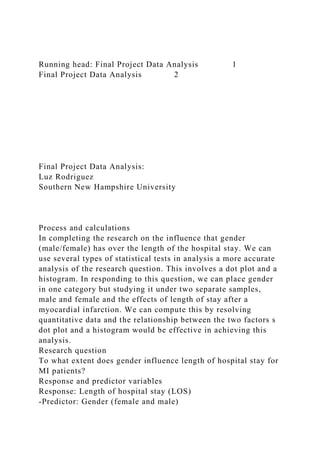
Running head: Final Project Data Analysis 1 Final Project Data Analysis 2 Final Project Data Analysis: Luz Rodriguez Southern New Hampshire University Process and calculations In completing the research on the influence that gender (male/female) has over the length of the hospital stay. We can use several types of statistical tests in analysis a more accurate analysis of the research question. This involves a dot plot and a histogram. In responding to this question, we can place gender in one category but studying it under two separate samples, male and female and the effects of length of stay after a myocardial infarction. We can compute this by resolving quantitative data and the relationship between the two factors s dot plot and a histogram would be effective in achieving this analysis. Research question To what extent does gender influence length of hospital stay for MI patients? Response and predictor variables Response: Length of hospital stay (LOS) -Predictor: Gender (female and male) Type of variable for predictor variable Predictor: gender (female or male) Type of diagram for analysis Dot plot Histogram Data analysis As shown the data tries to compare the differences between gender (male and Female) and the length of stay in hospitals with respect to each other. It’s clear that the length of hospital stay which is represented by 0 is shorter as compared to that of the female which is represented by 1. If there is a larger differences between the two genders, then there is a meaning which would reduce the standard deviation (Gerstman, 2015). gender n mean variance Std. dev Std. err. median range min max Q1 Q3 0 65 0 0 0 0 0 0 0 0 0 0 1 35 1 0 0 0 1 0 1 1 1 1 Hypothesis test results: Difference Sample Diff. Std. Err. DF T-Stat P-value μ1 - μ2 6.49 0.59375453 198 10.930443 <0.0001 References Gerstman, B. B. (2015). Basic Biostatistics Statistics for Public Health (2nd ed.). Burlington, MA: Jones & Bartlett Learning. gender 1 0.0 10.0 20.0 30.0 40.0 50.0 60.0 30.0 4.0 0.0 0.0 0.0 0.0 1.0 gender 0 2.0 17.0 34.0 3.0 6.0 1.0 3.0 gender 1 30.0 4.0 0.0 0.0 0.0 0.0 1.0 gender 0 0.0 2.5 5.0 7.5 10.0 12.5 15.0 2.0 17.0 34.0 3.0 6.0 1.0 3.0 Course ProjectCriteriaPointsDescribes the patient that is the subject of the project including diagnoses, medications, and history OR describes the community, its strengths and problems and the mental health issue that will be the subject of the paper.4Includes any substance abuse or violence issues for the patient or community 2Discusses attempted interventions, what has been successful and what has not.4Describes own personal thoughts about the patient's or community's mental health issues. 4Describes any cognitive concerns and possible interventions.2Writes a nursing care plan including three priority nursing diagnoses with r/t and AEB factors.4Includes outcomes in Nursing Outcomes Classification language and interventions in Nursing Intervention Classificati.

Recommended
Recommended
More Related Content
Similar to Running head Final Project Data Analysis1Final Project Data A.docx
Similar to Running head Final Project Data Analysis1Final Project Data A.docx (20)
More from wlynn1
More from wlynn1 (20)
Recently uploaded
Recently uploaded (20)
Running head Final Project Data Analysis1Final Project Data A.docx
- 1. Running head: Final Project Data Analysis 1 Final Project Data Analysis 2 Final Project Data Analysis: Luz Rodriguez Southern New Hampshire University Process and calculations In completing the research on the influence that gender (male/female) has over the length of the hospital stay. We can use several types of statistical tests in analysis a more accurate analysis of the research question. This involves a dot plot and a histogram. In responding to this question, we can place gender in one category but studying it under two separate samples, male and female and the effects of length of stay after a myocardial infarction. We can compute this by resolving quantitative data and the relationship between the two factors s dot plot and a histogram would be effective in achieving this analysis. Research question To what extent does gender influence length of hospital stay for MI patients? Response and predictor variables Response: Length of hospital stay (LOS) -Predictor: Gender (female and male)
- 2. Type of variable for predictor variable Predictor: gender (female or male) Type of diagram for analysis Dot plot Histogram Data analysis As shown the data tries to compare the differences between gender (male and Female) and the length of stay in hospitals with respect to each other. It’s clear that the length of hospital stay which is represented by 0 is shorter as compared to that of the female which is represented by 1. If there is a larger differences between the two genders, then there is a meaning which would reduce the standard deviation (Gerstman, 2015). gender n mean variance Std. dev Std. err. median range min max Q1 Q3 0 65 0 0 0 0
- 3. 0 0 0 0 0 0 1 35 1 0 0 0 1 0 1 1 1 1 Hypothesis test results: Difference Sample Diff. Std. Err. DF T-Stat P-value μ1 - μ2 6.49 0.59375453 198 10.930443 <0.0001
- 4. References Gerstman, B. B. (2015). Basic Biostatistics Statistics for Public Health (2nd ed.). Burlington, MA: Jones & Bartlett Learning. gender 1 0.0 10.0 20.0 30.0 40.0 50.0 60.0 30.0 4.0 0.0 0.0 0.0 0.0 1.0 gender 0 2.0 17.0 34.0 3.0 6.0 1.0 3.0 gender 1 30.0 4.0 0.0 0.0 0.0 0.0 1.0 gender 0 0.0 2.5 5.0 7.5 10.0 12.5 15.0 2.0 17.0 34.0 3.0 6.0 1.0 3.0 Course ProjectCriteriaPointsDescribes the patient that is the subject of the project including diagnoses, medications, and history OR describes the community, its strengths and problems and the mental health issue that will be the subject of the paper.4Includes any substance abuse or violence issues for the patient or community 2Discusses attempted interventions, what has been successful and what has not.4Describes own personal thoughts about the patient's or community's mental health
- 5. issues. 4Describes any cognitive concerns and possible interventions.2Writes a nursing care plan including three priority nursing diagnoses with r/t and AEB factors.4Includes outcomes in Nursing Outcomes Classification language and interventions in Nursing Intervention Classification language with a plan for evaluation.4Identifies mental health resources that can be used with the patient or community. Includes an educational tool.4Supports answers using academic resources, with citations in APA format.2Total30 1 IHP 525 Milestone Three Table For this milestone, in order to explore your health question you are investigating, you need to plan what descriptive statistics and statistical test you will need to run, as well as what graph you will need to create. Step 1: Complete the table below in which you will propose the calculations and graph(s) you will need to perform to answer the health question you are investigating. Question: Answer: What is your health (research) question? To what extent does gender influence length of hospital stay for MI patients? What is the corresponding null and alternative hypotheses? Null hypothesis: gender does not influence the length of hospital stay for MI patients.
- 6. Alternative hypothesis: gender does influence the length of hospital stay for MI patients List the descriptive statistics you will compute, using which variable(s), to help answer your health question. Variables are male and female which would be used in determining variance. The graph would depict instance of the MI with respect to both male and female What is the name of the statistical test that you will use to test your hypothesis and answer your health question? Summary stats chart Dot-plot What is the formula for your chosen statistical test? The summary is used as there is no specified formulae that is used Why is the statistical test you chose appropriate to answer your health question? Be sure to be clear on how the two variables you described in Milestone Two are used to complete this test. The two variables male and female are used in figuring the relationship between the length of hospital stays and gender for the different genders. As much as this does not take into account statistical calculations, this calculations can also be used in the final conclusion. The used test tries to figure out both the variance and summary. The summary and graph used show age length of hospital stay depending on the gender. Which graph(s) (histogram, stem and leaf, boxplot, bar graph, scatterplot) will you use to visualize the answer to your health question? Be specific and include which variables will be used and if the graph will be created for different subgroups of subjects. A dot-plot was used in showing a visual reference. A bar graph would also be created to support this information gender would be on the x axis as the dots increases from left to right on the males summary and this statistics varies further when it comes to the women summary. Step 2: Provide a 1-2 paragraph explanation below as to why
- 7. you chose the calculations outlined in the table above to explore your health question. Describe what statistics you will compute in order to answer your chosen health (research) question. Be sure to discuss any graphs that you will compute and what information they will provide to help you answer your health question. In examining the health question and the data that is being computed, it’s evident that this question puts more emphasis on the progressive relationship other than the calculation. To my view I decided that I would determine the instances of MI with relation to the different gender and the length of hospital stays. The health question does not give the relation to each other but rather giving the relationship between gender and the length of hospital patients with MI. with this information, you may determine the statistical calculations which may help in interpreting the instances of MI as per the different gender with their respective percentages. This would be more helpful in supporting the visual graphs which may not have been availed. In disapproving the null hypothesis, the statistics was taken computing the different gender (male and female) (Sadhukhan et al. 2019). This statistical data proved that gender is a variable when it comes to the hospital patient’s diagnosed with MI. the dot plot on the other hand showed increased dots among the female. References Sadhukhan, D., Dhar, S., Pal, S., & Mitra, M. (2019). Automated Screening of Myocardial Infarction based on Statistical Analysis of Photoplethysmographic data. IEEE Transactions on Instrumentation and Measurement. Running head: FINAL PROJECT PART II 1 FINAL PROJECT PART II 7
- 8. Final project part II: Luz Rodriguez Southern New Hampshire The statistics shows that over one third of American adults (36%) are obese and more than two thirds (69%) of the remaining population is overweight. The paper tries to relate the relationship between the hospital stay of the patients as associated with the different BMI of the different patients. This tries to depict the time duration that is associated with the hospital stays among the patients. The BMI has a direct impact to the length of hospital stay. Taking the WHAS100 data into consideration, the statistics shows the different factors, which are associated with the different trends and the survival rates with respect to the hospital admission for the acute myocardial infarction. This data was taken from all patients that were admitted for MI in the hospital for the time duration stated (Gerstman et al., 2015). The collected data was put under a longitudinal model with 9 different variables within 100 different observations. The variables that were put under observation are those that lies between the focus in LOS and the BMI. BMI is the body mass index which be calculated by taking observing the measure and dividing the weights in kilograms and dividing it by the respective heights in meters squared. A longitudinal model was used in generalizing the estimates of the equations and also was used in bringing the analysis and relationship between the BMI and the hospital stay (Hosmer et al. 2016).
- 9. Summary statistics for los: Group by: bmi BMI n Mean Variance Std. dev. Std. err. Median Range min Max Q1 Q3 10- 15 1 8 8 0 8 8 8 8 15- 20 6 8 14 3.7416574 1.5275252 7.5 11 3 14
- 11. 4 7 35 to 40 6 4.6666667 3.8666667 1.9663842 0.80277297 4 5 3 8 3 6 On the other hand, the t-test showed two sample T hypothesis test: Hypothesis test results: Difference Sample Diff. Std. Err. DF T-Stat P-value μ1 - μ2 6.49 0.59375453 198 10.930443 <0.0001 The histogram helps in identifying the gender and the length of stay at the institution. This shows the difference in the groups taking the length of stay and gender as the variables. This shows that women have longer stays in the hospitals. From this
- 12. analysis, its that the number of women overstaying in the hospitals is more than the number of men who over stay in the hospital (Akinyemiju, 2016, July 18). References Gerstman, Burt B. (2015). Basic Biostatistics Statistics for Public Health Practice. Jones & Bartlett Learning. Burlington, MA. Hosmer, D. W., Lemeshow, S., & May, S. (2016). Applied survival analysis: Regression modeling of time to event data (2nd ed.). New York, NY: John Wiley and Sons Inc. Akinyemiju, T.-R. N. (2016, July 18). Association between body mass index and in-hospital outcomes. Medicine. Baltimore, Md.: Wolters Kluwer. IHP 525 Milestone Two Table Information on data set Which variables are you investigating? Length of hospital stay based on gender What is the type of each variable?
- 13. Length of stay is quantitative Gender is category List the descriptive stats you will run on the data. Distribution, Mean, Medium, Mode, Minimum, Maximum, & Standard Deviation What does each calculation tell you about the data? Distribution describes the shape / how the data trends when graphed Mean = the average Mode = the value that appears the most Median = The midpoint of the data Minimum = The lowest value observed Maximum = The highest value observed Standard Deviation = the amount of variation present among the data values A. Assess the collected data. Use this section to layout the source, parameters, and any limitations of your data. Specifically, you should: 1. Describe the key features of your data set. Be sure to assess how these features affect your analysis. Summary statistics for los (Length of stay): Group by: gender gender n Mean Median Mode Min Max Std. dev. 0 = Male 65 6.3
- 14. 5 5 1 17 3.3406011 1 = Female 35 7.8 6 4 3 56 8.9172668 This data set helps in analyzing the observation related from the length of stay in the hospitals and among this patients, the data set shows that 65 are male and the remaining are female. Analyzing the male, their shortest time period was a single day while their longest duration way 17 days. However on the other hand, females took a shorter period of 3 days while the longest time period was 56 days. This shows that females take a longer stay as compared to men with MI. Analyzing the other parameters, the mean, mode and the median of both male and female that stays in the hospitals and the analysis is as shown in the table above. This would probably give a skewed graph to the right since the mean>median. The standard deviation also shows that the length of stay are closer to the expected average while the case is not the same for the females as in this case it spread out and contains outliers (Lisitsyna et al., 2019). 2. Analyze the limitations of the data set you were provided and how those limitations might affect your findings. Justify your response. In this case, there are several limitation and this also affects the results differently, this include the fact that the sample size is small, there is no stated reasons why females take longer stays.
- 15. For this case it’s likely to skew the data. Taking a large sample size may bring up the idea and reasons behind longer stays and if age is a factor in this case. This also does not give a clear picture since the sample size of the male and the female was not the same and the fact that some information regarding the patients is not disclosed which makes it impossible to know if there is any other reason associated with the longer stay and or if environmental condition in the hospital is a factor. All this limitations are likely to impact the results as maybe gender maybe one of the factors that needs to be considered when analyzing hospital stays of MI patients (Sall et al., 2017). References Lisitsyna, L. S., & Oreshin, S. A. (2019). Sampling and Analyzing Statistical Data to Predict the Performance of MOOC. In Smart Education and e-Learning 2019 (pp. 77-85). Springer, Singapore. Sall, J., Stephens, M. L., Lehman, A., & Loring, S. (2017). JMP start statistics: a guide to statistics and data analysis using JMP. Sas Institute. los 0.0 5.0 10.0 2.0 17.0 33.0 3.0 6.0 1.0 los 0-10 10 to 20 30-40 40-50 50-60 30.0 4.0 0.0 0.0 2.0