Download as PDF, PPTX


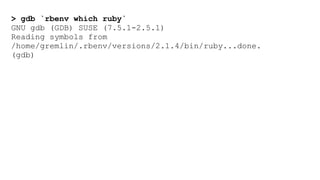
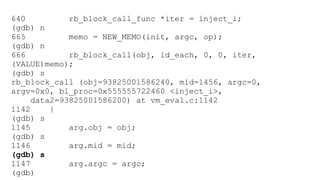
![(gdb) r -e '[1,2,3].inject {}'
Starting program:
/home/gremlin/.rbenv/versions/2.1.4/bin/ruby -e
'[1,2,3].inject {}'
[Thread debugging using libthread_db enabled]
Using host libthread_db library "/lib64/libthread_db.so.1".
[New Thread 0x7ffff7ff2700 (LWP 3893)]
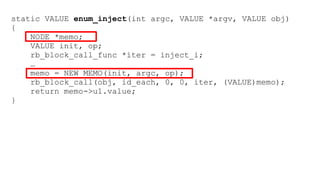
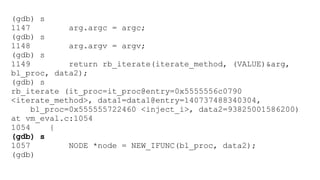
Breakpoint 1, enum_inject (argc=0, argv=<optimized out>,
obj=93825001586240) at enum.c:640
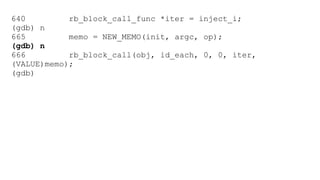
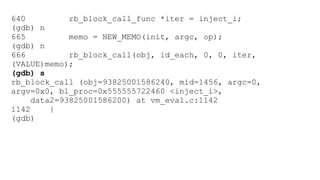
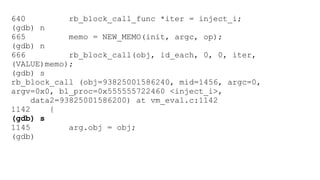
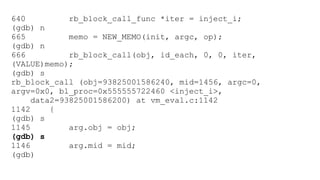
640 rb_block_call_func *iter = inject_i;
(gdb)](https://image.slidesharecdn.com/adymo-rubyconf-performance-141125184600-conversion-gate02/85/Alexander-Dymo-RubyConf-2014-Ruby-Performance-Secrets-and-How-to-Uncover-Them-29-320.jpg)
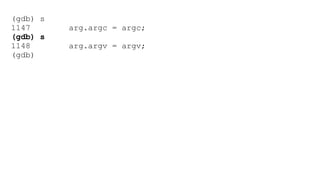
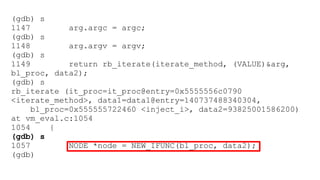
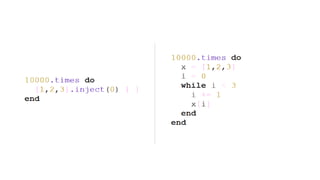
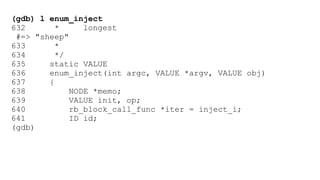
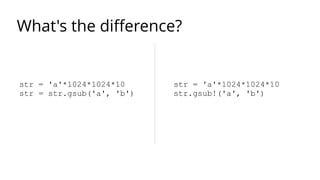
![10000.times { [].inject }
20000 extra T_NODE objects
some work for GC](https://image.slidesharecdn.com/adymo-rubyconf-performance-141125184600-conversion-gate02/85/Alexander-Dymo-RubyConf-2014-Ruby-Performance-Secrets-and-How-to-Uncover-Them-44-320.jpg)
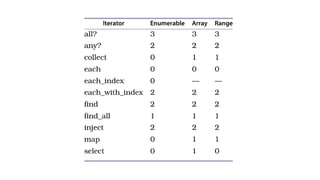
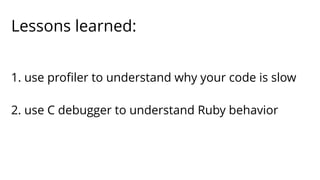

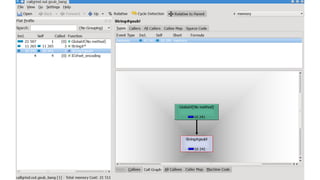


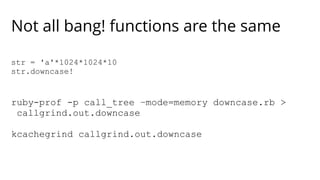
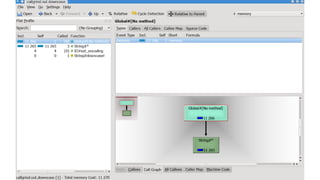
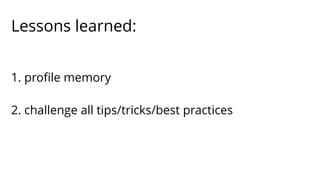


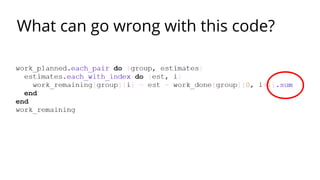
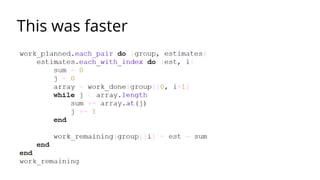
The document discusses Ruby performance optimization techniques. It provides an example of optimizing an inject method call by eliminating unnecessary object allocations. It also analyzes the memory usage of gsub and gsub! string methods through profiling. The key lessons are to use profilers to understand performance bottlenecks, challenge assumptions, and look at Ruby source code and use a debugger when needed to fully understand behavior.