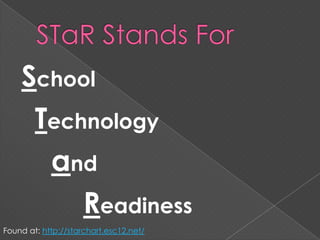
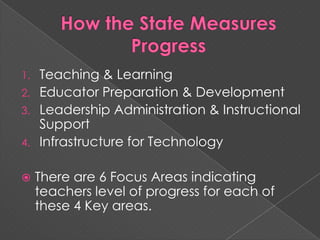
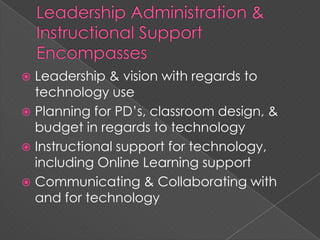
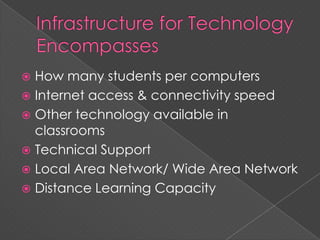
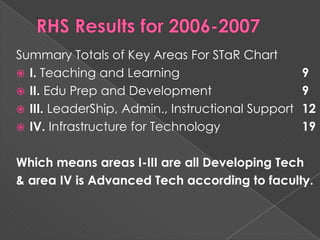
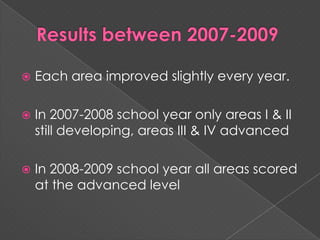
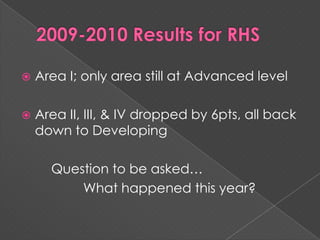
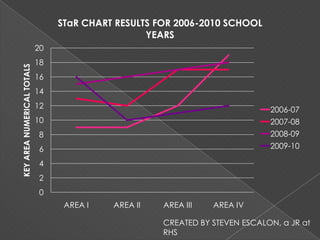
STaR CHARTWhat is it? How do we rate ourselves as a campus?Created and Presented by Lisa Zdancewicz
STaR ChartHave you ever wondered…	What’s with the acronym of STaR?	What does it actually measure?	Who uses the report, and for what?	How does the State come up with its 		ratings?
Presentation AgendaSTaR Chart ExplainedRHS Campus Findings & ResultsStudent Interpretations Sums It All Up
STaR Stands ForSchoolTechnologyandReadinessFound at: http://starchart.esc12.net/
Who uses the data?TeachersPrincipalsCurriculum & Technology SpecialistsSuperintendentsSchool Boards
What & Why should we use the STaR chart?Click on me, and I’ll show you the answers.
It Helps Us, Teachers, With…Assessing the 4 key areas of the Texas Long Range Plan for TechnologyTo plan our own professional developmentTo integrate technology into our curricula
Why does Administration use the data?To aide in staff development planningTo know technology needs of campusAND MUCH MORE…
Administrator’s Overall Questions Answered1)  What are your campus’ and district’s current educational technology profiles?2) What evidence can be provided to demonstrate their progress is meeting the goals of the Long Range Plan for Technology?3)  What areas should your campus and district focus on to improve the level of technology integration to ensure the best possible teaching and learning for all students?Found at: http://starchart.esc12.net/docs/TxCSC.pdf pg 2
Other UsesTo create and/or update the district’s technology plan.To help conceptualize your campus or district vision of technology.To set benchmarks and goals; identifying current edu. technology profiles, establish goals, & monitor progress.Found at: http://starchart.esc12.net/docs/TxCSC.pdf pg 2
Other UsesTo measure student & teacher proficiencies with regard to the integration of technology into all content areas.To document progress toward meeting No Child Left Behind, Title II, Part D requirements… Found at: http://starchart.esc12.net/docs/TxCSC.pdf pg 2
Other UsesTo help schools identify their educational technology needs as they apply for grants.To determine funding priorities & allocations.To track progress on use of No Child Left Behind Title II, Part D formula & discretionary funds.Found at: http://starchart.esc12.net/docs/TxCSC.pdf pg 2
How the State Measures ProgressTeaching & LearningEducator Preparation & DevelopmentLeadership Administration & Instructional SupportInfrastructure for TechnologyThere are 6 Focus Areas indicating teachers level of progress for each of these 4 Key areas.
Teaching & Learning EncompassesTeachers or Students patterns & mastery of technology used in the classroomFrequency of technology use in classroomDesign of Instructional setting w/regards to technologyConnections made within Content Area & technologyOnline Learning within classroom/instruction
Educator Prep & Development EncompassesProfessional Development (PD) experiences centered & modeled on & for technologyCapabilities of Educators regarding technologyAccess to PD’s for integrating technology, including Online LearningVarious levels of educators understandings of & patterns of use with technology
Leadership Administration & Instructional Support EncompassesLeadership & vision with regards to technology usePlanning for PD’s, classroom design, & budget in regards to technologyInstructional support for technology, including Online Learning supportCommunicating & Collaborating with and for technology
Infrastructure for Technology EncompassesHow many students per computersInternet access & connectivity speedOther technology available in classroomsTechnical SupportLocal Area Network/ Wide Area NetworkDistance Learning Capacity
RHS Results for 2006-2007Summary Totals of Key Areas For STaR ChartI. Teaching and Learning 				9II. Edu Prep and Development			9III. LeaderShip, Admin., Instructional Support	12IV. Infrastructure for Technology			19Which means areas I-III are all Developing Tech& area IV is Advanced Tech according to faculty.
Results between 2007-2009Each area improved slightly every year.In 2007-2008 school year only areas I & II still developing, areas III & IV advancedIn 2008-2009 school year all areas scored at the advanced level
2009-2010 Results for RHSArea I; only area still at Advanced levelArea II, III, & IV dropped by 6pts, all back down to Developing	Question to be asked…		What happened this year?
CREATED BY STEVEN ESCALON, a JR at RHS
To Sum Up…Until 2009-10, our campus has been making great progress towards meeting our technology goals and requirements.
We find ourselves in a tight spot right now, how do we come out all the better for our students?
We expect our students to work together, now it’s our turn to do the same for our students.
All pictures provided by Shonna McCormick, yearbook teacher for RHS, photos shot by various yearbook staff.Information pertaining to Royal High School was obtained from RHS’s campus STaR Chart reports from years 2006-2010.

Royal High School's STaR Chart Results

  • 1.
    STaR CHARTWhat isit? How do we rate ourselves as a campus?Created and Presented by Lisa Zdancewicz
  • 2.
    STaR ChartHave youever wondered… What’s with the acronym of STaR? What does it actually measure? Who uses the report, and for what? How does the State come up with its ratings?
  • 3.
    Presentation AgendaSTaR ChartExplainedRHS Campus Findings & ResultsStudent Interpretations Sums It All Up
  • 4.
  • 5.
    Who uses thedata?TeachersPrincipalsCurriculum & Technology SpecialistsSuperintendentsSchool Boards
  • 6.
    What & Whyshould we use the STaR chart?Click on me, and I’ll show you the answers.
  • 7.
    It Helps Us,Teachers, With…Assessing the 4 key areas of the Texas Long Range Plan for TechnologyTo plan our own professional developmentTo integrate technology into our curricula
  • 8.
    Why does Administrationuse the data?To aide in staff development planningTo know technology needs of campusAND MUCH MORE…
  • 9.
    Administrator’s Overall QuestionsAnswered1) What are your campus’ and district’s current educational technology profiles?2) What evidence can be provided to demonstrate their progress is meeting the goals of the Long Range Plan for Technology?3) What areas should your campus and district focus on to improve the level of technology integration to ensure the best possible teaching and learning for all students?Found at: http://starchart.esc12.net/docs/TxCSC.pdf pg 2
  • 10.
    Other UsesTo createand/or update the district’s technology plan.To help conceptualize your campus or district vision of technology.To set benchmarks and goals; identifying current edu. technology profiles, establish goals, & monitor progress.Found at: http://starchart.esc12.net/docs/TxCSC.pdf pg 2
  • 11.
    Other UsesTo measurestudent & teacher proficiencies with regard to the integration of technology into all content areas.To document progress toward meeting No Child Left Behind, Title II, Part D requirements… Found at: http://starchart.esc12.net/docs/TxCSC.pdf pg 2
  • 12.
    Other UsesTo helpschools identify their educational technology needs as they apply for grants.To determine funding priorities & allocations.To track progress on use of No Child Left Behind Title II, Part D formula & discretionary funds.Found at: http://starchart.esc12.net/docs/TxCSC.pdf pg 2
  • 13.
    How the StateMeasures ProgressTeaching & LearningEducator Preparation & DevelopmentLeadership Administration & Instructional SupportInfrastructure for TechnologyThere are 6 Focus Areas indicating teachers level of progress for each of these 4 Key areas.
  • 14.
    Teaching & LearningEncompassesTeachers or Students patterns & mastery of technology used in the classroomFrequency of technology use in classroomDesign of Instructional setting w/regards to technologyConnections made within Content Area & technologyOnline Learning within classroom/instruction
  • 15.
    Educator Prep &Development EncompassesProfessional Development (PD) experiences centered & modeled on & for technologyCapabilities of Educators regarding technologyAccess to PD’s for integrating technology, including Online LearningVarious levels of educators understandings of & patterns of use with technology
  • 16.
    Leadership Administration &Instructional Support EncompassesLeadership & vision with regards to technology usePlanning for PD’s, classroom design, & budget in regards to technologyInstructional support for technology, including Online Learning supportCommunicating & Collaborating with and for technology
  • 17.
    Infrastructure for TechnologyEncompassesHow many students per computersInternet access & connectivity speedOther technology available in classroomsTechnical SupportLocal Area Network/ Wide Area NetworkDistance Learning Capacity
  • 18.
    RHS Results for2006-2007Summary Totals of Key Areas For STaR ChartI. Teaching and Learning 9II. Edu Prep and Development 9III. LeaderShip, Admin., Instructional Support 12IV. Infrastructure for Technology 19Which means areas I-III are all Developing Tech& area IV is Advanced Tech according to faculty.
  • 19.
    Results between 2007-2009Eacharea improved slightly every year.In 2007-2008 school year only areas I & II still developing, areas III & IV advancedIn 2008-2009 school year all areas scored at the advanced level
  • 20.
    2009-2010 Results forRHSArea I; only area still at Advanced levelArea II, III, & IV dropped by 6pts, all back down to Developing Question to be asked… What happened this year?
  • 21.
    CREATED BY STEVENESCALON, a JR at RHS
  • 22.
    To Sum Up…Until2009-10, our campus has been making great progress towards meeting our technology goals and requirements.
  • 23.
    We find ourselvesin a tight spot right now, how do we come out all the better for our students?
  • 24.
    We expect ourstudents to work together, now it’s our turn to do the same for our students.
  • 25.
    All pictures providedby Shonna McCormick, yearbook teacher for RHS, photos shot by various yearbook staff.Information pertaining to Royal High School was obtained from RHS’s campus STaR Chart reports from years 2006-2010.