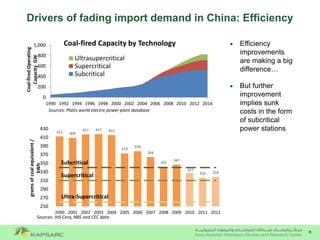
The document discusses challenges facing the coal industry over the medium term, including:
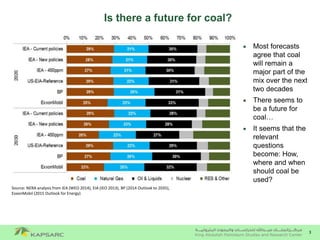
- Global coal demand growth is slowing as China's imports decline due to policy changes and efficiency gains. Other countries may not compensate for China's losses.
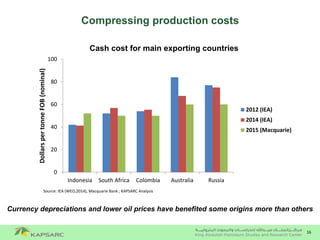
- Supply is decreasing from high-cost producers like Indonesia as low-cost countries like Russia, Australia, and Colombia increase market share.
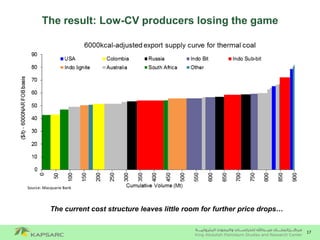
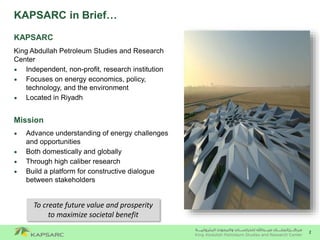
- International thermal coal prices are expected to remain depressed for 3-5 years as the market works to rebalance slower demand and competitive supply. Industry consolidation may be needed for some high-cost producers.


![6
Has the coal market run out of steam?
Coal market recovery not likely before 2017 - Even then, improvement might only be marginal…
Source: McCloskey, Salva, Argus Consulting, KAPSARC Analysis
(40)
(20)
-
20
40
60
80
100
120
140
160
0
200
400
600
800
1000
1200
2009 2010 2011 2012 2013 2014 2015E 2016E 2017E 2018E 2019E
Year-on-YearChange[Mt]/Newcastle
[$/t]
CoalDemand[Mt]
Seaborne Thermal Coal Market Demand
Year-on-Year Change Seaborne Coal Demand Newcastle price](https://image.slidesharecdn.com/3238ca1f-092d-419d-a881-8dfc4a7b2954-150416164506-conversion-gate02/85/Rodrigo-Flame-April-14-FINAL-6-320.jpg)
![7
Can India and ASEAN compensate
for the losses in China?
India and ASEAN show promise but have their own challenges…
Source: McCloskey, Salva, Argus Consulting, KAPSARC Analysis
-60
-50
-40
-30
-20
-10
0
10
20
30
40
2013 2014 2015E 2016E 2017E 2018E 2019E
Year-on-yearchange[Mt]
China
India
ASEAN](https://image.slidesharecdn.com/3238ca1f-092d-419d-a881-8dfc4a7b2954-150416164506-conversion-gate02/85/Rodrigo-Flame-April-14-FINAL-7-320.jpg)
![10
-15
-10
-5
0
5
10
15
2013 2014 2015E 2016E 2017E 2018E 2019E
Year-on-yearchange[Mt]
Taiwan and HK
Japan/S.Korea
Europe
MENA
Americas
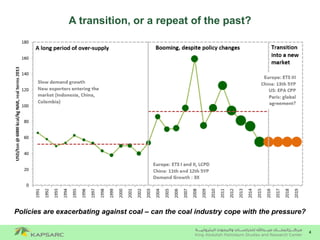
Demand: Japan, Korea, MENA and Europe
Europe making
further attempts to
improve its ETS will
likely result in coal
being displaced in
the merit order
Coal is still a good
alternative for Korea
and Japan due to
shortage of power
and challenges with
other sources of
energy
Egypt and UAE
moving to build new
coal-fired capacity
Source: McCloskey, Salva, Argus Consulting, KAPSARC Analysis](https://image.slidesharecdn.com/3238ca1f-092d-419d-a881-8dfc4a7b2954-150416164506-conversion-gate02/85/Rodrigo-Flame-April-14-FINAL-10-320.jpg)
![12
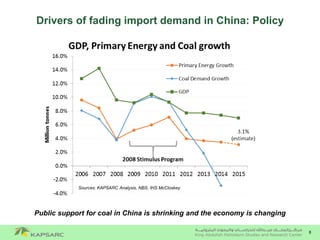
ASEAN: A stronghold for coal?
0
5
10
15
20
25
30
35
40
0
5
10
15
20
25
30
2014 2015 2016 2017 2018 2019
CoalDemand[Mt]
GenerationCapacity[GW] Malaysian fuel mix and coal demand
Coal Gas Hydro Coal demand
Source: Tanaga Nasional Berhad (TNB)
Philippines, Vietnam, Indonesia are also expanding their coal-fired capacity…](https://image.slidesharecdn.com/3238ca1f-092d-419d-a881-8dfc4a7b2954-150416164506-conversion-gate02/85/Rodrigo-Flame-April-14-FINAL-12-320.jpg)

![15
Supply: Who wins and who loses?
Indonesia has probably peaked, and the US is already retreating from the export
market. Colombia, Russia and Australia holding better than the rest.
Source: McCloskey, Salva, Argus Consulting, KAPSARC Analysis
0
50
100
150
200
250
300
0
50
100
150
200
250
300
350
400
450
2009 2010 2011 2012 2013 2014 2015 2016 2017 2018 2019
Other–[Mt]
Indonesia–[Mt]
Indonesia (LHS) Australia Steam (RHS) USA (RHS) Russia (RHS) Colombia (RHS)](https://image.slidesharecdn.com/3238ca1f-092d-419d-a881-8dfc4a7b2954-150416164506-conversion-gate02/85/Rodrigo-Flame-April-14-FINAL-15-320.jpg)