
Recommended
Recommended
More Related Content
Similar to Rivers And Leaves
Similar to Rivers And Leaves (20)
Recently uploaded
Recently uploaded (20)
Rivers And Leaves
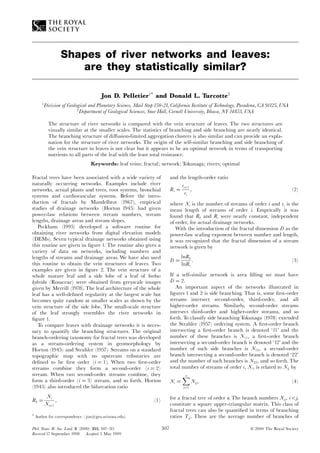
- 1. Shapes of river networks and leaves: are they statistically similar? Jon D. Pelletier1* and Donald L. Turcotte2 1 Division of Geological and Planetary Science, Mail Stop 150-21, California Institute of Technology, Pasadena, CA 91125, USA 2 Department of Geological Sciences, Snee Hall, Cornell University, Ithaca, NY 14853, USA The structure of river networks is compared with the vein structure of leaves. The two structures are visually similar at the smaller scales. The statistics of branching and side branching are nearly identical. The branching structure of di¡usion-limited aggregation clusters is also similar and can provide an expla- nation for the structure of river networks. The origin of the self-similar branching and side branching of the vein structure in leaves is not clear but it appears to be an optimal network in terms of transporting nutrients to all parts of the leaf with the least total resistance. Keywords: leaf veins; fractal; network; Tokunaga; rivers; optimal Fractal trees have been associated with a wide variety of naturally occurring networks. Examples include river networks, actual plants and trees, root systems, bronchial systems and cardiovascular systems. Before the intro- duction of fractals by Mandelbrot (1967), empirical studies of drainage networks (Horton 1945) had given power-law relations between stream numbers, stream lengths, drainage areas and stream slopes. Peckham (1995) developed a software routine for obtaining river networks from digital elevation models (DEMs). Seven typical drainage networks obtained using this routine are given in ¢gure 1. The routine also gives a variety of data on networks, including numbers and lengths of streams and drainage areas. We have also used this routine to obtain the vein structures of leaves. Two examples are given in ¢gure 2. The vein structure of a whole mature leaf and a side lobe of a leaf of Sorbus hybrida (Rosaceae) were obtained from greyscale images given by Merrill (1978). The leaf architecture of the whole leaf has a well-de¢ned regularity at the largest scale but becomes quite random at smaller scales as shown by the vein structure of the side lobe. The small-scale structure of the leaf strongly resembles the river networks in ¢gure 1. To compare leaves with drainage networks it is neces- sary to quantify the branching structures. The original branch-ordering taxonomy for fractal trees was developed as a stream-ordering system in geomorphology by Horton (1945) and Strahler (1957). Streams on a standard topographic map with no upstream tributaries are de¢ned to be ¢rst order (i ˆ 1). When two ¢rst-order streams combine they form a second-order (i ˆ 2) stream. When two second-order streams combine, they form a third-order (i ˆ 3) stream, and so forth. Horton (1945) also introduced the bifurcation ratio Rb ˆ Ni Ni‡1 , (1) and the length-order ratio Rr ˆ ri‡1 ri , (2) where Ni is the number of streams of order i and ri is the mean length of streams of order i. Emprically it was found that Rb and Rr were nearly constant, independent of order, for actual drainage networks. With the introduction of the fractal dimension D as the power-law scaling exponent between number and length, it was recognized that the fractal dimension of a stream network is given by D ˆ lnRb lnRr . (3) If a self-similar network is area ¢lling we must have D ˆ 2. An important aspect of the networks illustrated in ¢gures 1 and 2 is side branching. That is, some ¢rst-order streams intersect second-order, third-order, and all higher-order streams. Similarly, second-order streams intersect third-order and higher-order streams, and so forth. To classify side branching Tokunaga (1978) extended the Strahler (1957) ordering system. A ¢rst-order branch intersecting a ¢rst-order branch is denoted `11' and the number of these branches is N11, a ¢rst-order branch intersecting a second-order branch is denoted `12' and the number of such side branches is N12, a second-order branch intersecting a second-order branch is denoted `22' and the number of such branches is N22, and so forth. The total number of streams of order i, Ni, is related to Nij by Ni ˆ Xn jˆ1 Nij, (4) for a fractal tree of order n. The branch numbers Nij, i5j, constitute a square upper-triangular matrix. This class of fractal trees can also be quanti¢ed in terms of branching ratios Tij. These are the average number of branches of Phil.Trans. R. Soc. Lond. B (2000) 355, 307^311 307 & 2000 The Royal Society Received 17 September 1998 Accepted 5 May 1999 * Author for correspondence ( jon@geo.arizona.edu).
- 2. order i joining branches of order j. Branching ratios are related to branch numbers by Tij ˆ Nij Nj . (5) Again the branching ratios Tij constitute a square, upper- triangular matrix. We now de¢ne self-similar trees to be the subset of trees for which Ti,i‡k ˆ Tk where Tk is a branching ratio that depends on k but not on i. Tokunaga (1978) introduced a more restricted class of self-similar, side-branching trees by requiring for self-similarity of side branching that Tk ˆ ackÀ1 . (6) This is now a two-parameter family of trees and we will de¢ne fractal trees in this class to be Tokunaga trees. A fourth-order Tokunaga tree is illustrated in ¢gure 3a. The corresponding branch-number and branching-order matrices are given in ¢gure 3b,c. For this construction we have Rr ˆ 2 and N4 ˆ 1, N3 ˆ 3, N2 ˆ 11, and N1 ˆ 43. 308 J. D. Pelletier and D. L.Turcotte Shapes of river networks and leaves Phil.Trans. R. Soc. Lond. B (2000) (a) (d) (e) ( f ) (g) (b) (c) 50 km 50 km 50 km 50 km 50 km 50 km 1000 km Figure 1. Drainage networks analysed: (a) Kumaun; (b) Loess Plateau, Shanxi Province, China; (c) Schoharie Creek, New York; (d ) Nepal; (e) Kentucky River; ( f ) Mississippi River; and (g) Bhutan. (a) (b) Figure 2. Vein structure of a mature leaf in Sorbus L. (Rosaceae) obtained by using a scanning routine on greyscale images given by Merrill (1978): (a) whole leaf; (b) side lobe. 14 24 11 1112 14 44 14 23 1111 12 13 13 34 12 11 11 22 22 12 11 11 14 13 12 11 11 23 13 1211 11 22 12 22 1111 (a) (b) (c) 33 13 33 13 22 11 1112 2212 11 11 11 11 23 12 24 11 1112 N11 = 22 N12 = 11 N13 = 6 T12 = 1 T13 = 2 T14 = 4 T23 = 1 T24 = 2 T34 = 1 N14 = 4 N22 = 6 N23 = 3 N24 = 2 N33 = 2 N34 = 1 N14 = 1 Figure 3. (a) Fourth-order Tokunaga fractal tree. (b) Branch- number matrix. (c) Branching-ratio matrix.
- 3. The bifurcation ratio Rb is not constant but approaches 4 for large i-values. Thus from equation (3), D approaches 2 for large values of i. We also ¢nd that T12 ˆ T23 ˆ T34 ˆ T1 ˆ 1, T13 ˆ T24 ˆ 2 and T14 ˆ 4; so that from equation (6) we have a ˆ 1 and b ˆ 2. We now quantify the branching networks illustrated in ¢gures 1 and 2. Peckham (1995) has determined branching-ratio matrices for the Kentucky River basin in Kentucky and the Powder River basin in Wyoming. Both are eighth-order basins with the Kentucky River basin having an area of 13500 km2 and the Powder River basin an area of 20181km2 . For the Kentucky River basin Rb ˆ 4:6 and Rr ˆ 2:5; for the Powder River basin Rb ˆ 4:7 and Rr ˆ 2:4. From equation (3) the corre- sponding values of the fractal dimension are D ˆ 1:67 and D ˆ 1:77, respectively. Good agreement with the Toku- naga relation (6) was obtained, taking a ˆ 1:2 and c ˆ 2:5. For the river networks illustrated in ¢gure 1 the number-order statistics are given in ¢gure 4a. We ¢nd Rb ˆ 100:67 ˆ 4:68. The length-order statistics are given in ¢gure 5a. We ¢nd Rr ˆ 100:35 ˆ 2:24. Thus from equation (3) we have D ˆ 1:91. The mean values of the branching ratios Tk are given in ¢gure 6a. Quite good agreement with the Tokunaga relation (6) is obtained, taking a ˆ 1:58 and c ˆ 2:44. In addition, we have plotted the relationship between length and area aver- aged for each Strahler order in ¢gure 7a. The results indicate that L G Aq with q nearly equal to one-half. This relationship is known as the Hack law (Hack 1957). For the leaves illustrated in ¢gure 2 the number-order statistics are given in ¢gure 4b; we ¢nd that Rb ˆ 100:65 ˆ 4:47. The length-order statistics are given in ¢gure 5b; we ¢nd that Rr ˆ 100:34 ˆ 2:19. Thus from equation (3) we have D ˆ 1:91. The mean values of the branching ratios Tk are given in ¢gure 6b. Again quite good agreement with the Tokunaga relation (6) is obtained at the smaller scales, taking a ˆ 1:23 and c ˆ 2:34. The same relationship between length and area observed for drainage networks is observed for leaf veins (¢gure 7b). At larger scales (large k) where there is regularity in the side branching, the statistics of side branching deviate from the Tokunaga relation (6). Both in terms of number- length statistics and in terms of side-branching statistics we ¢nd that drainage networks and the vein structure of leaves at the smaller scales are very similar. This con¢rms the visual similarities between ¢gures 1 and 2. An obvious question is, why do drainage networks and leaves develop a Tokunaga branching structure? We ¢rst note the simila- rities with di¡usion-limited aggregation (DLA). Shapes of river networks and leaves J. D. Pelletier and D. L.Turcotte 309 Phil.Trans. R. Soc. Lond. B (2000) 106 104 102 100 1210 –0.67 864 i N N 20 (a) 104 105 103 102 100 10–1 101 10 –0.65 864 i 20 (b) Figure 4. Plot of the average number of branches of order i as a function of order i. (a) Results for the seven drainage basins given in ¢gure 1. The data correlate with N G iÀ0:67 ; thus Rb ˆ 100:67 ˆ 4:68. (b) Results for the two leaf networks given in ¢gure 2. The data correlate with N G iÀ0:65 ; thus Rb ˆ 100:65 ˆ 4:47. 103 104 102 101 10–1 10–2 100 10 12 0.35 864 i L(km) 20 (a) 100 10–1 10–3 10–2 10 0.34 864 i L(cm) 20 (b) Figure 5. Plot of the average branch length of order i as a function of order i. (a) Results for the seven drainage basins given in ¢gure 1. The data correlate with r G iÀ0:35 ; thus Rb ˆ 100:35 ˆ 2:24. (b) Results for the two leaf networks given in ¢gure 2. The data correlate with r G iÀ0:34 ; thus Rb ˆ 100:34 ˆ 2:19.
- 4. The concept of DLA was introduced by Witten & Sander (1981). They considered a grid of points on a two- dimensional lattice and placed a seed particle near the centre of the grid. An accreting particle was randomly introduced on a `launching' circle and was allowed to follow a random path until (i) it accreted to the growing cluster of particles by entering a grid point adjacent to the cluster, or (ii) it wandered across a larger `killing' circle. The resulting sparse, tree-like structure has been taken as an excellent representation of dendritic growth patterns found both in nature and in industrial applications (Vannimenus & Viennot 1989). Ossadnik (1992) has considered the branching statistics of 47 o¡-lattice DLA clusters each with 106 particles. On average, the networks were 11th-order fractal trees. The average bifurcation ratio for the clusters was found to be Rb ˆ 5:15 Æ 0:05 and the average length-order ratio Rr ˆ 2:86 Æ 0:05; from equa- tion (3) the corresponding fractal dimension is D ˆ 1:56. The DLA clusters are much less dense than the drainage networks or leaf vein networks, and thus the fractal dimension for DLA clusters are considerably smaller. In order to analyse the branching statistics of DLA clusters, Ossadnik (1992) used the rami¢cation matrix introduced for DLA by Vannimenus & Viennot (1989). The rami¢cation matrix is entirely equivalent to the branching-ratio matrix introduced by Tokunaga (1978). In terms of the Tokunaga trees de¢ned in equation (6) it is found that a ˆ 1:5 and c ˆ 2:7 for DLA trees. Thus DLA clusters, river networks and leaves all exhibit Tokunaga side-branching statistics. A wide variety of models have been proposed for drain- age networks. These have been reviewed by Rodriguez- Iturbe & Rinaldo (1997) and byTurcotte (1997). Masek & Turcotte (1993) proposed a model for headward migra- tion of drainage networks based on DLA. This model yields Tokunaga statistics which are in good agreement with equation (6). Peckham (1995) has shown that there are large discrepancies between river network statistics and random growth networks such as that proposed by Shreve (1969). Some authors (Rodriguez-Iturbe & Rinaldo 1997) have shown that river networks are optimal networks for trans- porting run-o¡ with the minimum stream power exerted on the landscape. Because the structures of leaves and river basins are statistically similar we can conclude that evolution has found an optimal structure for transporting nutrients to and from cells in the leaf by the trial and error process of mutation and natural selection. 310 J. D. Pelletier and D. L.Turcotte Shapes of river networks and leaves Phil.Trans. R. Soc. Lond. B (2000) 103 104 102 101 10–1 100 9 11 0.38 75 k Tk 31 (a) 103 102 101 10–1 100 0.37 864 k Tk 20 (b) Figure 6. Plot of the Tokunaga branching ratios Tk as a function of k. (a) Results for the seven drainage networks illustrated in ¢gure 1. The data correlate with equation (6), taking a ˆ 1:58 and c ˆ 2:44. (b) Results for the two leaves illustrated in ¢gure 2. The data at lower order correlate with equation (6), taking a ˆ 1:23 and c ˆ 2:34. 102 101 10–1 100 0.47 0.47 0.50 0.50 0.50 0.49 0.46 L(km) 10–2 100 102 104 (a) A (km2 ) 100 10–1 10–3 10–2 0.49 0.52 L(cm) 10–5 10–4 10–2 10–3 10–1 100 (b) A (cm2 ) Figure 7. Plot of the length versus drainage area averaged for each Strahler order i. (a) Results for the seven drainage basins given in ¢gure 1. The data correlate with L G A0:5 . (b) Results for the two leaf networks given in ¢gure 2. The data correlate with L G A0:5 also.
- 5. REFERENCES Fowler, A. D. 1990 Self-organized mineral textures of igneous rocksöthe fractal approach. Earth Sci. Rev. 29, 47^55. Hack, J. T. 1957 Studies of longitudinal pro¢les in Virginia and Maryland. US Geol. Surv. Prof. Pap. 294B. Horton, R. E. 1945 Erosional development of streams and their drainage basins; hydrophysical approach to quantitative geomorphology. Bull. Geol. Soc. Am. 56, 275^370. Mandelbrot, B. B. 1967 How long is the coastline of Britain? Statistical self-similarity and the fractal dimension. Science 156, 636^638. Masek, J. G. & Turcotte, D. L. 1993 A di¡usion-limited aggre- gation model for the evolution of drainage networks. Earth Planet. Sci. Lett. 119, 379^386. Merrill, E. K. 1978 Comparison of mature leaf architecture of three types in Sorbus L. (Rosaceae). Bot. Gaz. 139, 447^453. Ossadnik, P. 1992 Branch order and rami¢cation analysis of large di¡usion-limited aggregation clusters. Phys. Rev. A 45, 1058^1066. Peckham, S. 1995 New results for self-similar trees with applications to river networks.Water Resour. Res. 31, 1023^1029. Rodriguez-Iturbe, I. & Rinaldo, A. 1997 Fractal river basins. New York: Cambridge University Press. Shreve, R. L. 1969 Stream lengths and basin areas in topologi- cally random channel networks. J. Geol. 77, 397^405. Strahler, A. N. 1957 Quantitative analysis of watershed geomor- phology. Am. Geophys. UnionTrans. 38, 913^920. Tokunaga, E. 1978 Consideration on the composition of drainage networks andtheir evolution. Geogr.Rep.TokyoMetro.Univ.13,1^27. Turcotte, D. L. 1997 Fractals and chaos in geology and geophysics. New York: Cambridge University Press. Vannimenus, J. & Viennot, X. G. 1989 Combinatorial tools for the analysis of rami¢ed patterns. J. Statist. Phys. 54, 1529^1538. Witten,T. A. & Sander, L.M.1981Di¡usion-limited aggregation, a kinetic critical phenomenon. Phys. Rev. Lett. 47,1400^1403. Shapes of river networks and leaves J. D. Pelletier and D. L.Turcotte 311 Phil.Trans. R. Soc. Lond. B (2000)