Trees Lose Their Leaves Later in Agroforestry Systems
Chang_198Breport draft_June15
1. Chang Lu
Christine Scoffoni
EEB 198B
June 2th
2015
Global scaling of secondary and tertiary vein density strengthens the leaf development model
and proposed functional benefits
Introduction
The diverse leaf vein features are highly correlated with species’ developmental and
evolutionary basis (Sack and Scoffoni, 2012). Among these traits, vein length per unit area
(VLA, also “vein density”), a highly variable vein trait, has been shown to relate to development
process and numerous leaf functions (Sack and Scoffoni, 2012). Quantifying VLA among
diverse species serves as an important tool to understand the leaf development models and
adaptation to various biomes during evolution. Indeed,, in a previous study, Sack et al. (2012)
proposed the developmentally based model for vein pattern differentiation, using 485 globally
distributed species. To further understand leaf vein diversity, this study explores a different set of
globally distributed species, focusing on the VLA of secondary veins (2° VLA) and tertiary veins
(3° VLA). We hypothesized that both 2˚ and 3˚ VLA show the developmentally based scaling
pattern across species. Also, considering the hydraulic benefits of small leaves with high major
VLA (Scoffoni et al., 2011), we predict that species with small leaf area are more common
compared to those with large leaf area at a global scale.
Methods
All measurements, including 547 species from 59 globally distributed families, were
generated through Image J. To approximate the VLA, I first measured the sampled box area in
2. the middle of the leaf. As Sack et al. (2012) proposed: at the middle third of the leaf, the sampled
rectangle area between midrib and the margin strongly correlates with the whole leaf area. Thus,
the middle boxed area is a valid sample for the intact leaf. Then I measured the lengths of
secondary and tertiary veins within the sampled area. The sampled VLA, calculated by
!"#$%& !"#$ !"#$%& (!!)
!"#$%&' !"#! (!!!)
, can then provide a valid approximation of the 2° and 3° VLA of the intact
leaf.
Results
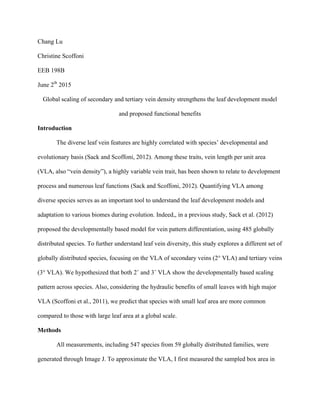
Both 2˚ and 3˚ VLA among 547 species show a negative correlation with leaf sizes;
however, 3˚ VLA (figure1, R=0.283, p<0.05) has a weaker correlation to leaf size than 2˚ VLA
(figure 2, R=0.83, p<0.005). Moreover, among these species, the average 3˚ VLA is 6.3 folds
greater than average 2˚ VLA, indicating that a global trend that 3˚ vein density is higher than 2˚
vein density. No correlation was found between 2˚ VLA and 3˚ VLA (figure 3, R=0.108,
p>0.05). Small leaves are more common than large leaves, as we consider leaf with sampled area
less than 30 mm2
as small: 364 species have small leaves, whereas 183 species have large leaf
size (figure 1 and 2).
y
=
3.2322x-‐0.341
R²
=
0.08122
0
2
4
6
8
10
12
14
16
18
20
0
20
40
60
80
100
120
140
160
180
200
3°
VLA
(mm-‐1)
sampled
leaf
area
(mm2)
3. Figure 1. Correlation between sampled leaf area and 3° VLA. Each dot represents one
species. R= 0.283, p<0.05.
Figure 2. Correlation between sampled leaf area and 2° VLA. Each dot represents one
species. R= 0.83, p<0.005.
Figure 3. Correlation between 2° VLA and 3° VLA. Each dot represents one species.
R=0.108, p>0.05.
y
=
1.3324x-‐0.522
R²
=
0.69666
0
0.5
1
1.5
2
2.5
0
20
40
60
80
100
120
140
160
180
200
2°
VLA
(mm-‐1)
sampled
leaf
area
(mm2)
y
=
1.2626x
+
2.2627
R²
=
0.01171
0
2
4
6
8
10
12
14
16
18
20
0
0.5
1
1.5
2
2.5
3°
VLA
(mm-‐1)
2°
VLA
(mm-‐1)
4. Discussion
The negative correlation between both 2˚ and 3˚ VLA and leaf size (figure 1 and 2) can
be explained by the inherent leaf development process. As leaf expands and veins are spread
apart, each type of VLA decreases (Sack et al., 2012), so smaller leaves should have higher 2˚
and 3˚ VLA than the larger ones. This universal leaf development pattern also explains the
higher 3˚ VLA compared to 2˚ VLA: given the same leaf area, 3˚ veins are pulled apart less than
2˚ veins during leaf expansion, and thus the former has a higher density than the latter.
The independence between 2˚ VLA and 3˚ VLA confirms the leaf expansion theory
during development: 2˚ veins develop during the slow expansion phase whereas 3˚ veins form
next (Sack et al., 2012). Since 2˚ veins and 3˚ veins develop at different stages, it is likely that 2˚
vein growth does not affect 3˚ vein expansion (figure 3) among species distributed across
biomes. Therefore, we are more confident that this developmental constraint is globally
conserved regardless the diversification along evolution.
The greater degree of variance of 3˚ VLA than 2˚ VLA (figure 1 and 2) can also be
explained by leaf development mechanism. Based on Arabidopsis and 27 other dicotyledonous
species, Sack et al. (2012) proposed a model that 2˚ vein density peaks at the slow expansion or
cell division phase, whereas 3˚ vein density peaks at a stage between the cell division and cell
expansion phase. Also, the expansion phase, or rapid phase, allows more freedom for veins to
develop than the division phase does. Then, 3˚ veins, developing later, are more likely to be
modified during leaf growth than 2˚ veins. So far, this model is applicable for globally
5. distributed species, as we see that 3˚ vein density shows a higher level of variance than 2˚ vein
density.
We also notice that small leaves are more common than large leaves (figure 1 and 2).
This result turns out to be a global trend with functional benefits, rather than a biased sampling,
as this commonness also shows up in the study of Sack et al. (2012) with investigation of 485
globally distributed species, as well as in the study of Peppe et al. (2011) of species at 92
globally distributed, climatically diverse sites. Compared to large leaves, small leaves, usually
with high VLA, have lower hydraulic vulnerability and greater drought tolerance (Scoffoni et al.,
2011). These advantages are likely to be selected for in arid habitat, and in our dataset, the
species with extremely high 3˚ VLA and small leaf size (e.g. Castela peninsularis, Choisya
arizonica, Rhamnus californica, Ceanothus integerrimus, and Cercocarpus paucidentatus) are
mostly originated from arid or Mediterranean climate zone. In contrast, species with extremely
low 3˚ VLA and large leaf area (e.g. Populus tremuloides, Populus balsamifera, Quercus
marilandica, and Lithocarpus densiflora) usually originate from moist, temperate zone. In future
study, we can specify the biome for each species to validate that these functional benefits indeed
correlate with species being advantageously selected.
6. Works Cited
Peppe, D. J. et al. “Sensitivity of leaf size and shape to climate: global patterns and paleoclimatic
applications.” New Phytol. 190: 724-739 (2011).
Sack, L. & Scoffoni, C. “Leaf venation: structure, function, development, evolution, ecology,
and applications in the past, present and future.” New Phytol. 198: 983-1000 (2012).
Sack, L. et al. “Developmentally based scaling of leaf venation architecture explains global
ecological patterns.” Nat. Commun. 3:837 doi:10.1038/ncomms1835 (2012).
Scoffoni, C. et al. “Decline of leaf hydraulic conductance with dehydration: relationship to leaf
size and venation architecture.” Plant Physiology. 156: 832-843 (2011).