The document discusses key concepts related to risk and return including:
- Normal distribution and how it relates to standard deviation and z-scores.
- How to calculate the minimum and maximum expected returns over 1, 2, and 3 standard deviations from the mean for a stock with an 8% mean return and 10% standard deviation.
- Formulas for calculating the probability of returns above or below certain levels for a stock with a given mean and standard deviation.
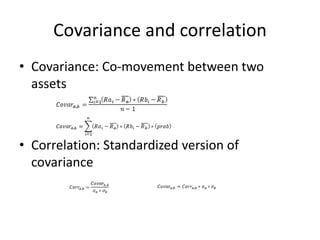
- Definitions of covariance and correlation as ways to measure co-movement between assets.
- Examples of calculating covariance using historical and probabilistic stock price data.
- An introduction to the concept of beta as a measure of systematic risk.


![What is the probability that a stock with mean return of 8% and standard
deviation of 10% would yield a return of 6% or less.
The probability that return is less than 6% [P(x<6)=0.4207]](https://image.slidesharecdn.com/chapter3part21-211025175610/85/risk-and-return-fm-6-320.jpg)
![What is the probability that a stock with mean return of 8% and standard
deviation of 10% would yield a return of 15% or less.
The probability that return is less than 15% [P(x<15)=0.7580]](https://image.slidesharecdn.com/chapter3part21-211025175610/85/risk-and-return-fm-7-320.jpg)
![What is the probability that a stock with mean return of 8% and standard deviation of 10% would
yield a return between 12% and 18%
[P(x<12)=0.6554]
[P(x<18)=0.8413]
[P(12<x<18) = 0.8413 – 0.6554 = 0.1859]](https://image.slidesharecdn.com/chapter3part21-211025175610/85/risk-and-return-fm-8-320.jpg)