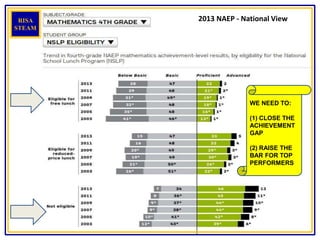
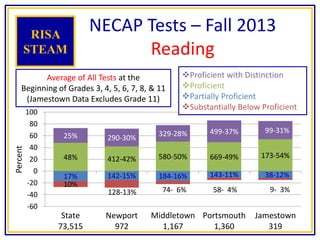
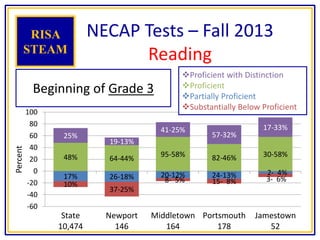
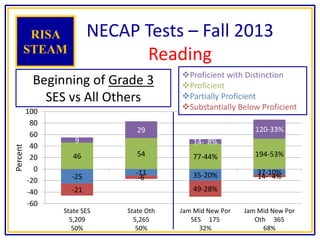
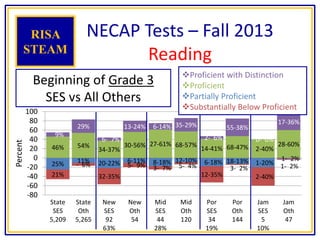
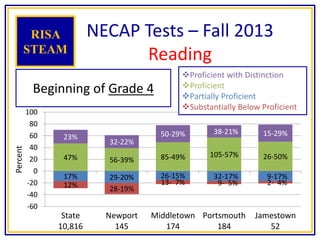
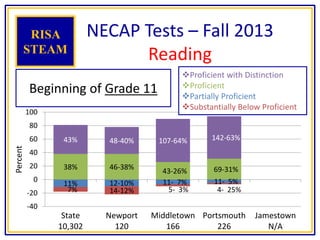
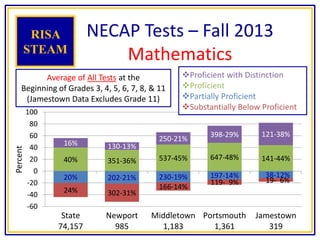
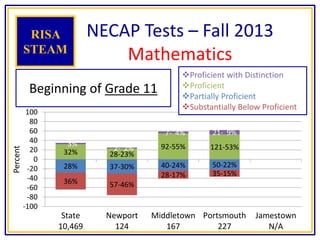
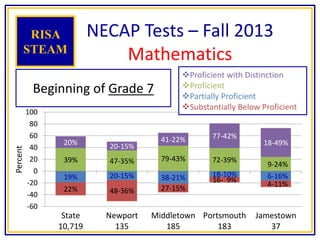
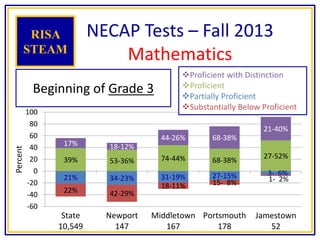
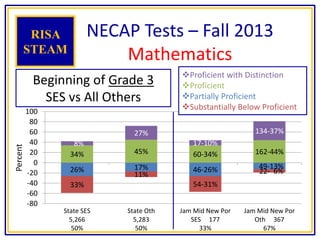
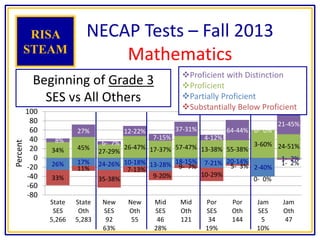
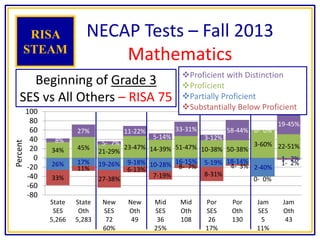
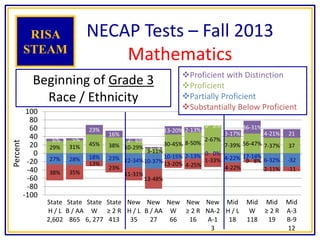
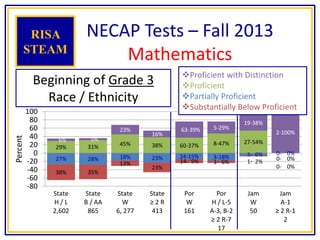
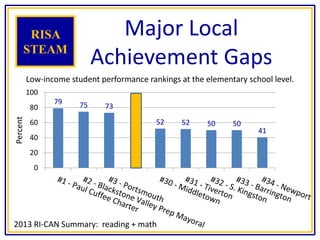
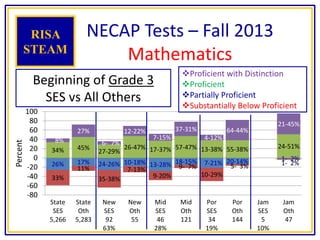
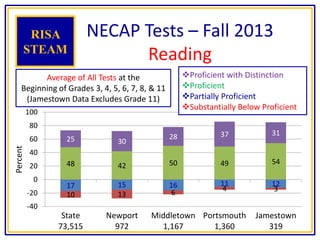
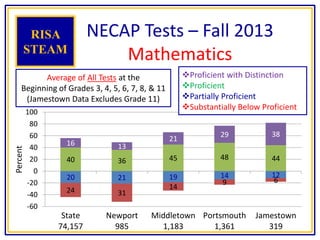
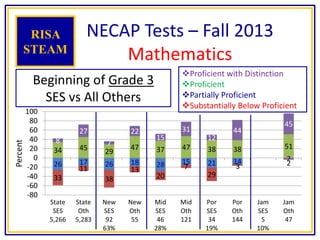
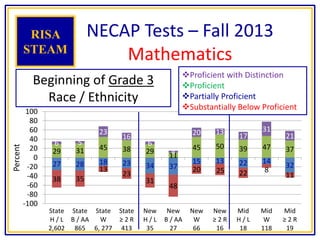
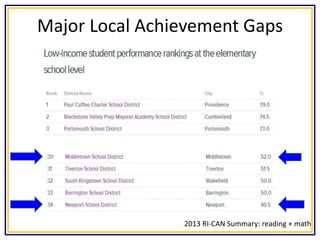
The document summarizes test score data from the 2013 New England Common Assessment Program (NECAP) for Rhode Island, Newport, Middletown, Portsmouth, and Jamestown. It shows the percentage of students who were proficient or above in reading and mathematics at various grade levels, with a focus on comparing scores of low socioeconomic status students versus others. The Rhode Island STEAM Academy charter school proposal cites this data to demonstrate the need to close achievement gaps and raise standards in STEAM disciplines.
1609 VS Dashboard LAC over 1 Year (Sep-16) revised attainmentMax Akister
This document summarizes attendance data for students in care over 1 year from September 2016 to March 2017. It includes data for in-borough schools, out-of-borough schools, and all schools combined. Attendance rates are provided by year group for primary and secondary schools separately, with overall rates for each category and a comparison to the target rate of 90%.
The document discusses implementing STEAM education through computer-adaptive formative testing. It advocates providing a digital curriculum that engages all students through challenging projects using inquiry-based learning, task-based assessment, and project-based learning. The goal is empowering students through choice and a growth mindset in a digitally-enabled environment using mobile apps to create and assess mastery through play and design.
The document discusses making soft sensors and provides guidance on materials, tools, tips, examples of soft sensors that can be made, and additional resources. It recommends conductive thread, fabrics, and metal supplies for creating circuits. Tips include testing materials first, drawing circuits beforehand, ensuring good contact, and making designs modular and washable. Examples of soft sensors include on-off switches, pressure sensors, and stretch sensors. Resources listed include guides on electrotextiles and connecting hardware to soft materials.
416. STEAM Education and The Uncommon Core
This presentation will focus on the integration of STEAM educational principles into core subjects. Although our school offers a very successful Exploratory STEM class, I believe the true strength of this educational model is in its' potential to incorporate relevant project based learning and bring the Common Core Curriculum to life for every student.
Presenter(s): Phil Brittain, Tony Campbell
Location: Meadowbrook
STEAM (Science, Technology, Engineering, Art and Mathematics) involves teaching and learning using multiple disciplines. A STEAM Lab allows students to explore concepts across subjects in a creative space centered around art. The document outlines various STEAM concepts and techniques students may explore such as creating idea maps, learning to solder, creative coding, and exhibition of student work. It also provides an example of how to structure project-based STEAM learning using objectives focused on gaining student attention, relevance, confidence, and satisfaction.
The document discusses the concept of "making" and its importance. It defines making as turning ideas into tangible forms through materials, tools and processes. Making involves self-learning, problem solving and collaboration. It discusses how making is supported by infrastructure like makerspaces, Fab Labs, and events like Maker Faires. Maker Faires allow makers to gather, share what they have made and exchange knowledge and ideas. The document argues that making is important as it can reconnect people to the material world, promote sustainability, and empower people through learning and sharing.
Dr. Clifford Choy discusses maker culture and STEAM education. He outlines PolyU Design's I MAKE initiative to promote making and maker culture through competitions, workshops, and Maker Faire Hong Kong. He defines makers, discusses why making is important for skills development and sustainability, and how PolyU Design supports making through infrastructure and STEAM knowledge. The document concludes by outlining potential student and teacher participation opportunities in Maker Faire Hong Kong 2015 workshops and competitions.
A brief look into maker education and one educator's journey to total classroom implementation. Presentation has been edited to remove identity of students.
A case study of the maker activity program among undergraduate students in Mexico.
Full-text https://www.researchgate.net/publication/317174794_A_Case_Study_of_the_Maker_Activity_Program_among_Undergraduate_Students_in_Mexico
A Look at STEAM Education across the NationPeter Fardig
Quoted in an article for The MetroWest Daily News, Peter Fardig is passionate about education and STEAM education. Peter Fardig, CEO of ThinK-12 Learning, LLC, stated that the integration of art into STEM (science, technology, engineering, and mathematics) curriculums gives educators a means to assess their knowledge and determine how well a student understands a concept.
Hive Community Meet-up 11/20/14: Hacking the Hive NYC Community Brokering ModelDixie Ching
This document discusses brokering models for connecting youth to learning opportunities through the Hive NYC Community. It defines brokering as linking youth to opportunities, individuals, and resources to support interest-driven learning. The document provides an overview of a brokering model used by Hive, including who brokers, what is brokered, and what brokering looks like. It also discusses challenges and best practices for being effective brokers, such as getting to know youth, having up-to-date opportunity listings, and creating ladders of opportunities.
Meaningful Making (for L&T Expo 2016 on 9 Dec 2016)Clifford Choy
This is a talk in L&T Expo 2016 on 9 Dec 2016, about relationship between STEM/STEAM, making and design, and encourage teachers to think of how the projects are meaningful to students.
This report card summarizes the performance of REES EL elementary school in Alief ISD. It shows the school met the standard for state accountability in 2014 based on indexes measuring student achievement, progress, closing performance gaps, and postsecondary readiness. Test results are provided for STAAR exams in reading, math, science, social studies, and writing, indicating the percentages of students who met the standard or advanced standard in various student groups. The school earned distinctions for academic achievement in reading/ELA and closing performance gaps. Demographic and financial data are also presented for the school, district, and state.
The document provides admissions statistics for undergraduate programs at Nazarbayev University from 2012 to 2018. It includes statistics on the number of applicants, admitted students, average test scores (IELTS, GPA, SAT), and gender of admitted students by school and year. The number of applicants increased each year from 199 in 2012 to 920 in 2018 while the admission rate decreased from 38.9% to 29.1% over this period.
The document reviewed New York State adult education enrollment and High School Equivalency (HSE) statistics from 2018. Some key findings included: total enrollment was 89,822 students, the measurable skills gain was 61.02%, and HSE pass rates ranged from 35-89% depending on factors like location, age, and employment status. Matching HSE test takers to adult education students found 13,346 matches, and analysis of subject level mastery showed areas like mathematics, reading, and social studies had higher percentages of students with high mastery levels.
MURSD MCAS Results & Accountability Ratings for 2013jpm66
The presentation provided an overview of Mendon-Upton Regional Schools' 2013 MCAS results and accountability status. It showed that district math and ELA scores improved in most grades from 2012 to 2013. It also reviewed the state's accountability system and classifications. Challenges identified were stagnating scores in some grades/subgroups and lower scores among high needs students. Immediate action steps outlined were analyzing data, improving writing, and curriculum mapping. Future steps proposed were additional data training, Common Core curriculum alignment, and targeting interventions.
The document provides statistics on student admissions to Nazarbayev University in Kazakhstan from 2012 to 2016. It shows the numbers of applicants, admitted students, admissions by school, category, gender and average test scores. The School of Engineering saw the biggest increase in admitted students over time, going from 3.57% of admissions in 2012 to 51.32% in 2016. Average IELTS scores were highest for the School of Humanities and Social Sciences while average SAT scores were highest for the School of Science and Technology. The percentage of female admitted students increased from 32.14% in 2012 to 48.68% in 2016.
The document provides data on student achievement, attendance, enrollment, finances, and human resources for PTISD school district. It includes STAAR test results, ACT/SAT scores, attendance rates, enrollment numbers, budgets, tax rates, and staffing information. Overall, the data shows the district maintaining high achievement levels, attendance, and financial stability over recent years.
The document provides admissions statistics for Nazarbayev University from 2012-2016, including:
- The total number of applicants and admitted students each year.
- Admissions data by NU school and applicant category for each year.
- Average IELTS, GPA, SAT, and subject test scores for admitted students by school and year.
- Gender breakdown of admitted students each year.
The document provides admissions statistics for Nazarbayev University in Kazakhstan from 2012-2017, including:
- The number of registered applicants and admitted students each year.
- Admissions data by NU school. The School of Humanities and Social Sciences admitted the most students over the period.
- Admissions breakdown by applicant category, including school graduates, Olympiad winners, and transfers.
- Average IELTS, GPA, SAT, and SAT subject scores for admitted students by school and year.
- Gender admissions statistics, with a roughly equal number of male and female admitted students over the period.
The document discusses how student performance standards will increase with the adoption of NAEP equivalency cut scores. It notes that under the previous state standards, many students were considered proficient, but under NAEP standards most would now only be considered basic. The document provides district achievement data compared to state averages and other districts to illustrate that goals will need to be higher to meet the new standards. It acknowledges successes but recognizes significant work is needed to help more students achieve proficiency under the new, more rigorous expectations.
The document provides a summary of SMEA results and accomplishments for the physical and financial targets of 2022. All KRAs met their targets at 100% accomplishment. Enrollment numbers and learner performance across subjects and grade levels are presented. Issues around access, quality, and governance are discussed along with interventions. A SWOT analysis and future strategic directions are also provided.
Education Impacts of Malawi's Social Cash Transfer ProgrammeThe Transfer Project
This quantitative study - presented to the Malawi Ministry of Gender, Children, Disability and Social Welfare in September 2019 - helps us understand how the programme can improve child schooling outcomes among recipient families.
The document provides admissions statistics for undergraduate programs at Nazarbayev University from 2014 to 2019. It includes data on the number of registered applicants, admitted students, admissions by school, applicant category, average IELTS/GPA/SAT scores, and student gender. The number of registered applicants increased each year from 248 in 2014 to 1127 in 2019, while the percentage of students admitted fluctuated between 24.6-41%. The School of Engineering and School of Science and Technology admitted the most students on average over the years.
This school profile document summarizes enrollment, health, materials, teacher training, funding, awards, dropouts, promotion rates, literacy levels, SBM assessment, stakeholder participation, learner-teacher ratios, and facilities for a school from 2016-2019. Key points include:
- Enrollment increased from 313 to 459 students from 2016-2017 to 2018-2019.
- Over 85% of students had normal health status in 2018-2019.
- The largest source of school funding was donations.
- The school received several division, regional, and provincial awards.
- Promotion and literacy rates improved over time.
- Stakeholder participation in school activities was high.
- Learner-teacher
This document outlines the annual training plan for the NC State football team for the 2016-2017 calendar year. It includes the monthly training phases from July through June, with goals of developing fundamental movement efficiency, maximum strength and power, and injury prevention. It lists the academic calendar with start and end dates for semesters and breaks. The training plan prescribes different exercises, sets, repetitions, and intensities monthly to progress athletes from off-season strength training to in-season maintenance during the competitive season. Performance tests are also scheduled to evaluate development in areas like speed, strength, and body composition.
The document summarizes the 2022-23 accountability reports for the North Carolina State Board of Education meeting. It provides context on the impact of COVID-19 on testing and accountability over the past few years. Participation rates met targets for most student subgroups but did not fully recover to pre-pandemic levels. Test performance data is presented for reading and math End of Grade assessments in grades 3-8, showing increases from the previous year in the percentage of students scoring at grade level or above across all grades. Disaggregated data is also included.
This document contains data and statistics from San Nicolas Central Elementary School regarding their key performance indicators such as enrollment rates, achievement rates, promotion and graduation rates, and programs from school years 2018-2021. It shows that the school has had consistent enrollment with 0% dropout rates. Achievement rates for subjects like English, Science, Math and Filipino are above 90% for most grade levels. Promotion, completion, graduation and survival rates have been at 100% for the past three years. The school implements programs like Brigada Eskwela, Gulayan sa Paaralan, and Basa Nongnonga to support their goals.
This document contains data from Sta. Cruz Elementary School for the first quarter of school year 2022. It includes information on enrollment numbers by grade level and gender, literacy levels in English and Filipino, quarterly GPAs, and alternative learning programs. The key points are:
- Total enrollment is 158 students, decreasing slightly from the previous year due to some student transfers.
- There are no students failing classes or not submitting modules after 4 weeks this quarter.
- 40 students, or 25% of enrolled students, are recipients of the 4P's conditional cash transfer program.
- Literacy levels show most students are instructional with some frustration and independence.
- Quarterly GPAs have no students below average
This document provides a summary of SMEA results and accomplishments for the 2022 fiscal year. It reports that all KRA targets were fully accomplished at 100% for instructional supervision, learning environment, human resource management, parents involvement, school leadership, and other tasks. Enrollment totals for junior high are provided. Academic performance levels across subjects and grade levels are outlined. Issues addressed include improving reading/numeracy, classroom shortages, and facility repairs. Overall, the school met all targets and addressed challenges to support student success.
4. Mission
Prepare all K-6 students
for success in
secondary and post-secondary education
by building an
academic, social, and technological foundation
emphasizing
mastery, critical thinking, and innovation
using an integrated, project-based
Science, Technology, Engineering, Arts/design and
Mathematics (STEAM) curriculum.
RISA
STEAM
5. Envisionment
RISA students will
- enjoy a robust understanding of knowledge that
spans the liberal arts and STEAM disciplines.
- enter 7th grade confident in their ability to learn
all disciplines.
- enter 7th grade with a proficiency and
achievement in STEAM disciplines.
RISA
STEAM
6. Goals
1. Meet or exceed statewide established levels of
performance in reading, writing, mathematics,
and science for summation and accountability.
2. 80% of students will meet or exceed
expectations for progression through grade
level benchmarks.
3. 10% of students will reach grade-plus-one level
benchmarks in at least one discipline.
RISA
STEAM
7. Why STEAM?RISA
STEAM
S – Science
T – Technology
E – Engineering
A – Arts / Design
M - Mathematics
8. 2013 NAEP - National View
WE NEED TO:
(1) CLOSE THE
ACHIEVEMENT
GAP
(2) RAISE THE
BAR FOR TOP
PERFORMERS
RISA
STEAM
9. 17% 142-15% 184-16% 143-11% 38-12%
10%
128-13% 74- 6% 58- 4% 9- 3%
48% 412-42% 580-50% 669-49% 173-54%
25% 290-30%
329-28% 499-37% 99-31%
-60
-40
-20
0
20
40
60
80
100
State
73,515
Newport
972
Middletown
1,167
Portsmouth
1,360
Jamestown
319
Percent
NECAP Tests – Fall 2013
Reading
RISA
STEAM
Proficient with Distinction
Proficient
Partially Proficient
Substantially Below Proficient
Average of All Tests at the
Beginning of Grades 3, 4, 5, 6, 7, 8, & 11
(Jamestown Data Excludes Grade 11)
11. -25
-11 35-20% 37-10%
-21
-6
49-28%
14- 4%
46 54 77-44% 194-53%
9
29
14- 8%
120-33%
-60
-40
-20
0
20
40
60
80
100
State SES
5,209
50%
State Oth
5,265
50%
Jam Mid New Por
SES 175
32%
Jam Mid New Por
Oth 365
68%
Percent
NECAP Tests – Fall 2013
Reading
RISA
STEAM
Beginning of Grade 3
SES vs All Others
Proficient with Distinction
Proficient
Partially Proficient
Subtantially Below Proficient
Proficient with Distinction
Proficient
Partially Proficient
Substantially Below Proficient
12. 25% 11% 20-22% 6-11% 8-18% 12-10% 6-18% 18-13% 1-20%
1- 2%
21%
- 6%
32-35%
5- 9% 3- 7% 5- 4%
12-35%
3- 2%
2-40%
1- 2%
46% 54%
34-37%
30-56% 27-61% 68-57%
14-41% 68-47% 2-40%
28-60%
9%
29%
6- 7%
13-24% 6-14% 35-29%
2- 6%
55-38%
0- 0%
17-36%
-80
-60
-40
-20
0
20
40
60
80
100
State
SES
5,209
State
Oth
5,265
New
SES
92
63%
New
Oth
54
Mid
SES
44
28%
Mid
Oth
120
Por
SES
34
19%
Por
Oth
144
Jam
SES
5
10%
Jam
Oth
47
Percent
NECAP Tests – Fall 2013
Reading
RISA
STEAM
Beginning of Grade 3
SES vs All Others
Proficient with Distinction
Proficient
Partially Proficient
Substantially Below Proficient
19. 26% 17% 46-26% 49-13%
33%
11%
54-31%
22- 6%
34% 45% 60-34% 162-44%
8%
27%
17-10%
134-37%
-80
-60
-40
-20
0
20
40
60
80
100
State SES
5,266
50%
State Oth
5,283
50%
Jam Mid New Por
SES 177
33%
Jam Mid New Por
Oth 367
67%
Percent
NECAP Tests – Fall 2013
Mathematics
RISA
STEAM
Beginning of Grade 3
SES vs All Others
Proficient with Distinction
Proficient
Partially Proficient
Substantially Below Proficient
20. 26% 17% 24-26% 10-18% 13-28% 18-15% 7-21% 20-14%
2-40%
1- 2%
33%
11%
35-38%
7-13%
9-20%
9- 7%
10-29%
5- 3%
0- 0%
1- 2%
34% 45%
27-29%
26-47% 17-37% 57-47% 13-38% 55-38%
3-60% 24-51%
8%
27%
6- 7%
12-22%
7-15%
37-31%
4-12%
64-44% 0- 0%
21-45%
-80
-60
-40
-20
0
20
40
60
80
100
State
SES
5,266
State
Oth
5,283
New
SES
92
63%
New
Oth
55
Mid
SES
46
28%
Mid
Oth
121
Por
SES
34
19%
Por
Oth
144
Jam
SES
5
10%
Jam
Oth
47
Percent
NECAP Tests – Fall 2013
Mathematics
RISA
STEAM
Beginning of Grade 3
SES vs All Others
Proficient with Distinction
Proficient
Partially Proficient
Substantially Below Proficient
21. 26% 17% 36-26% 44-13%
33%
11%
42-30%
20- 6%
34% 45% 48-35% 146-44%
8%
27%
13- 9%
120-37%
-80
-60
-40
-20
0
20
40
60
80
100
State SES
5,266
50%
State Oth
5,283
50%
Jam Mid New Por
SES 139
33%
Jam Mid New Por
Oth 330
67%
Percent
NECAP Tests – Fall 2013
Mathematics
RISA
STEAM
Beginning of Grade 3
SES vs All Others – RISA 75
Proficient with Distinction
Proficient
Partially Proficient
Substantially Below Proficient
22. 26% 17% 19-26% 9-18% 10-28% 16-15% 5-19% 18-14%
2-40%
1- 2%
33%
11%
27-38%
6-13%
7-19%
8- 7%
8-31%
4- 3%
0- 0%
1- 2%
34% 45%
21-29%
23-47% 14-39% 51-47% 10-38% 50-38%
3-60% 22-51%
8%
27%
5- 7%
11-22%
5-14%
33-31%
3-12%
58-44% 0- 0%
19-45%
-80
-60
-40
-20
0
20
40
60
80
100
State
SES
5,266
State
Oth
5,283
New
SES
72
60%
New
Oth
49
Mid
SES
36
25%
Mid
Oth
108
Por
SES
26
17%
Por
Oth
130
Jam
SES
5
11%
Jam
Oth
43
Percent
NECAP Tests – Fall 2013
Mathematics
RISA
STEAM
Beginning of Grade 3
SES vs All Others – RISA 75
Proficient with Distinction
Proficient
Partially Proficient
Substantially Below Proficient
23. 27% 28% 18% 23% 12-34%10-37%
10-15% 2-13% 0- 0%
4-22% 17-14%
6-32% -32
38% 35%
13%
23%
11-31%
13-48%
13-20% 4-25%
1-33%
4-22%
9- 8%
2-11% -11
29% 31% 45% 38% 10-29%
3-11%
30-45% 8-50%
2-67%
7-39% 56-47% 7-37% 37
6% 5%
23%
16%
2- 6%
1- 4
13-20% 2-13%
0- 0%
3-17%
36-31%
4-21% 21
-100
-80
-60
-40
-20
0
20
40
60
80
100
State
H / L
2,602
State
B / AA
865
State
W
6, 277
State
≥ 2 R
413
New
H / L
35
New
B / AA
27
New
W
66
New
≥ 2 R
16
New
NA-2
A-1
3
Mid
H / L
18
Mid
W
118
Mid
≥ 2 R
19
Mid
A-3
B-9
12
Percent
NECAP Tests – Fall 2013
Mathematics
RISA
STEAM
Beginning of Grade 3
Race / Ethnicity
Proficient with Distinction
Proficient
Partially Proficient
Substantially Below Proficient
24. 27% 28% 18% 23% 24-15% 3-18% 3- 6% 0- 0%
38% 35%
13%
23%
14- 9% 1- 6% 1- 2% 0- 0%
29% 31% 45% 38% 60-37% 8-47% 27-54%
0- 0%
6% 5%
23%
16%
63-39% 5-29%
19-38%
2-100%
-80
-60
-40
-20
0
20
40
60
80
100
State
H / L
2,602
State
B / AA
865
State
W
6, 277
State
≥ 2 R
413
Por
W
161
Por
H / L-5
A-3, B-2
≥ 2 R-7
17
Jam
W
50
Jam
A-1
≥ 2 R-1
2
Percent
NECAP Tests – Fall 2013
Mathematics
RISA
STEAM
Beginning of Grade 3
Race / Ethnicity
Proficient with Distinction
Proficient
Partially Proficient
Substantially Below Proficient
26. Why STEAM?
1. Close the achievement gap.
2. Raise the bar for top performers.
3. Fulfill, in part, our local responsibility to help make
21st century skills and careers attainable for ALL our
state’s learners, starting with the very youngest.
4. Support the RISD initiative to equitably include
learning in the arts / design in the elementary
school curriculum.
RISA
STEAM
27. Why STEM to STEAM?
1. Performance gap in mathematics and science, as well as in
literacy, can potentially be facilitated by integrating the arts into
STEM instruction.
2. Arts learning fosters creativity, risk-taking and seeing multiple
solutions, all of which are useful in a variety of contexts.
3. Arts-rich curricula contribute to a student’s self-identification as
a learner, thus facilitating the process of learning.
4. An interdisciplinary program integrating the areas of STEAM can
increase student engagement and unlock creativity and
innovation, thus potentially closing the achievement gap.
--- Einstein played the violin. ---
RISA
STEAM
28. RISA
STEAM
Exploring Viewpoints
Reasoning Questioning & Investigating
Finding Complexity Comparing & Connecting
Observing & Describing
(using “thinking routines” to help develop thinking dispostiions)
Traverse City, Michigan Area Public Schools & Project Zero at the Harvard Graduate School of Education
29. (Gathering data through all your senses)
RISA
STEAM
www.redlandsyear6.net, Traverse City, Michigan Area Public Schools, & (Harvard) Project Zero
31. Why STEM to STEAM?
“…artists and designers in partnership with
those developing scientific and technical
solutions can ask deep questions, bring
humanity to the problem, make us care and
create answers that resonate with our values.
And that is what will propel us forward.”
-- John Maeda
(artist, computer scientist & former RISD president)
RISA
STEAM
32. Why STEM to STEAM?
RISA
STEAM
Humanities STEM
Humanities / STEM Arts / Design
Humanities / STEAM
33. School Culture
Learning Model Inquiry, project-based learning in groups / teams
Philosophy Learning = Breathing
Attire Uniforms
Motto STEAM-POWERED
Passionate
Optimistic
Wonderful
Explorers
Respectful
Empathetic
Determined
RISA
STEAM
34. School Day / Activities
Period / Times Event
1 7:45– 8:15
2 8:15– 8:30 Assembly / Attendance
3 8:30–10:00
4 10:00–12:00
5 12:00–12:30 Lunch
6 12:30– 1:00
7 1:00– 4:00
8 4:00- 5:30
RISA
STEAM
35. School Day / Activities
Period / Times Event
1 7:45– 8:15 Individualized Instruction (needs based)
2 8:15– 8:30 Assembly / Attendance
3 8:30–10:00
4 10:00–12:00
5 12:00–12:30 Lunch
6 12:30– 1:00 Individualized Instruction (needs based)
7 1:00– 4:00
8 4:00- 5:30 Individualized Instruction (needs based)
or Enrichment Programs, e.g. Foreign Language
RISA
STEAM
36. School Day / Activities
Period / Times Event
1 7:45– 8:15 Individualized Instruction (needs based)
2 8:15– 8:30 Assembly / Attendance
3 8:30–10:00 Mathematics Block 1*
4 10:00–12:00 English Language Arts & Social Studies
plus Foreign Language Block 2*
5 12:00–12:30 Lunch
6 12:30– 1:00 Individualized Instruction (needs based)
7 1:00– 4:00 STEAM Block 3*
8 4:00- 5:30 Individualized Instruction (needs based)
or Enrichment Programs, e.g. Foreign Language
* Breaks, play, music, or nap times will be included at teachers’ discretion
RISA
STEAM
37. Maximum Enrollment, Classes,
& Teachers by Year & Grade
Acad
Year
Pre-
K
K 1 2 3 4 5 6 Total Classes*
Teachers +
Suppl T’s*
Sites
2016 0 75 75 0 0 0 0 0 150 6 12 1
* 25 students / class 3 classes /grade, 1 teacher + 1 supplemental teacher / class
RISA
STEAM
39. Yearly Calendar
Regular 180-Day School Year
Three Summer Sessions (R3ER3)
--------------------
Session I: Ramp Up, Review, Reinforcement – R3
Session II: Enhancement – E
Session III: Ramp Up, Review, Reinforcement – R3
RISA
STEAM
40. Session II:
Enhancement
Philosophically, RISA embraces three notions:
1. Learning is a self evident activity, like breathing.
2. Learning is a privilege, intrinsically and inherently
valued, omnnipresent, and fun.
3. The excitement of learning a robust set of topics
instinctively enhances the soul.
--------------------
All RISA students attend at least one week of on or off
site enhanced learning during the summer.
--------------------
RISA
STEAM
41. Session II:
Enhancement (cont)
Enhancement Topics May Include:
Astronomy RI Art / Heritage
Etymology Cultures / Customs of Countries
Foreign Language STEAM Camps
Math Puzzles Numeracy Topics
History of U.S. Presidents Geography
Psychology Environment / Energy Conservation
Life Sciences Art Appreciation
Computer Programming Environmental Science
Information Technology Computer Game Theory
Robotics Competitive LEGO Construction / Cities
Theory of Chess Foreign Country Internships
STEAM Olympics Photography
RISA
STEAM
42. Organization
Rhode Island STEAM Academy
RISA Board
Director of
Special Ed
Curr & Prof
Dev Team
Operations
Director
Head of
School
Gr K-1+
Teachers
Office
Support
School Support
Services
Accounting
(p/t)
IT (p/t)
RISA
STEAM
43. Enrollment
1. ≥ 50% Free or Reduced Lunch (FRL)
2. Lottery driven if demand exceeds supply
(75 children / grade)
3. Military children will have an opportunity
to attend.
4. Children must reside in Newport,
Middletown, Portsmouth, or Jamestown.
RISA
STEAM
44. Rhode Island
STEAM Academy
School Features (RISA Additions)
Curriculum – Liberal Arts + STEAM (STEM + Arts/Design)
Curriculum Development – 2 Curr & Prof Dev’rs
Regular School Day + 1 Hr + Extra Time + Some Weekends
Class of 25 Students – 1 Teacher (T) + 1 Suppl. Teacher (ST)
Regular School Calendar + Summer R3ER3
10 Month Teachers + 2 Months in Summer (Ts + STs)
Student Attire – Uniform
Additional $ Support – Grants
RISA
STEAM
45. Learning Results
1. Greater Time on Task.
2. Curricular Breadth – Humanities + STEAM
3. Drop Off / Pick Up Arrangements – Learning Opportunities
4. Minimal Distractions
a. No transportation time between day care and school.
b. Predominantly no substitute teachers (T + ST)
5. Learning mechanisms: Daily Inquiry and Project-Based
Learning.
6. Proven Curricular Success + Arts / Design attraction.
7. Increased Achievement – Raising the Performance Bar
RISA
STEAM
46. Concerns
RISA
STEAM
1. Transference of Culture / Climate Conditions at NAPS to RISA
2. Training of Teachers in Inquiry & Project-Based Learning
3. Training of Teachers in horizontal STEAM fundamentals
4. Teacher Burnout
5. Funding & Sustainability under Projected Funding Formula
Revisions
6. Transportation to & from RISA during off hours
7. Union Perspectives
8. Location, Footprint, Connections with Existing Schools
9. Parental Engagement
10. Mission & Goal Accomplishment (Proficiency & Accreditation)
47. Excitement – New Model
(Bold, Innovative, Creative, and Competent – BICaC)
RISA
STEAM
1. STEAM Curriculum
2. Outstanding & Challenge (FRR) Learners
3. Teaching & Learning Environment
4. Accreditation Standards
5. Grant Participation
6. Community Development
Life of Success
on a Global Scale from STEAM Thinking
OUTSIDE THE BOX!!!
48. Thoughts
1. Schools are doing well, annually improving.
2. STEAM spells: High-paying, rewarding,
more secure JOBS!
3. Thanks for coming. We appreciate your
standing up for your position. Please share
your position plus answers to two questions.
a. Did you read our proposal / application?
b. How can we accommodate your concerns?
RISA
STEAM
52. Goals (cont.)
1. Regarding special needs students, 80% of students who qualify
for IEP will reach grade-level proficiency on statewide established targets.
2. Regarding the reading of equivalent grade-level books as
evidence established gainful learning habits and behaviors,
1. 80% of students will read 20 equivalent grade-level books.
2. 40% of students will read 50 equivalent grade-level books.
3. 20% of students will read 25 equivalent grade-plus-one-level books.
3. Regarding the evidence of an inclusive environment and
community, 80% of students participate in at least one
community service project.
4. Work with STEAM practitioners to establish STEAM
accreditation standards with the concurrence of RISD.
RISA
STEAM
53. 26% 17% 24-26% 10-18% 13-28% 18-15% 7-21% 20-14% 1- 2%
33%
11%
35-38%
7-13%
9-20%
9- 7%
10-29%
5- 3% 1- 2%
34% 45%
27-29%
26-47% 17-37% 57-47% 13-38% 55-38% 24-51%
8%
27%
6- 7%
12-22%
7-15%
37-31%
4-12%
64-44%
21-45%
-80
-60
-40
-20
0
20
40
60
80
100
State
SES
5,266
State
Oth
5,283
New
SES
92
63%
New
Oth
55
Mid
SES
46
28%
Mid
Oth
121
Por
SES
34
19%
Por
Oth
144
Jam
SES
5
10%
Jam
Oth
47
Percent
NECAP Tests – Fall 2013
Mathematics
RISA
STEAM
Beginning of Grade 3
SES vs All Others
Proficient with Distinction
Proficient
Partially Proficient
Substantially Below Proficient
54. 17 15 16 11 12
10 13 6
4 3
48 42 50 49 54
25 30
28 37 31
-40
-20
0
20
40
60
80
100
State
73,515
Newport
972
Middletown
1,167
Portsmouth
1,360
Jamestown
319
Percent
NECAP Tests – Fall 2013
Reading
RISA
STEAM
Proficient with Distinction
Proficient
Partially Proficient
Substantially Below Proficient
Average of All Tests at the
Beginning of Grades 3, 4, 5, 6, 7, 8, & 11
(Jamestown Data Excludes Grade 11)
55. 20 21 19 14 12
24 31
14
9 6
40 36 45 48 44
16 13
21
29 38
-60
-40
-20
0
20
40
60
80
100
State
74,157
Newport
985
Middletown
1,183
Portsmouth
1,361
Jamestown
319
Percent
NECAP Tests – Fall 2013
Mathematics
RISA
STEAM
Proficient with Distinction
Proficient
Partially Proficient
Substantially Below Proficient
Average of All Tests at the
Beginning of Grades 3, 4, 5, 6, 7, 8, & 11
(Jamestown Data Excludes Grade 11)
59. 26 17 26 18 28 15 21 14 2
33
11
38
13
20
7
29
3 2
34 45 29
47 37 47 38 38 51
8
27
7
22
15
31
12
44
45
-80
-60
-40
-20
0
20
40
60
80
100
State
SES
5,266
State
Oth
5,283
New
SES
92
63%
New
Oth
55
Mid
SES
46
28%
Mid
Oth
121
Por
SES
34
19%
Por
Oth
144
Jam
SES
5
10%
Jam
Oth
47
Percent
NECAP Tests – Fall 2013
Mathematics
RISA
STEAM
Beginning of Grade 3
SES vs All Others
Proficient with Distinction
Proficient
Partially Proficient
Substantially Below Proficient
60. 27 28 18 23 34 37
15 13 22 14
32
38 35
13
23
31
48
20 25 22 8
11
29 31 45 38 29
11
45 50 39 47 37
6 5
23
16
6
4
20 13
17
31
21
-100
-80
-60
-40
-20
0
20
40
60
80
100
State
H / L
2,602
State
B / AA
865
State
W
6, 277
State
≥ 2 R
413
New
H / L
35
New
B / AA
27
New
W
66
New
≥ 2 R
16
Mid
H / L
18
Mid
W
118
Mid
≥ 2 R
19
Percent
NECAP Tests – Fall 2013
Mathematics
RISA
STEAM
Beginning of Grade 3
Race / Ethnicity
Proficient with Distinction
Proficient
Partially Proficient
Substantially Below Proficient
61. Why STEAM?
1. Close the achievement gap.
2. Raise the bar for top performers.
3. Fulfill, in part, our local responsibility to help level
the global playing field in STEAM disciplines by
capturing the imagination of our youngest learners.
4. Support the RISD initiative to equitably include
learning in the arts / design in the elementary
school curriculum.
RISA
STEAM
63. School Culture
Learning Model Inquiry, project-based learning in groups / teams
Philosophy Learning = Breathing
Attire Uniforms
Motto STEAM-POWERED
Passionate
Optimistic
Wonderful
Explorers
Respectful
Empathetic
Determined
RISA
STEAM
64. Session II:
Enhancement
Philosophically, RISA embraces three notions:
1. Learning is a self evident activity, like breathing.
2. Learning is a privilege, intrinsically and inherently valued, omnnipresent, and fun.
3. The excitement of learning a robust set of topics instinctively enhances the soul.
--------------------
All RISA students attend at least one week of on or off site
enhanced learning during the summer.
--------------------
Enhancement Topics May Include:
Etymology Environmental Science Cultures / Customs of Countries
Astronomy Foreign Language STEAM Camps
Math Puzzles Numeracy Topics History of U.S. Presidents
Geography Psychology Environment / Energy Conservation
Life Sciences Art Appreciation Computer Programming
RI Art / Heritage Information Technology Computer Game Theory
Robotics Theory of Chess Competitive Lego Construction / Cities
Photography Foreign Country Internships STEAM Olympics
RISA
STEAM
65. Rhode Island
STEAM Academy
Matters of Interest
Union
Summer Transportation
Insertion of Arts (Design) within STEM (Connect with PLTW)
Interface of CPD Team with Head of School, Teachers, and
Supplemental Teachers
Meeting All of the Individual Student Needs
Recruitment and Retention of Qualified Teachers
Professional Development of Teachers in RIDE Requirements
Accreditation Interfacing with RISD and West Coast STEAM Schools
RISA
STEAM