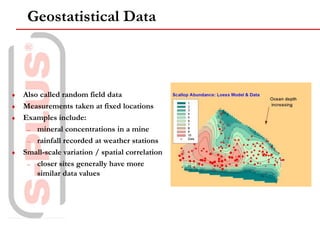
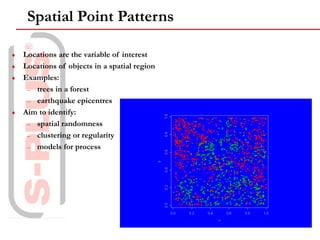
RSS : Software for Spatial Analysis
Analysis and Visualization
of Spatial Data
Richard Pugh
Product Specialist
MathSoft International
Overview
Introduction
S+SpatialStats 1.5
S-PLUS for ArcView GIS 1.2
EnvironmentalStats for S-PLUS 2.0
Working with S-PLUS
Great Interactive
Graphics
Powerful S
Programming
Language
Complete Set of
Statistical
Algorithms
Full Interoperability
and Deployability
S-PLUS
Data Analysis in S-PLUS
 A state-of-the-art solution for exploratory data analysis,
statistical modeling, and advanced data visualization
 Combines the S object-oriented programming language with
over 4200 prewritten functions
 Offers the most comprehensive set of robust, classical and
modern statistical methods available anywhere
S-PLUS
 Over 80 2D & 3D Graph Types
 Fully Object-Oriented Graphics
 Trellis (Conditional) Plots
 Dynamic Brush & Spin
 Linked Plots
 Embed Data in Graphs
 Exclude points from curve fits
 Interactive Plots
 Multiple Axes
 Multiple Plots on Graphs
 Multiple Graphs/Page
 Tabbed Graph Pages
S-PLUS 2000: Graphics
X
A
n
g
l
e
=
2
4
0 X
A
n
g
l
e
=
3
3
0
X
A
n
g
l
e
=
6
0 X
A
n
g
l
e
=
1
5
0
-
0.010
-
0.009
-
0.008
-
0.007
-
0.006
0
1
0
0
2
0
0
3
0
0
4
0
0
5
0
0
6
0
0
V al ue
D
e
n
s
i
t
y
Wei
ght
 Basic Statistics
 ANOVA & Regression
 GLMs, GAMs and NLMs
 Non Parametric & Local Regression
 Multivariate Statistics
 Robust Methods
 Survival Analysis
 Tree Models
 Quality Control Charts
 Mixed Effects Models
 Clustering
 Bootstrap / Jackknife
 Smoothing
 Time Series
 Power / Sample Size / Design
 Missing Data Imputation
Com p. 1
C
o
m
p
.
2
-
0.4
-
0.2
0.0
0.2
0.4
-
0
.
4
-
0
.
2
0
.
0
0
.
2
0
.
4
1
2
3
4
5
6
7
8
9
10
11
12
13
14
15
16
17
18
19
20
21
22
23
24
25
-
100
-
50
0 50
-
1
0
0
-
5
0
0
5
0
di ffge
c om pl e
al gebr
a
r
eal s
s tati s
S-PLUS 2000: Statistics
di
f
f
ge om
s t
at
i
s t
i
c s
r ea l
s
c o m
pl
ex
al
ge br
0
.
0
0
.
3
0
.
6
C o
m
p
. 1
di
f
f
ge om
s t
at
i
s t
i
c s
r ea l
s
c o m
pl
ex
al
ge br
-
0
.
6
0
.
2
C o
m
p
. 2
r ea l
s
s t
at
i
s t
i
c s
c o m
pl
ex
al
ge br a
di
f
f
ge om
-
0
.
6
0
.
2
C o
m
p
. 3
c o m
pl
ex
di
f
f
ge om
r ea l
s
al
ge br a
s t
at
i
s t
i
c
-
0
.
4
0
.
4
C o
m
p
. 4
al
ge br a
r ea l
s
c o m
pl
ex
s t
at
i
s t
i
c s
di
f
f
ge om
-
0
.
2
0
.
6
C o
m
p
. 5
 C, C++, & FORTRAN object code links
 OLE Automation: Server/Client
 Interaction with UNIX & DOS O/S
 Active X
 DDE
 JAVA
S-PLUS Integration
Com ponen
C
o
m
p
o
n
e
n
t
2
-
4 -
2 0 2 4
-
1
.
0
-
0
.
5
0
.
0
0
.
5
1
.
0
1
.
5
T hes e two c om
 S+SpatialStats
 S-PLUS for ArcView GIS
 EnvironmentalStats for S-PLUS
 S+NUOPT
 S+GARCH
 S+Wavelets
 S+SeqTrial
S-PLUS Add-On Modules
 Geostatistical Data
 Spatial Point Patterns
 Lattice data
S+SpatialStats
S-PLUS for ArcView GIS
 Link between S-PLUS and ArcView
 Import Data Easily
 Unparalleled Graphics
 Superior Analytical Power
 Data from Monitoring Networks
 Display of Probability Distributions
 Goodness-of-fit Tests
 Sample Size Calculation
 Prediction and Tolerance Intervals
 Risk Assessment
 Type I singly and multiply censored data
EnvironmentalStats for S-PLUS
 Also called random field data
 Measurements taken at fixed locations
 Examples include:
– mineral concentrations in a mine
– rainfall recorded at weather stations
 Small-scale variation / spatial correlation
– closer sites generally have more
similar data values
Geostatistical Data
 Producing Empirical Variograms
 Fitting Theoretical Variogram Models
 Exploration for Anisotropy
 Performing Point and Block Kriging
 Simulating Geostatistical Data
Analyzing Geostatistical Data
 Observations associated with spatial regions
 Examples:
– remote sensed images (regular)
– cancer rates for Washington counties (irregular)
 Neighbourhood structure
 Neighbouring regions may have correlated data
Lattice Data
 Defining a neighborhood structure
 Testing for spatial autocorrelation
 Fitting spatial linear models
 Model selection
Analyzing Lattice Data
 Locations are the variable of interest
 Locations of objects in a spatial region
 Examples:
– trees in a forest
– earthquake epicentres
 Aim to identify:
– spatial randomness
– clustering or regularity
– models for process
Spatial Point Patterns
 Testing for CSR
– Nearest-neighbour methods
 Intensity estimation
 K-functions (second order properties)
 Simulating point process data
Analyzing Spatial Point Patterns
SpatialStats Graphical User Interface
S-PLUS for ArcView GIS:
 An ArcView GIS extension
 Integrates the powerful statistics, data analysis, and presentation quality graphics
capabilities of S-PLUS with the cartographic rendering and data management
abilities of ArcView GIS
 S-PLUS for ArcView GIS dramatically extends the ArcView analysis charting
capabilities
 For the first time in ArcView, you get accurate statistical inference which accounts
for the spatial dependency pattern
 S-PLUS data tables with analyses results can be imported back into ArcView for
plotting in a wide range of map projections
 Powerful complement to ARC/INFO via data conversion to ArcView GIS formats
S-PLUS for ArcView GIS: Graphics
 Import existing S-PLUS Graphs
 Colour classification plots and pie / bar charts
 Two Step Graph Wizard with Plot Gallery
– 2D, 3D, Pie, Matrix, Multiple Axis,...
– Trellis plots made easy!
 Spatial Neighbors builds weights between neighboring polygons
 Global Spatial Auto-correlation Indexes
 Moran’s I & Geary’s C measures
 Local Index of Spatial Association
 Spatial Linear Regression
 Model variables selected from themes or S-PLUS data frames
Spatial Statistics Menu
S+EnvironmentalStats
 Add-on Module for S-PLUS
 Monitoring Water, Soil, and Air Use Statistics to Compare to “Background”
and Look for Trends
Lognormal Mixture Density w ith
(mean1=5, cv1=1, mean2=20, cv2=0.5, p.mix=0.5)
Value of Random Variable
Relative
Frequency
0 10 20 30 40
0.0
0.02
0.04
0.06
0.08
EnvironmentalStats Features
 Probability Density and Cumulative Density Plots
 QQ Plots for all Probability Distributions
 Estimation of Distribution Parameters and Quantiles, and C.Intervals
– Maximum Likelihood and Minimum Variance Unbiased
– Method of Moments
– L-Moments
 Additional Prob. Distributions
– Generalized Extreme Value
– Lognormal Mixture
– 3 Parameter Lognormal
 Goodness-of-Fit Tests
– Chi-Square
– Kolmogorov-Smirnov
– PPCC
– Shapiro-Wilk
– Shapiro-Francia
0.2 0.4 0.6 0.8 1.0 1.2 1.4
0.0
0.5
1.0
1.5
TcCB
Relative
Frequency
Histogram of Observed Data
with Fitted Normal Distribution
Order Statistics for TcCB and
Normal(mean=0.5985106, sd=0.2836408) Distribution
Cumulative
Probability
0.2 0.4 0.6 0.8 1.0 1.2
0.0
0.2
0.4
0.6
0.8
1.0
Empirical CDF for TcCB (solid line)
with Fitted Normal CDF (dashed line)
Quantiles of Normal(mean = 0.5985106, sd = 0.2836408)
Quantiles
of
TcCB
0.0 0.2 0.4 0.6 0.8 1.0 1.2
0.0
0.4
0.8
1.2
Quantile-Quantile Plot
with 0-1 Line
Results of Shapiro-Wilk GOF
Hypothesized
Distribution: Normal
Estimated Parameters: mean = 0.5985106
sd = 0.2836408
Data: TcCB in epa.94b.tccb.df
Subset With: Area == "Reference"
Sample Size: 47
Test Statistic: W = 0.9179198
Test Statistic Parmeter: n = 47
P-value: 0.002830172
Results of Shapiro-Wilk GOF Test for TcCB
EnvironmentalStats Features
 Prediction and Tolerance Intervals
 Special Nonparametric Hypothesis Tests for Trend
and Shift
– Seasonal Kendall’s Tau for Trend
– Quantile Test for Shift in Upper Tail
 Methods for Type I Singly and Multiply
Censored Data
 Sample Size and Power Calculations and Plots
 Tools for Probabilistic Risk Assessment
– Latin Hypercube Sampling
– Generate Random Numbers from Different
Distributions With a Specified Rank Correlation
 Built-In Data Sets and Extensive Help System
Sample Size (n)
Half-Width
600 800 1000 1200 1400
0.025
0.030
0.035
0.040
0.045
Half-Width vs. Sample Size for Confidence Interval for p,
w ith Confidence Level = 0.95, and p Hat = 0.5
“The Help System Alone is Worth the Price of Admission”
EnvironmentalStats 2.0 (Beta)
 Version 2.0 (in Beta) Has:
– Pull-Down Menus
– Power and Sample Size for Lognormal Distribution
– Optimal Box-Cox Transformations
– Simultaneous Prediction Intervals
– Nonparametric von Neumann Test for Serial Correlation
S-PLUS GIS Users
Natural Resources - Amoco, Commonwealth Edison, Hydro Quebec, Kimberly Clark, Koch
Industries, Phillip Morris, Weyerhauser, Willamette Industries...
Marketing - AC Nielsen, Amazon.com, Canada Post, CTB McGraw Hill, Dairy Queen, JD Powers &
Associates, McDonalds, Rand Corporation, Readers Digest, Sears Roebuck & Co, Time Warner …
Transportation - Airborne Express, American Airlines, Enterprise Rent A Car, Transport Canada...
Government - Centers for Disease Control, Department of Fisheries and Oceans, DOE, EPA, FAA,
FCC, FDA, Federal Housing Administration, IRS, NIH, NIST, NOAA, Social Security Admin, US
Air Force, US Forest Service, US Geological Survey, SAPD ...
Worldwide – NASA, US EPA, USGS, Centres for Disease Control
UK – NERC - Centre for Ecology and Hydrology – British Geological Survey,
British Antarctic Survey, Macauley Land Use Research Institute,
BIOSS, CEFAS, MAFF, Marlab
EnvironmentalStats Users
 Government Agencies
– EPA, USGS, etc.
 Commercial Consultants
– CH2M Hill, Exponent
 Academics
– Environmental Engineering, Biostatistics,
Environmental Health, Mathematics, etc.
 Students
 People Outside the Environmental Field!
– Merck
– Lockheed Martin
Questions Posed
 Point Patterns 1 - Random / Clustered - Intensity
 Point Patterns 2 - Cross Spectral Analysis
 Point Patterns 3 – Mark Correlation Functions
 Lattice Data 1 – Spatial Regression Methods for Normal Data
 Lattice Data 2 – Spatial Regression Methods for Non-Normal Data
 Lattice Data 3 – Spatial Smoothing Methods
 Geostatistical Data 1 – Variograms and Kriging
 Hybrid Patterns 1 – Cross Spectral Analysis
 Hybrid Patterns 2 – Bayesian Hierarchical Models
?
Live Demo Time!
 Writing a Presentation on Spatial Statistics
 User Input (mostly at a Spatial Conference)
 2 Major Advantages …
 Geostatistical Data
• Variogram plots and boxplots and clouds
• Directional variograms and Correlograms for Exploring Anisotrophy
• Empirical Variogram Estimation including Robust Methods
• Variogram Models including Spherical and Exponential
• Ordinary and Universal Kriging
• Block and Point Kriging Prediction at arbitrary Location with Standard Errors
• Parametric and Non-parametric Trend Surfaces
 Point Patterns
• Point Maps that Include Region Boundaries
• Spatial Randomness Tests
• Ripley’s K-Function
• Simultation of Spatial Random Processes
• Local Intensity Estimation
 Lattice Data
• “Binning” of High Density Data into a Regular Lattice of Counts
• Geary and Moran Spatial Autocorrelation coefficients
• Spatial Regression Models including Conditional and Simultaneous Autoregressive Models
• Nearest Neighbour Search
• Visualisation of Neighbour Structures
1) S-PLUS GIS Toolbox
2) It’s in S-PLUS!
 Advanced Graphics
• Exclusive Trellis Graphics
• 3D Plotting and Spinning
• Contour Plots
• Overlaying Plots
• Brush and Spin Environment
• Export to Large Number of Formats
• Java Graphlets
• Imaging Plots
• Hexagonal Binning
 “S” Language
• Powerful Language
• Excel Integration
• Call from ArcView with Link
• Full Visability and Customisation
• C, C++, Fortran and Java Connectivity
• 100,000 + User Community
 Statistics
• Cluster Analysis
• Tree Models
• Advanced Regression
• Data Mining Tools
• Linear and Non-Linear Mixed Effects
• Missing Data
Now What?
For User Manuals (pdf)
email rpugh@mathsoft.co.uk
Questions?

RichardPughspatial.ppt

  • 1.
    RSS : Softwarefor Spatial Analysis Analysis and Visualization of Spatial Data Richard Pugh Product Specialist MathSoft International
  • 2.
    Overview Introduction S+SpatialStats 1.5 S-PLUS forArcView GIS 1.2 EnvironmentalStats for S-PLUS 2.0 Working with S-PLUS
  • 3.
    Great Interactive Graphics Powerful S Programming Language CompleteSet of Statistical Algorithms Full Interoperability and Deployability S-PLUS Data Analysis in S-PLUS
  • 4.
     A state-of-the-artsolution for exploratory data analysis, statistical modeling, and advanced data visualization  Combines the S object-oriented programming language with over 4200 prewritten functions  Offers the most comprehensive set of robust, classical and modern statistical methods available anywhere S-PLUS
  • 5.
     Over 802D & 3D Graph Types  Fully Object-Oriented Graphics  Trellis (Conditional) Plots  Dynamic Brush & Spin  Linked Plots  Embed Data in Graphs  Exclude points from curve fits  Interactive Plots  Multiple Axes  Multiple Plots on Graphs  Multiple Graphs/Page  Tabbed Graph Pages S-PLUS 2000: Graphics X A n g l e = 2 4 0 X A n g l e = 3 3 0 X A n g l e = 6 0 X A n g l e = 1 5 0 - 0.010 - 0.009 - 0.008 - 0.007 - 0.006 0 1 0 0 2 0 0 3 0 0 4 0 0 5 0 0 6 0 0 V al ue D e n s i t y Wei ght
  • 6.
     Basic Statistics ANOVA & Regression  GLMs, GAMs and NLMs  Non Parametric & Local Regression  Multivariate Statistics  Robust Methods  Survival Analysis  Tree Models  Quality Control Charts  Mixed Effects Models  Clustering  Bootstrap / Jackknife  Smoothing  Time Series  Power / Sample Size / Design  Missing Data Imputation Com p. 1 C o m p . 2 - 0.4 - 0.2 0.0 0.2 0.4 - 0 . 4 - 0 . 2 0 . 0 0 . 2 0 . 4 1 2 3 4 5 6 7 8 9 10 11 12 13 14 15 16 17 18 19 20 21 22 23 24 25 - 100 - 50 0 50 - 1 0 0 - 5 0 0 5 0 di ffge c om pl e al gebr a r eal s s tati s S-PLUS 2000: Statistics di f f ge om s t at i s t i c s r ea l s c o m pl ex al ge br 0 . 0 0 . 3 0 . 6 C o m p . 1 di f f ge om s t at i s t i c s r ea l s c o m pl ex al ge br - 0 . 6 0 . 2 C o m p . 2 r ea l s s t at i s t i c s c o m pl ex al ge br a di f f ge om - 0 . 6 0 . 2 C o m p . 3 c o m pl ex di f f ge om r ea l s al ge br a s t at i s t i c - 0 . 4 0 . 4 C o m p . 4 al ge br a r ea l s c o m pl ex s t at i s t i c s di f f ge om - 0 . 2 0 . 6 C o m p . 5
  • 7.
     C, C++,& FORTRAN object code links  OLE Automation: Server/Client  Interaction with UNIX & DOS O/S  Active X  DDE  JAVA S-PLUS Integration Com ponen C o m p o n e n t 2 - 4 - 2 0 2 4 - 1 . 0 - 0 . 5 0 . 0 0 . 5 1 . 0 1 . 5 T hes e two c om
  • 8.
     S+SpatialStats  S-PLUSfor ArcView GIS  EnvironmentalStats for S-PLUS  S+NUOPT  S+GARCH  S+Wavelets  S+SeqTrial S-PLUS Add-On Modules
  • 9.
     Geostatistical Data Spatial Point Patterns  Lattice data S+SpatialStats
  • 10.
    S-PLUS for ArcViewGIS  Link between S-PLUS and ArcView  Import Data Easily  Unparalleled Graphics  Superior Analytical Power
  • 11.
     Data fromMonitoring Networks  Display of Probability Distributions  Goodness-of-fit Tests  Sample Size Calculation  Prediction and Tolerance Intervals  Risk Assessment  Type I singly and multiply censored data EnvironmentalStats for S-PLUS
  • 12.
     Also calledrandom field data  Measurements taken at fixed locations  Examples include: – mineral concentrations in a mine – rainfall recorded at weather stations  Small-scale variation / spatial correlation – closer sites generally have more similar data values Geostatistical Data
  • 13.
     Producing EmpiricalVariograms  Fitting Theoretical Variogram Models  Exploration for Anisotropy  Performing Point and Block Kriging  Simulating Geostatistical Data Analyzing Geostatistical Data
  • 14.
     Observations associatedwith spatial regions  Examples: – remote sensed images (regular) – cancer rates for Washington counties (irregular)  Neighbourhood structure  Neighbouring regions may have correlated data Lattice Data
  • 15.
     Defining aneighborhood structure  Testing for spatial autocorrelation  Fitting spatial linear models  Model selection Analyzing Lattice Data
  • 16.
     Locations arethe variable of interest  Locations of objects in a spatial region  Examples: – trees in a forest – earthquake epicentres  Aim to identify: – spatial randomness – clustering or regularity – models for process Spatial Point Patterns
  • 17.
     Testing forCSR – Nearest-neighbour methods  Intensity estimation  K-functions (second order properties)  Simulating point process data Analyzing Spatial Point Patterns
  • 18.
  • 19.
    S-PLUS for ArcViewGIS:  An ArcView GIS extension  Integrates the powerful statistics, data analysis, and presentation quality graphics capabilities of S-PLUS with the cartographic rendering and data management abilities of ArcView GIS  S-PLUS for ArcView GIS dramatically extends the ArcView analysis charting capabilities  For the first time in ArcView, you get accurate statistical inference which accounts for the spatial dependency pattern  S-PLUS data tables with analyses results can be imported back into ArcView for plotting in a wide range of map projections  Powerful complement to ARC/INFO via data conversion to ArcView GIS formats
  • 20.
    S-PLUS for ArcViewGIS: Graphics  Import existing S-PLUS Graphs  Colour classification plots and pie / bar charts  Two Step Graph Wizard with Plot Gallery – 2D, 3D, Pie, Matrix, Multiple Axis,... – Trellis plots made easy!
  • 21.
     Spatial Neighborsbuilds weights between neighboring polygons  Global Spatial Auto-correlation Indexes  Moran’s I & Geary’s C measures  Local Index of Spatial Association  Spatial Linear Regression  Model variables selected from themes or S-PLUS data frames Spatial Statistics Menu
  • 22.
    S+EnvironmentalStats  Add-on Modulefor S-PLUS  Monitoring Water, Soil, and Air Use Statistics to Compare to “Background” and Look for Trends Lognormal Mixture Density w ith (mean1=5, cv1=1, mean2=20, cv2=0.5, p.mix=0.5) Value of Random Variable Relative Frequency 0 10 20 30 40 0.0 0.02 0.04 0.06 0.08
  • 23.
    EnvironmentalStats Features  ProbabilityDensity and Cumulative Density Plots  QQ Plots for all Probability Distributions  Estimation of Distribution Parameters and Quantiles, and C.Intervals – Maximum Likelihood and Minimum Variance Unbiased – Method of Moments – L-Moments  Additional Prob. Distributions – Generalized Extreme Value – Lognormal Mixture – 3 Parameter Lognormal  Goodness-of-Fit Tests – Chi-Square – Kolmogorov-Smirnov – PPCC – Shapiro-Wilk – Shapiro-Francia 0.2 0.4 0.6 0.8 1.0 1.2 1.4 0.0 0.5 1.0 1.5 TcCB Relative Frequency Histogram of Observed Data with Fitted Normal Distribution Order Statistics for TcCB and Normal(mean=0.5985106, sd=0.2836408) Distribution Cumulative Probability 0.2 0.4 0.6 0.8 1.0 1.2 0.0 0.2 0.4 0.6 0.8 1.0 Empirical CDF for TcCB (solid line) with Fitted Normal CDF (dashed line) Quantiles of Normal(mean = 0.5985106, sd = 0.2836408) Quantiles of TcCB 0.0 0.2 0.4 0.6 0.8 1.0 1.2 0.0 0.4 0.8 1.2 Quantile-Quantile Plot with 0-1 Line Results of Shapiro-Wilk GOF Hypothesized Distribution: Normal Estimated Parameters: mean = 0.5985106 sd = 0.2836408 Data: TcCB in epa.94b.tccb.df Subset With: Area == "Reference" Sample Size: 47 Test Statistic: W = 0.9179198 Test Statistic Parmeter: n = 47 P-value: 0.002830172 Results of Shapiro-Wilk GOF Test for TcCB
  • 24.
    EnvironmentalStats Features  Predictionand Tolerance Intervals  Special Nonparametric Hypothesis Tests for Trend and Shift – Seasonal Kendall’s Tau for Trend – Quantile Test for Shift in Upper Tail  Methods for Type I Singly and Multiply Censored Data  Sample Size and Power Calculations and Plots  Tools for Probabilistic Risk Assessment – Latin Hypercube Sampling – Generate Random Numbers from Different Distributions With a Specified Rank Correlation  Built-In Data Sets and Extensive Help System Sample Size (n) Half-Width 600 800 1000 1200 1400 0.025 0.030 0.035 0.040 0.045 Half-Width vs. Sample Size for Confidence Interval for p, w ith Confidence Level = 0.95, and p Hat = 0.5 “The Help System Alone is Worth the Price of Admission”
  • 25.
    EnvironmentalStats 2.0 (Beta) Version 2.0 (in Beta) Has: – Pull-Down Menus – Power and Sample Size for Lognormal Distribution – Optimal Box-Cox Transformations – Simultaneous Prediction Intervals – Nonparametric von Neumann Test for Serial Correlation
  • 26.
    S-PLUS GIS Users NaturalResources - Amoco, Commonwealth Edison, Hydro Quebec, Kimberly Clark, Koch Industries, Phillip Morris, Weyerhauser, Willamette Industries... Marketing - AC Nielsen, Amazon.com, Canada Post, CTB McGraw Hill, Dairy Queen, JD Powers & Associates, McDonalds, Rand Corporation, Readers Digest, Sears Roebuck & Co, Time Warner … Transportation - Airborne Express, American Airlines, Enterprise Rent A Car, Transport Canada... Government - Centers for Disease Control, Department of Fisheries and Oceans, DOE, EPA, FAA, FCC, FDA, Federal Housing Administration, IRS, NIH, NIST, NOAA, Social Security Admin, US Air Force, US Forest Service, US Geological Survey, SAPD ... Worldwide – NASA, US EPA, USGS, Centres for Disease Control UK – NERC - Centre for Ecology and Hydrology – British Geological Survey, British Antarctic Survey, Macauley Land Use Research Institute, BIOSS, CEFAS, MAFF, Marlab
  • 27.
    EnvironmentalStats Users  GovernmentAgencies – EPA, USGS, etc.  Commercial Consultants – CH2M Hill, Exponent  Academics – Environmental Engineering, Biostatistics, Environmental Health, Mathematics, etc.  Students  People Outside the Environmental Field! – Merck – Lockheed Martin
  • 28.
    Questions Posed  PointPatterns 1 - Random / Clustered - Intensity  Point Patterns 2 - Cross Spectral Analysis  Point Patterns 3 – Mark Correlation Functions  Lattice Data 1 – Spatial Regression Methods for Normal Data  Lattice Data 2 – Spatial Regression Methods for Non-Normal Data  Lattice Data 3 – Spatial Smoothing Methods  Geostatistical Data 1 – Variograms and Kriging  Hybrid Patterns 1 – Cross Spectral Analysis  Hybrid Patterns 2 – Bayesian Hierarchical Models ?
  • 29.
    Live Demo Time! Writing a Presentation on Spatial Statistics  User Input (mostly at a Spatial Conference)  2 Major Advantages …
  • 30.
     Geostatistical Data •Variogram plots and boxplots and clouds • Directional variograms and Correlograms for Exploring Anisotrophy • Empirical Variogram Estimation including Robust Methods • Variogram Models including Spherical and Exponential • Ordinary and Universal Kriging • Block and Point Kriging Prediction at arbitrary Location with Standard Errors • Parametric and Non-parametric Trend Surfaces  Point Patterns • Point Maps that Include Region Boundaries • Spatial Randomness Tests • Ripley’s K-Function • Simultation of Spatial Random Processes • Local Intensity Estimation  Lattice Data • “Binning” of High Density Data into a Regular Lattice of Counts • Geary and Moran Spatial Autocorrelation coefficients • Spatial Regression Models including Conditional and Simultaneous Autoregressive Models • Nearest Neighbour Search • Visualisation of Neighbour Structures 1) S-PLUS GIS Toolbox
  • 31.
    2) It’s inS-PLUS!  Advanced Graphics • Exclusive Trellis Graphics • 3D Plotting and Spinning • Contour Plots • Overlaying Plots • Brush and Spin Environment • Export to Large Number of Formats • Java Graphlets • Imaging Plots • Hexagonal Binning  “S” Language • Powerful Language • Excel Integration • Call from ArcView with Link • Full Visability and Customisation • C, C++, Fortran and Java Connectivity • 100,000 + User Community  Statistics • Cluster Analysis • Tree Models • Advanced Regression • Data Mining Tools • Linear and Non-Linear Mixed Effects • Missing Data
  • 32.
    Now What? For UserManuals (pdf) email rpugh@mathsoft.co.uk Questions?