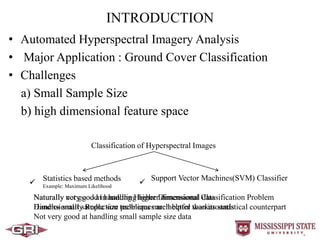
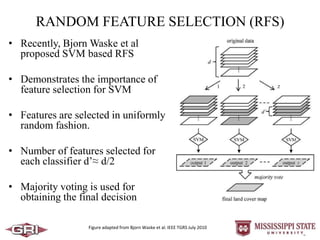
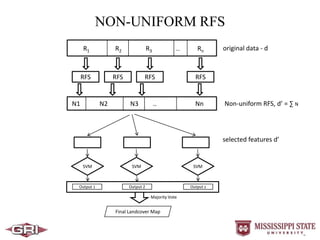
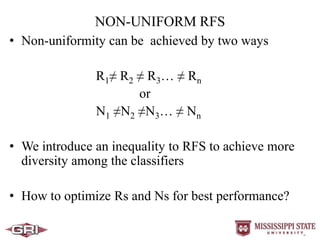
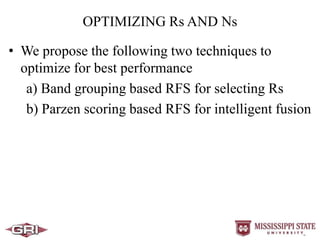
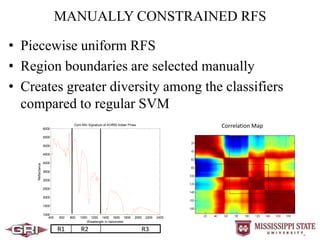
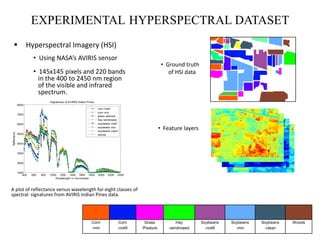
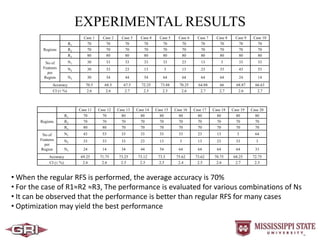
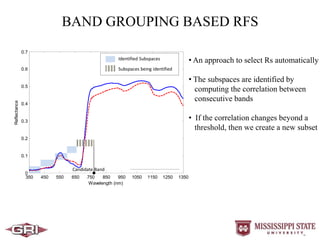
SlideShare a Scribd company logo
AUTOMATED HYPERSPECTRAL IMAGERY
ANALYSIS VIA SUPPORT VECTOR MACHINES
BASED MULTI-CLASSIFIER SYSTEM WITH
NON-UNIFORM RANDOM FEATURE
SELECTION
Sathishkumar Samiappan
Saurabh Prasad
Lori M. Bruce
Mississippi State University
INTRODUCTION
• Automated Hyperspectral Imagery Analysis
• Major Application : Ground Cover Classification
• Challenges
a) Small Sample Size
b) high dimensional feature space
Classification of Hyperspectral Images
Statistics based methods
Example: Maximum Likelihood
Support Vector Machines(SVM) Classifier
Naturally not good at handling Higher Dimensional Classification Problem
Dimensionality Reduction techniques are helpful workarounds
Not very good at handling small sample size data

Naturally very good in handling higher dimensional data
Handles small sample size problems much better than its statistical counterpart

SUPPORT VECTOR MACHINES (SVM)
• SVM is a supervised learning method
• Proposed in the year of 1995 for analyzing data and recognize
patterns
• Popularly used for classification and regression analysis
• SVMs can classify complex data sets in higher dimensional
space by constructing a linear plane
• Inherently good at handling very high dimensional data space
RANDOM FEATURE SELECTION (RFS)
• Recently, Bjorn Waske et al
proposed SVM based RFS
• Demonstrates the importance of
feature selection for SVM
• Features are selected in uniformly
random fashion.
• Number of features selected for
each classifier d’≈ d/2
• Majority voting is used for
obtaining the final decision
Figure adapted from Bjorn Waske et al. IEEE TGRS July 2010
MOTIVATION
• In a Multi Classifier System (MCS) Diversity among the
classifiers can be achieved in two ways
a) Classifiers with different features(RFS)
b) Different classifiers on MCS system
• Considering the nature of the dataset, a non-uniform or
spectrally constrained RFS can provide more diversity
• Based on some initial experiments and with the above
intuition, we believe that, this will open new avenues in
exploring the RFS for hyperspectral data classification
NON-UNIFORM RFS
N1 N2 N3 .. Nn
R1 R2 R3 .. Rn
RFS RFS RFS RFS
SVM SVM SVM
Output 1 Output 2 Output z
Majority Vote
Final Landcover Map
original data - d
Non-uniform RFS, d’ = ∑ N
selected features d’
• Non-uniformity can be achieved by two ways
R1≠ R2 ≠ R3… ≠ Rn
or
N1 ≠N2 ≠N3… ≠ Nn
• We introduce an inequality to RFS to achieve more
diversity among the classifiers
• How to optimize Rs and Ns for best performance?
NON-UNIFORM RFS
OPTIMIZING Rs AND Ns
• We propose the following two techniques to
optimize for best performance
a) Band grouping based RFS for selecting Rs
b) Parzen scoring based RFS for intelligent fusion
MANUALLY CONSTRAINED RFS
• Piecewise uniform RFS
• Region boundaries are selected manually
• Creates greater diversity among the classifiers
compared to regular SVM
400 600 800 1000 1200 1400 1600 1800 2000 2200 2400
1000
1500
2000
2500
3000
3500
4000
4500
5000
5500
6000
Wavelength in nanometer
Reflectance
Corn Min Signature of AVIRIS Indian Pines
R1 R2 R3
Correlation Map
EXPERIMENTAL HYPERSPECTRAL DATASET
 Hyperspectral Imagery (HSI)
• Using NASA’s AVIRIS sensor
• 145x145 pixels and 220 bands
in the 400 to 2450 nm region
of the visible and infrared
spectrum.
400 600 800 1000 1200 1400 1600 1800 2000 2200 2400
1000
2000
3000
4000
5000
6000
7000
8000
Wavelength in micrometer
Reflectance
Signatures of AVIRIS Indian Pines
corn notill
corn min
grass pasture
hay windrowed
soybeans notill
soybeans min
soybeans clean
woods
A plot of reflectance versus wavelength for eight classes of
spectral signatures from AVIRIS Indian Pines data.
• Ground truth
of HSI data
20 40 60 80 100 120 140
20
40
60
80
100
120
140
20 40 60 80 100 120 140
20
40
60
80
100
120
140
20 40 60 80 100 120 140
20
40
60
80
100
120
140 20 40 60 80 100 120 140
20
40
60
80
100
120
140
• Feature layers
Corn
-min
Corn
-notill
Grass
/Pasture
Hay
-windrowed
Soybeans
-notill
Soybeans
-min
Soybeans
-clean
Woods
20 40 60 80 100 120 140
20
40
60
80
100
120
140
EXPERIMENTAL RESULTS
Case 1 Case 2 Case 3 Case 4 Case 5 Case 6 Case 7 Case 8 Case 9 Case 10
Regions
R1 70 70 70 70 70 70 70 70 70 70
R2 70 70 70 70 70 70 70 70 70 70
R3 80 80 80 80 80 80 80 80 80 80
No of
Features
per
Region
N1 30 33 33 33 33 23 13 3 33 33
N2 30 33 23 13 3 13 23 33 43 53
N3 30 34 44 54 64 64 64 64 24 14
Accuracy 70.5 68.5 67.5 72.25 73.88 70.25 64.88 66 68.87 66.63
CI (± %) 2.6 2.6 2.7 2.5 2.5 2.6 2.7 2.7 2.6 2.7
Case 11 Case 12 Case 13 Case 14 Case 15 Case 16 Case 17 Case 18 Case 19 Case 20
Regions
R1 70 70 80 80 80 80 80 80 80 80
R2 70 70 70 70 70 70 70 70 70 70
R3 80 80 70 70 70 70 70 70 70 70
No of
Features
per
Region
N1 43 53 33 33 33 33 23 13 3 64
N2 33 33 33 23 13 3 13 23 33 3
N3 24 14 34 44 54 64 64 64 64 33
Accuracy 69.25 71.75 73.25 73.12 73.5 75.62 73.62 70.75 68.25 72.75
CI (± %) 2.6 2.6 2.5 2.5 2.5 2.4 2.5 2.6 2.7 2.5
• When the regular RFS is performed, the average accuracy is 70%
• For the case of R1≈R2 ≈R3, The performance is evaluated for various combinations of Ns
• It can be observed that the performance is better than regular RFS for many cases
• Optimization may yield the best performance
BAND GROUPING BASED RFS
350 450 550 650 750 850 950 1050 1150 1250 1350
0
0.1
0.2
0.3
0.4
0.5
0.6
0.7
Wavelength (nm)
Reflectance
Cotton
Johnsongrass
Candidate Band
Identified Subspaces
Subspaces being identified
• An approach to select Rs automatically
• The subspaces are identified by
computing the correlation between
consecutive bands
• If the correlation changes beyond a
threshold, then we create a new subset
EXPERIMENTAL RESULTS
Case 1 Case 2 Case 3 Case 4 Case 5 Case 6 Case 7 Case 8 Case 9 Case 10
Regions
R1 72 72 72 72 72 72 72 72 72 72
R2 73 73 73 73 73 73 73 73 73 73
R3 76 76 76 76 76 76 76 76 76 76
No of
Features
per
Region
N1 63 23 53 23 43 33 33 3 23 33
N2 23 23 23 43 33 33 13 33 13 43
N3 14 54 24 34 34 34 54 64 64 24
Accuracy 73.12 75.88 71.75 70 70.25 71.25 71 74.5 70.5 68.63
CI (± %) 2.6 2.6 2.7 2.5 2.5 2.6 2.7 2.7 2.6 2.7
Case 1 Case 2 Case 3 Case 4 Case 5 Case 6 Case 7 Case 8 Case 9 Case 10
Regions
R1 50 50 50 50 50 50 50 50 50 50
R2 45 45 45 45 45 45 45 45 45 45
R3 46 46 46 46 46 46 46 46 46 46
R4 79 79 79 79 79 79 79 79 79 79
No of
Features
per
Region
N1 25 25 30 35 35 40 45 40 20 15
N2 25 25 15 10 5 5 5 20 5 10
N3 25 15 15 15 20 15 5 5 20 20
N4 25 40 40 40 40 40 45 35 55 55
Accuracy 69.87 69.13 73 71.38 72.25 72.62 69.75 69.25 71.63 70.35
CI (± %) 2.6 2.6 2.5 2.5 2.5 2.4 2.5 2.6 2.7 2.5
• Band grouping based RFS with unequal and equal Rs and Ns
• When the regular RFS is performed, the average accuracy is 70%
• The results are shown for splitting the feature vector into 3 and 4 regions respectively
PARZEN SCORING BASED RFS
Considering the kernel function(unit step) defined by (1),
Probability Distribution for a class ωi can be computed by (2)
The separation between the classes ωi and ωj can be defined by (3)
The separation between the classes ωi and a class group Ω can be defined by (3)
PARZEN SCORING BASED RFS
Data train
d
Fusion
Non-
Uniform RFS
Non-
Uniform RFS
Non-
Uniform RFS
SVM
Expert 1
Estimate
Density
Compute
Class Score
SVM
Expert 2
Estimate
Density
Compute
Class Score
SVM
Expert z
Estimate
Density
Compute
Class Score
….
EXPERIMENTAL RESULTS
• The class scores are used to replicate the class labels
based on their rank
• Preliminary results with this approach are very
encouraging.
• The table shows the average accuracies across
different methods of RFS
Regular RFS Non-Uniform RFS
Parzen Scoring based
Non-Uniform RFS
70 73.25 85.79
DISCUSSION
• The performance of SVMs on hyperspectral images can be
improved by feature selection
• In a Multi-Classifier set up, diversity can be achieved by Non-
Uniform RFS
• The number of regions (Rs) and the number of features (Ns)
need to be estimated via tuning
• Band grouping can be used to select Rs automatically. We are
working on a scheme to estimate the optimal Ns in an
automated way
• Parzen density based scoring offers a better performance by
fusing the class decisions intelligently
Thank you
Queries?
Sathishkumar Samiappan
sathish@gri.msstate.edu

More Related Content

Similar to Non-Uniform Random Feature Selection and Kernel Density Scoring With SVM Based Ensemble Classification for Hyperspectral Image Analysis

IAA-LA2-10-01 Spectral and Radiometric Calibration Procedure for a SWIR Hyper...
IAA-LA2-10-01 Spectral and Radiometric Calibration Procedure for a SWIR Hyper...IAA-LA2-10-01 Spectral and Radiometric Calibration Procedure for a SWIR Hyper...
IAA-LA2-10-01 Spectral and Radiometric Calibration Procedure for a SWIR Hyper...
Christian Gabriel Gomez
 
Adaptive Hyper-Parameter Tuning for Black-box LiDAR Odometry [IROS2021]
Adaptive Hyper-Parameter Tuning for Black-box LiDAR Odometry [IROS2021]Adaptive Hyper-Parameter Tuning for Black-box LiDAR Odometry [IROS2021]
Adaptive Hyper-Parameter Tuning for Black-box LiDAR Odometry [IROS2021]
KenjiKoide1
 
Chapter 6 image quality in ct
Chapter 6 image quality in ct Chapter 6 image quality in ct
Chapter 6 image quality in ct
Muntaser S.Ahmad
 
2+3D Photography 2017 – INV 7 The 3D Image Capture Moonshot: Managing the Ene...
2+3D Photography 2017 – INV 7 The 3D Image Capture Moonshot: Managing the Ene...2+3D Photography 2017 – INV 7 The 3D Image Capture Moonshot: Managing the Ene...
2+3D Photography 2017 – INV 7 The 3D Image Capture Moonshot: Managing the Ene...
rijksmuseum
 
MAMMOGRAM IMAGE ANALYSIS
MAMMOGRAM IMAGE ANALYSISMAMMOGRAM IMAGE ANALYSIS
MAMMOGRAM IMAGE ANALYSIS
ajayhakkumar
 
lesson 2 digital data acquisition and data processing
lesson 2 digital data acquisition and data processinglesson 2 digital data acquisition and data processing
lesson 2 digital data acquisition and data processing
Mathew John
 
EDGE DETECTION BY MODIFIED OTSU METHOD
EDGE DETECTION BY MODIFIED OTSU METHOD EDGE DETECTION BY MODIFIED OTSU METHOD
EDGE DETECTION BY MODIFIED OTSU METHOD
cscpconf
 
Edge detection by modified otsu method
Edge detection by modified otsu methodEdge detection by modified otsu method
Edge detection by modified otsu method
csandit
 
Comparing Landsat ETM+ imagery with LiDAR data
Comparing Landsat ETM+ imagery with LiDAR dataComparing Landsat ETM+ imagery with LiDAR data
Comparing Landsat ETM+ imagery with LiDAR data
lbross
 
IFPRI-Role of technology in PMFBY-SS Ray
IFPRI-Role of technology in PMFBY-SS RayIFPRI-Role of technology in PMFBY-SS Ray
IFPRI-Role of technology in PMFBY-SS Ray
International Food Policy Research Institute- South Asia Office
 
Trackster Pruning at the CMS High-Granularity Calorimeter
Trackster Pruning at the CMS High-Granularity CalorimeterTrackster Pruning at the CMS High-Granularity Calorimeter
Trackster Pruning at the CMS High-Granularity Calorimeter
Yousef Fadila
 
Navigation Control of Agent Automobiles Using Wireless Sensor Network
Navigation Control of Agent Automobiles Using Wireless Sensor NetworkNavigation Control of Agent Automobiles Using Wireless Sensor Network
Navigation Control of Agent Automobiles Using Wireless Sensor Network
Mohammad Samadi Gharajeh
 
2023_ASPRS_LiDAR_Division_Update.pdf
2023_ASPRS_LiDAR_Division_Update.pdf2023_ASPRS_LiDAR_Division_Update.pdf
2023_ASPRS_LiDAR_Division_Update.pdf
MattBethel1
 
4_IGARSS11_HRWS.ppt
4_IGARSS11_HRWS.ppt4_IGARSS11_HRWS.ppt
4_IGARSS11_HRWS.pptgrssieee
 
Data Processing Using THEOS Satellite Imagery for Disaster Monitoring (Case S...
Data Processing Using THEOS Satellite Imagery for Disaster Monitoring (Case S...Data Processing Using THEOS Satellite Imagery for Disaster Monitoring (Case S...
Data Processing Using THEOS Satellite Imagery for Disaster Monitoring (Case S...
NopphawanTamkuan
 
Comparison of Segmentation Algorithms and Estimation of Optimal Segmentation ...
Comparison of Segmentation Algorithms and Estimation of Optimal Segmentation ...Comparison of Segmentation Algorithms and Estimation of Optimal Segmentation ...
Comparison of Segmentation Algorithms and Estimation of Optimal Segmentation ...
Pinaki Ranjan Sarkar
 
Nonlinear dimension reduction
Nonlinear dimension reductionNonlinear dimension reduction
Nonlinear dimension reduction
Yan Xu
 
Automatic Visualization
Automatic VisualizationAutomatic Visualization
Automatic Visualization
Sri Ambati
 
Angstrom advanced ADX 2500 X-ray diffraction instrument
Angstrom advanced ADX 2500 X-ray diffraction instrumentAngstrom advanced ADX 2500 X-ray diffraction instrument
Angstrom advanced ADX 2500 X-ray diffraction instrument
Angstrom Advanced
 

Similar to Non-Uniform Random Feature Selection and Kernel Density Scoring With SVM Based Ensemble Classification for Hyperspectral Image Analysis (20)

IAA-LA2-10-01 Spectral and Radiometric Calibration Procedure for a SWIR Hyper...
IAA-LA2-10-01 Spectral and Radiometric Calibration Procedure for a SWIR Hyper...IAA-LA2-10-01 Spectral and Radiometric Calibration Procedure for a SWIR Hyper...
IAA-LA2-10-01 Spectral and Radiometric Calibration Procedure for a SWIR Hyper...
 
Adaptive Hyper-Parameter Tuning for Black-box LiDAR Odometry [IROS2021]
Adaptive Hyper-Parameter Tuning for Black-box LiDAR Odometry [IROS2021]Adaptive Hyper-Parameter Tuning for Black-box LiDAR Odometry [IROS2021]
Adaptive Hyper-Parameter Tuning for Black-box LiDAR Odometry [IROS2021]
 
Chapter 6 image quality in ct
Chapter 6 image quality in ct Chapter 6 image quality in ct
Chapter 6 image quality in ct
 
2+3D Photography 2017 – INV 7 The 3D Image Capture Moonshot: Managing the Ene...
2+3D Photography 2017 – INV 7 The 3D Image Capture Moonshot: Managing the Ene...2+3D Photography 2017 – INV 7 The 3D Image Capture Moonshot: Managing the Ene...
2+3D Photography 2017 – INV 7 The 3D Image Capture Moonshot: Managing the Ene...
 
MAMMOGRAM IMAGE ANALYSIS
MAMMOGRAM IMAGE ANALYSISMAMMOGRAM IMAGE ANALYSIS
MAMMOGRAM IMAGE ANALYSIS
 
lesson 2 digital data acquisition and data processing
lesson 2 digital data acquisition and data processinglesson 2 digital data acquisition and data processing
lesson 2 digital data acquisition and data processing
 
EDGE DETECTION BY MODIFIED OTSU METHOD
EDGE DETECTION BY MODIFIED OTSU METHOD EDGE DETECTION BY MODIFIED OTSU METHOD
EDGE DETECTION BY MODIFIED OTSU METHOD
 
Edge detection by modified otsu method
Edge detection by modified otsu methodEdge detection by modified otsu method
Edge detection by modified otsu method
 
Comparing Landsat ETM+ imagery with LiDAR data
Comparing Landsat ETM+ imagery with LiDAR dataComparing Landsat ETM+ imagery with LiDAR data
Comparing Landsat ETM+ imagery with LiDAR data
 
LiDAR_Project
LiDAR_ProjectLiDAR_Project
LiDAR_Project
 
IFPRI-Role of technology in PMFBY-SS Ray
IFPRI-Role of technology in PMFBY-SS RayIFPRI-Role of technology in PMFBY-SS Ray
IFPRI-Role of technology in PMFBY-SS Ray
 
Trackster Pruning at the CMS High-Granularity Calorimeter
Trackster Pruning at the CMS High-Granularity CalorimeterTrackster Pruning at the CMS High-Granularity Calorimeter
Trackster Pruning at the CMS High-Granularity Calorimeter
 
Navigation Control of Agent Automobiles Using Wireless Sensor Network
Navigation Control of Agent Automobiles Using Wireless Sensor NetworkNavigation Control of Agent Automobiles Using Wireless Sensor Network
Navigation Control of Agent Automobiles Using Wireless Sensor Network
 
2023_ASPRS_LiDAR_Division_Update.pdf
2023_ASPRS_LiDAR_Division_Update.pdf2023_ASPRS_LiDAR_Division_Update.pdf
2023_ASPRS_LiDAR_Division_Update.pdf
 
4_IGARSS11_HRWS.ppt
4_IGARSS11_HRWS.ppt4_IGARSS11_HRWS.ppt
4_IGARSS11_HRWS.ppt
 
Data Processing Using THEOS Satellite Imagery for Disaster Monitoring (Case S...
Data Processing Using THEOS Satellite Imagery for Disaster Monitoring (Case S...Data Processing Using THEOS Satellite Imagery for Disaster Monitoring (Case S...
Data Processing Using THEOS Satellite Imagery for Disaster Monitoring (Case S...
 
Comparison of Segmentation Algorithms and Estimation of Optimal Segmentation ...
Comparison of Segmentation Algorithms and Estimation of Optimal Segmentation ...Comparison of Segmentation Algorithms and Estimation of Optimal Segmentation ...
Comparison of Segmentation Algorithms and Estimation of Optimal Segmentation ...
 
Nonlinear dimension reduction
Nonlinear dimension reductionNonlinear dimension reduction
Nonlinear dimension reduction
 
Automatic Visualization
Automatic VisualizationAutomatic Visualization
Automatic Visualization
 
Angstrom advanced ADX 2500 X-ray diffraction instrument
Angstrom advanced ADX 2500 X-ray diffraction instrumentAngstrom advanced ADX 2500 X-ray diffraction instrument
Angstrom advanced ADX 2500 X-ray diffraction instrument
 

Recently uploaded

Knowledge engineering: from people to machines and back
Knowledge engineering: from people to machines and backKnowledge engineering: from people to machines and back
Knowledge engineering: from people to machines and back
Elena Simperl
 
The Art of the Pitch: WordPress Relationships and Sales
The Art of the Pitch: WordPress Relationships and SalesThe Art of the Pitch: WordPress Relationships and Sales
The Art of the Pitch: WordPress Relationships and Sales
Laura Byrne
 
Designing Great Products: The Power of Design and Leadership by Chief Designe...
Designing Great Products: The Power of Design and Leadership by Chief Designe...Designing Great Products: The Power of Design and Leadership by Chief Designe...
Designing Great Products: The Power of Design and Leadership by Chief Designe...
Product School
 
JMeter webinar - integration with InfluxDB and Grafana
JMeter webinar - integration with InfluxDB and GrafanaJMeter webinar - integration with InfluxDB and Grafana
JMeter webinar - integration with InfluxDB and Grafana
RTTS
 
AI for Every Business: Unlocking Your Product's Universal Potential by VP of ...
AI for Every Business: Unlocking Your Product's Universal Potential by VP of ...AI for Every Business: Unlocking Your Product's Universal Potential by VP of ...
AI for Every Business: Unlocking Your Product's Universal Potential by VP of ...
Product School
 
PHP Frameworks: I want to break free (IPC Berlin 2024)
PHP Frameworks: I want to break free (IPC Berlin 2024)PHP Frameworks: I want to break free (IPC Berlin 2024)
PHP Frameworks: I want to break free (IPC Berlin 2024)
Ralf Eggert
 
GDG Cloud Southlake #33: Boule & Rebala: Effective AppSec in SDLC using Deplo...
GDG Cloud Southlake #33: Boule & Rebala: Effective AppSec in SDLC using Deplo...GDG Cloud Southlake #33: Boule & Rebala: Effective AppSec in SDLC using Deplo...
GDG Cloud Southlake #33: Boule & Rebala: Effective AppSec in SDLC using Deplo...
James Anderson
 
ODC, Data Fabric and Architecture User Group
ODC, Data Fabric and Architecture User GroupODC, Data Fabric and Architecture User Group
ODC, Data Fabric and Architecture User Group
CatarinaPereira64715
 
"Impact of front-end architecture on development cost", Viktor Turskyi
"Impact of front-end architecture on development cost", Viktor Turskyi"Impact of front-end architecture on development cost", Viktor Turskyi
"Impact of front-end architecture on development cost", Viktor Turskyi
Fwdays
 
FIDO Alliance Osaka Seminar: Passkeys and the Road Ahead.pdf
FIDO Alliance Osaka Seminar: Passkeys and the Road Ahead.pdfFIDO Alliance Osaka Seminar: Passkeys and the Road Ahead.pdf
FIDO Alliance Osaka Seminar: Passkeys and the Road Ahead.pdf
FIDO Alliance
 
Key Trends Shaping the Future of Infrastructure.pdf
Key Trends Shaping the Future of Infrastructure.pdfKey Trends Shaping the Future of Infrastructure.pdf
Key Trends Shaping the Future of Infrastructure.pdf
Cheryl Hung
 
From Daily Decisions to Bottom Line: Connecting Product Work to Revenue by VP...
From Daily Decisions to Bottom Line: Connecting Product Work to Revenue by VP...From Daily Decisions to Bottom Line: Connecting Product Work to Revenue by VP...
From Daily Decisions to Bottom Line: Connecting Product Work to Revenue by VP...
Product School
 
Kubernetes & AI - Beauty and the Beast !?! @KCD Istanbul 2024
Kubernetes & AI - Beauty and the Beast !?! @KCD Istanbul 2024Kubernetes & AI - Beauty and the Beast !?! @KCD Istanbul 2024
Kubernetes & AI - Beauty and the Beast !?! @KCD Istanbul 2024
Tobias Schneck
 
Search and Society: Reimagining Information Access for Radical Futures
Search and Society: Reimagining Information Access for Radical FuturesSearch and Society: Reimagining Information Access for Radical Futures
Search and Society: Reimagining Information Access for Radical Futures
Bhaskar Mitra
 
UiPath Test Automation using UiPath Test Suite series, part 4
UiPath Test Automation using UiPath Test Suite series, part 4UiPath Test Automation using UiPath Test Suite series, part 4
UiPath Test Automation using UiPath Test Suite series, part 4
DianaGray10
 
Connector Corner: Automate dynamic content and events by pushing a button
Connector Corner: Automate dynamic content and events by pushing a buttonConnector Corner: Automate dynamic content and events by pushing a button
Connector Corner: Automate dynamic content and events by pushing a button
DianaGray10
 
Assuring Contact Center Experiences for Your Customers With ThousandEyes
Assuring Contact Center Experiences for Your Customers With ThousandEyesAssuring Contact Center Experiences for Your Customers With ThousandEyes
Assuring Contact Center Experiences for Your Customers With ThousandEyes
ThousandEyes
 
Dev Dives: Train smarter, not harder – active learning and UiPath LLMs for do...
Dev Dives: Train smarter, not harder – active learning and UiPath LLMs for do...Dev Dives: Train smarter, not harder – active learning and UiPath LLMs for do...
Dev Dives: Train smarter, not harder – active learning and UiPath LLMs for do...
UiPathCommunity
 
Empowering NextGen Mobility via Large Action Model Infrastructure (LAMI): pav...
Empowering NextGen Mobility via Large Action Model Infrastructure (LAMI): pav...Empowering NextGen Mobility via Large Action Model Infrastructure (LAMI): pav...
Empowering NextGen Mobility via Large Action Model Infrastructure (LAMI): pav...
Thierry Lestable
 
LF Energy Webinar: Electrical Grid Modelling and Simulation Through PowSyBl -...
LF Energy Webinar: Electrical Grid Modelling and Simulation Through PowSyBl -...LF Energy Webinar: Electrical Grid Modelling and Simulation Through PowSyBl -...
LF Energy Webinar: Electrical Grid Modelling and Simulation Through PowSyBl -...
DanBrown980551
 

Recently uploaded (20)

Knowledge engineering: from people to machines and back
Knowledge engineering: from people to machines and backKnowledge engineering: from people to machines and back
Knowledge engineering: from people to machines and back
 
The Art of the Pitch: WordPress Relationships and Sales
The Art of the Pitch: WordPress Relationships and SalesThe Art of the Pitch: WordPress Relationships and Sales
The Art of the Pitch: WordPress Relationships and Sales
 
Designing Great Products: The Power of Design and Leadership by Chief Designe...
Designing Great Products: The Power of Design and Leadership by Chief Designe...Designing Great Products: The Power of Design and Leadership by Chief Designe...
Designing Great Products: The Power of Design and Leadership by Chief Designe...
 
JMeter webinar - integration with InfluxDB and Grafana
JMeter webinar - integration with InfluxDB and GrafanaJMeter webinar - integration with InfluxDB and Grafana
JMeter webinar - integration with InfluxDB and Grafana
 
AI for Every Business: Unlocking Your Product's Universal Potential by VP of ...
AI for Every Business: Unlocking Your Product's Universal Potential by VP of ...AI for Every Business: Unlocking Your Product's Universal Potential by VP of ...
AI for Every Business: Unlocking Your Product's Universal Potential by VP of ...
 
PHP Frameworks: I want to break free (IPC Berlin 2024)
PHP Frameworks: I want to break free (IPC Berlin 2024)PHP Frameworks: I want to break free (IPC Berlin 2024)
PHP Frameworks: I want to break free (IPC Berlin 2024)
 
GDG Cloud Southlake #33: Boule & Rebala: Effective AppSec in SDLC using Deplo...
GDG Cloud Southlake #33: Boule & Rebala: Effective AppSec in SDLC using Deplo...GDG Cloud Southlake #33: Boule & Rebala: Effective AppSec in SDLC using Deplo...
GDG Cloud Southlake #33: Boule & Rebala: Effective AppSec in SDLC using Deplo...
 
ODC, Data Fabric and Architecture User Group
ODC, Data Fabric and Architecture User GroupODC, Data Fabric and Architecture User Group
ODC, Data Fabric and Architecture User Group
 
"Impact of front-end architecture on development cost", Viktor Turskyi
"Impact of front-end architecture on development cost", Viktor Turskyi"Impact of front-end architecture on development cost", Viktor Turskyi
"Impact of front-end architecture on development cost", Viktor Turskyi
 
FIDO Alliance Osaka Seminar: Passkeys and the Road Ahead.pdf
FIDO Alliance Osaka Seminar: Passkeys and the Road Ahead.pdfFIDO Alliance Osaka Seminar: Passkeys and the Road Ahead.pdf
FIDO Alliance Osaka Seminar: Passkeys and the Road Ahead.pdf
 
Key Trends Shaping the Future of Infrastructure.pdf
Key Trends Shaping the Future of Infrastructure.pdfKey Trends Shaping the Future of Infrastructure.pdf
Key Trends Shaping the Future of Infrastructure.pdf
 
From Daily Decisions to Bottom Line: Connecting Product Work to Revenue by VP...
From Daily Decisions to Bottom Line: Connecting Product Work to Revenue by VP...From Daily Decisions to Bottom Line: Connecting Product Work to Revenue by VP...
From Daily Decisions to Bottom Line: Connecting Product Work to Revenue by VP...
 
Kubernetes & AI - Beauty and the Beast !?! @KCD Istanbul 2024
Kubernetes & AI - Beauty and the Beast !?! @KCD Istanbul 2024Kubernetes & AI - Beauty and the Beast !?! @KCD Istanbul 2024
Kubernetes & AI - Beauty and the Beast !?! @KCD Istanbul 2024
 
Search and Society: Reimagining Information Access for Radical Futures
Search and Society: Reimagining Information Access for Radical FuturesSearch and Society: Reimagining Information Access for Radical Futures
Search and Society: Reimagining Information Access for Radical Futures
 
UiPath Test Automation using UiPath Test Suite series, part 4
UiPath Test Automation using UiPath Test Suite series, part 4UiPath Test Automation using UiPath Test Suite series, part 4
UiPath Test Automation using UiPath Test Suite series, part 4
 
Connector Corner: Automate dynamic content and events by pushing a button
Connector Corner: Automate dynamic content and events by pushing a buttonConnector Corner: Automate dynamic content and events by pushing a button
Connector Corner: Automate dynamic content and events by pushing a button
 
Assuring Contact Center Experiences for Your Customers With ThousandEyes
Assuring Contact Center Experiences for Your Customers With ThousandEyesAssuring Contact Center Experiences for Your Customers With ThousandEyes
Assuring Contact Center Experiences for Your Customers With ThousandEyes
 
Dev Dives: Train smarter, not harder – active learning and UiPath LLMs for do...
Dev Dives: Train smarter, not harder – active learning and UiPath LLMs for do...Dev Dives: Train smarter, not harder – active learning and UiPath LLMs for do...
Dev Dives: Train smarter, not harder – active learning and UiPath LLMs for do...
 
Empowering NextGen Mobility via Large Action Model Infrastructure (LAMI): pav...
Empowering NextGen Mobility via Large Action Model Infrastructure (LAMI): pav...Empowering NextGen Mobility via Large Action Model Infrastructure (LAMI): pav...
Empowering NextGen Mobility via Large Action Model Infrastructure (LAMI): pav...
 
LF Energy Webinar: Electrical Grid Modelling and Simulation Through PowSyBl -...
LF Energy Webinar: Electrical Grid Modelling and Simulation Through PowSyBl -...LF Energy Webinar: Electrical Grid Modelling and Simulation Through PowSyBl -...
LF Energy Webinar: Electrical Grid Modelling and Simulation Through PowSyBl -...
 

Non-Uniform Random Feature Selection and Kernel Density Scoring With SVM Based Ensemble Classification for Hyperspectral Image Analysis

  • 1. AUTOMATED HYPERSPECTRAL IMAGERY ANALYSIS VIA SUPPORT VECTOR MACHINES BASED MULTI-CLASSIFIER SYSTEM WITH NON-UNIFORM RANDOM FEATURE SELECTION Sathishkumar Samiappan Saurabh Prasad Lori M. Bruce Mississippi State University
  • 2. INTRODUCTION • Automated Hyperspectral Imagery Analysis • Major Application : Ground Cover Classification • Challenges a) Small Sample Size b) high dimensional feature space Classification of Hyperspectral Images Statistics based methods Example: Maximum Likelihood Support Vector Machines(SVM) Classifier Naturally not good at handling Higher Dimensional Classification Problem Dimensionality Reduction techniques are helpful workarounds Not very good at handling small sample size data  Naturally very good in handling higher dimensional data Handles small sample size problems much better than its statistical counterpart 
  • 3. SUPPORT VECTOR MACHINES (SVM) • SVM is a supervised learning method • Proposed in the year of 1995 for analyzing data and recognize patterns • Popularly used for classification and regression analysis • SVMs can classify complex data sets in higher dimensional space by constructing a linear plane • Inherently good at handling very high dimensional data space
  • 4. RANDOM FEATURE SELECTION (RFS) • Recently, Bjorn Waske et al proposed SVM based RFS • Demonstrates the importance of feature selection for SVM • Features are selected in uniformly random fashion. • Number of features selected for each classifier d’≈ d/2 • Majority voting is used for obtaining the final decision Figure adapted from Bjorn Waske et al. IEEE TGRS July 2010
  • 5. MOTIVATION • In a Multi Classifier System (MCS) Diversity among the classifiers can be achieved in two ways a) Classifiers with different features(RFS) b) Different classifiers on MCS system • Considering the nature of the dataset, a non-uniform or spectrally constrained RFS can provide more diversity • Based on some initial experiments and with the above intuition, we believe that, this will open new avenues in exploring the RFS for hyperspectral data classification
  • 6. NON-UNIFORM RFS N1 N2 N3 .. Nn R1 R2 R3 .. Rn RFS RFS RFS RFS SVM SVM SVM Output 1 Output 2 Output z Majority Vote Final Landcover Map original data - d Non-uniform RFS, d’ = ∑ N selected features d’
  • 7. • Non-uniformity can be achieved by two ways R1≠ R2 ≠ R3… ≠ Rn or N1 ≠N2 ≠N3… ≠ Nn • We introduce an inequality to RFS to achieve more diversity among the classifiers • How to optimize Rs and Ns for best performance? NON-UNIFORM RFS
  • 8. OPTIMIZING Rs AND Ns • We propose the following two techniques to optimize for best performance a) Band grouping based RFS for selecting Rs b) Parzen scoring based RFS for intelligent fusion
  • 9. MANUALLY CONSTRAINED RFS • Piecewise uniform RFS • Region boundaries are selected manually • Creates greater diversity among the classifiers compared to regular SVM 400 600 800 1000 1200 1400 1600 1800 2000 2200 2400 1000 1500 2000 2500 3000 3500 4000 4500 5000 5500 6000 Wavelength in nanometer Reflectance Corn Min Signature of AVIRIS Indian Pines R1 R2 R3 Correlation Map
  • 10. EXPERIMENTAL HYPERSPECTRAL DATASET  Hyperspectral Imagery (HSI) • Using NASA’s AVIRIS sensor • 145x145 pixels and 220 bands in the 400 to 2450 nm region of the visible and infrared spectrum. 400 600 800 1000 1200 1400 1600 1800 2000 2200 2400 1000 2000 3000 4000 5000 6000 7000 8000 Wavelength in micrometer Reflectance Signatures of AVIRIS Indian Pines corn notill corn min grass pasture hay windrowed soybeans notill soybeans min soybeans clean woods A plot of reflectance versus wavelength for eight classes of spectral signatures from AVIRIS Indian Pines data. • Ground truth of HSI data 20 40 60 80 100 120 140 20 40 60 80 100 120 140 20 40 60 80 100 120 140 20 40 60 80 100 120 140 20 40 60 80 100 120 140 20 40 60 80 100 120 140 20 40 60 80 100 120 140 20 40 60 80 100 120 140 • Feature layers Corn -min Corn -notill Grass /Pasture Hay -windrowed Soybeans -notill Soybeans -min Soybeans -clean Woods 20 40 60 80 100 120 140 20 40 60 80 100 120 140
  • 11. EXPERIMENTAL RESULTS Case 1 Case 2 Case 3 Case 4 Case 5 Case 6 Case 7 Case 8 Case 9 Case 10 Regions R1 70 70 70 70 70 70 70 70 70 70 R2 70 70 70 70 70 70 70 70 70 70 R3 80 80 80 80 80 80 80 80 80 80 No of Features per Region N1 30 33 33 33 33 23 13 3 33 33 N2 30 33 23 13 3 13 23 33 43 53 N3 30 34 44 54 64 64 64 64 24 14 Accuracy 70.5 68.5 67.5 72.25 73.88 70.25 64.88 66 68.87 66.63 CI (± %) 2.6 2.6 2.7 2.5 2.5 2.6 2.7 2.7 2.6 2.7 Case 11 Case 12 Case 13 Case 14 Case 15 Case 16 Case 17 Case 18 Case 19 Case 20 Regions R1 70 70 80 80 80 80 80 80 80 80 R2 70 70 70 70 70 70 70 70 70 70 R3 80 80 70 70 70 70 70 70 70 70 No of Features per Region N1 43 53 33 33 33 33 23 13 3 64 N2 33 33 33 23 13 3 13 23 33 3 N3 24 14 34 44 54 64 64 64 64 33 Accuracy 69.25 71.75 73.25 73.12 73.5 75.62 73.62 70.75 68.25 72.75 CI (± %) 2.6 2.6 2.5 2.5 2.5 2.4 2.5 2.6 2.7 2.5 • When the regular RFS is performed, the average accuracy is 70% • For the case of R1≈R2 ≈R3, The performance is evaluated for various combinations of Ns • It can be observed that the performance is better than regular RFS for many cases • Optimization may yield the best performance
  • 12. BAND GROUPING BASED RFS 350 450 550 650 750 850 950 1050 1150 1250 1350 0 0.1 0.2 0.3 0.4 0.5 0.6 0.7 Wavelength (nm) Reflectance Cotton Johnsongrass Candidate Band Identified Subspaces Subspaces being identified • An approach to select Rs automatically • The subspaces are identified by computing the correlation between consecutive bands • If the correlation changes beyond a threshold, then we create a new subset
  • 13. EXPERIMENTAL RESULTS Case 1 Case 2 Case 3 Case 4 Case 5 Case 6 Case 7 Case 8 Case 9 Case 10 Regions R1 72 72 72 72 72 72 72 72 72 72 R2 73 73 73 73 73 73 73 73 73 73 R3 76 76 76 76 76 76 76 76 76 76 No of Features per Region N1 63 23 53 23 43 33 33 3 23 33 N2 23 23 23 43 33 33 13 33 13 43 N3 14 54 24 34 34 34 54 64 64 24 Accuracy 73.12 75.88 71.75 70 70.25 71.25 71 74.5 70.5 68.63 CI (± %) 2.6 2.6 2.7 2.5 2.5 2.6 2.7 2.7 2.6 2.7 Case 1 Case 2 Case 3 Case 4 Case 5 Case 6 Case 7 Case 8 Case 9 Case 10 Regions R1 50 50 50 50 50 50 50 50 50 50 R2 45 45 45 45 45 45 45 45 45 45 R3 46 46 46 46 46 46 46 46 46 46 R4 79 79 79 79 79 79 79 79 79 79 No of Features per Region N1 25 25 30 35 35 40 45 40 20 15 N2 25 25 15 10 5 5 5 20 5 10 N3 25 15 15 15 20 15 5 5 20 20 N4 25 40 40 40 40 40 45 35 55 55 Accuracy 69.87 69.13 73 71.38 72.25 72.62 69.75 69.25 71.63 70.35 CI (± %) 2.6 2.6 2.5 2.5 2.5 2.4 2.5 2.6 2.7 2.5 • Band grouping based RFS with unequal and equal Rs and Ns • When the regular RFS is performed, the average accuracy is 70% • The results are shown for splitting the feature vector into 3 and 4 regions respectively
  • 14. PARZEN SCORING BASED RFS Considering the kernel function(unit step) defined by (1), Probability Distribution for a class ωi can be computed by (2) The separation between the classes ωi and ωj can be defined by (3) The separation between the classes ωi and a class group Ω can be defined by (3)
  • 15. PARZEN SCORING BASED RFS Data train d Fusion Non- Uniform RFS Non- Uniform RFS Non- Uniform RFS SVM Expert 1 Estimate Density Compute Class Score SVM Expert 2 Estimate Density Compute Class Score SVM Expert z Estimate Density Compute Class Score ….
  • 16. EXPERIMENTAL RESULTS • The class scores are used to replicate the class labels based on their rank • Preliminary results with this approach are very encouraging. • The table shows the average accuracies across different methods of RFS Regular RFS Non-Uniform RFS Parzen Scoring based Non-Uniform RFS 70 73.25 85.79
  • 17. DISCUSSION • The performance of SVMs on hyperspectral images can be improved by feature selection • In a Multi-Classifier set up, diversity can be achieved by Non- Uniform RFS • The number of regions (Rs) and the number of features (Ns) need to be estimated via tuning • Band grouping can be used to select Rs automatically. We are working on a scheme to estimate the optimal Ns in an automated way • Parzen density based scoring offers a better performance by fusing the class decisions intelligently