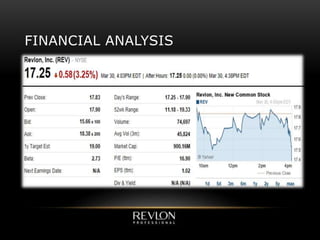
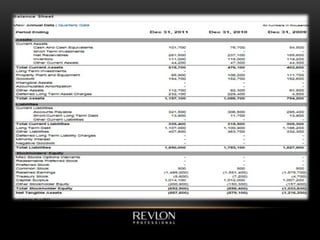
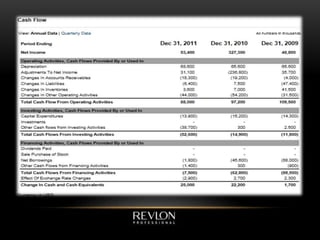
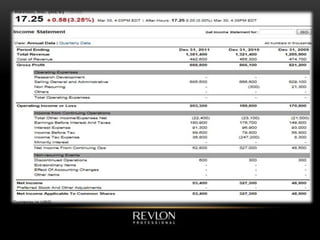
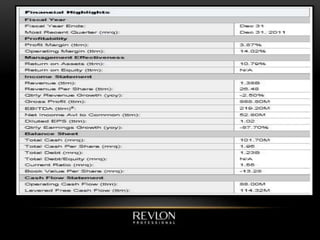
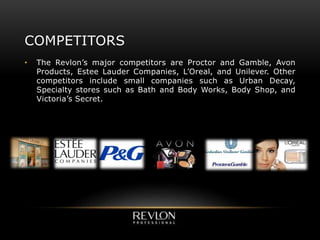
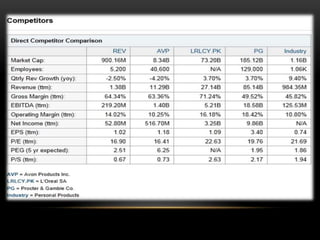
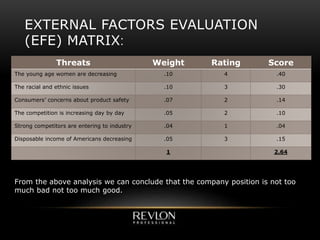
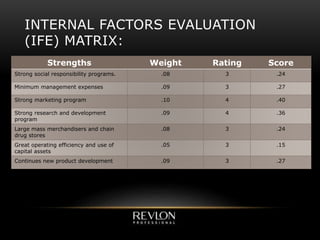
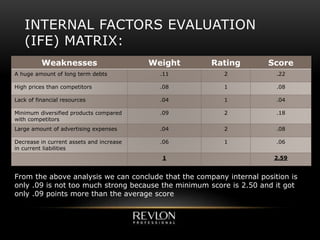
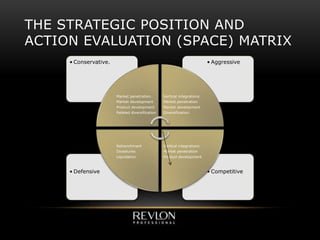
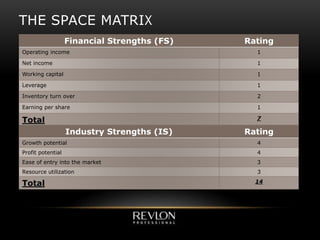
Arab Academy for Science Technology & Maritime Transport
Strategic Management
Prof. Dr. Cherine Soliman
Presented by:
Sherin Haroun El. Rashied
INDEX
• Part one: Revlon Company
• History
• Product
• Mission statement
• Vision
• Objectives
• Part Two: Situation Analysis
• Competitors
• Competitive Profile Matrix (CPM)
• S.W.O.T. Analysis
• External Factor Evaluation Matrix – EFE Matrix
• Internal Factor Evaluation Matrix – IFE Matrix
• S.W.O.T Matrix
• Part Three: Recommendation & Conclusion
HISTORY
• Revlon was founded in 1932, by Charles Revson and his brother
Joseph, along with a chemist, Charles Lachman, who contributed
the "L" in the REVLON name. Starting with a single product - a
nail enamel unlike any before it - the three founders pooled their
meager resources and developed a unique manufacturing
process.
• In the 1990's, Revlon revitalized its cosmetics business and
strengthened its industry leadership role. Revlon introduced the
first transfer resistant lipcolor which led to a full ColorStayTM
Collection of transfer-resistant products. The company closed the
gap on its closest competitors and reached a dramatic goal - the
#1 brand in mass color cosmetics. Revlon again became a public
company in 1996, listed on the New York Stock Exchange (NYSE:
REV).
PRODUCTS
• COLORSTAY™
• REVLON CUSTOMEYES™
• REVLON SUPER LUSTROUS™
• REVLON PHOTOREADY™
• REVLON AGE DEFYING
• REVLON LUXURIOUS COLOR™
• REVLON GROW LUSCIOUS™
MISSION
• To emerge as the leader in cosmetic and personal care
throughout the world. Revlon takes pride in manufacturing the
top skin care and strives to please young and older woman alike.
VISION
• Revlon Inc. Vision is to satisfy the needs of their customers with
glamour and excitement that they provide at an affordable price.
OBJECTIVES
“In our factory, we make lipstick.
In our advertising, we sell hope.”
~ Charles Revson
Revlon Cosmetics
TRANSLATION OF OBJECTIVE
 Build and leverage our strong brands, particularly
the Revlon brand
 Improve the execution of our strategies and plans,
and provide for continued improvement in our
organizational capability
 Continue to strengthen our international business
 Improve our operating profit margins and cash flow
Presented in the 2007 annual report by Revlon Board of
Directors, and Operating Committee, along with David L.
Kennedy, President and CEO
FINANCIAL ANALYSIS
COMPETITORS
• The Revlon’s major competitors are Proctor and Gamble, Avon
Products, Estee Lauder Companies, L’Oreal, and Unilever. Other
competitors include small companies such as Urban Decay,
Specialty stores such as Bath and Body Works, Body Shop, and
Victoria’s Secret.
EXAMPLE FOR THE DEGREE OF COMPETITION
COMPETITIVE PROFILE MATRIX (CPM)
P&GL’OrealRevlon
Weighted
Score
RatingWeighted
Score
RatingWeighted
Score
RatingWeightCritical Success
Factors
.453.604.453.15Price
.404.404.303.10Financial
Position
.303.404.404.10Consumer
Loyalty
.404.303.303.10Advertising
.404.303.404.10Product Quality
.453.453.453.15Innovation
.303.202.404.10Market Share
.183.183.183.06Management
.604.604.453.15Global
Expansion
3.483.433.331Total
•Cost advantage
•Asset leverage
•Effective communication
•High R&D
•Innovation
•Online growth
•Loyal customers
•Market share leadership
•Strong management team
•Strong brand equity
•Strong financial position
•Supply chain
•Pricing
•Real estate
•Reputation management
•Unique products
•Acquisitions
•Asset leverage
•Financial markets (raise money through debt, etc)
•Emerging markets and expansion abroad
•Innovation
•Online
•Product and services expansion
•Takeover
•Bad communication
•Diseconomies to scale
•Not innovative
•Not diversified
•Poor supply chain
•Weak management team
•Weak real estate
•Weak, damaged brand
•Competition
•Cheaper technology
•Economic slowdown
•External changes (government, politics, taxes, etc)
•Exchange rate fluctuations
•Lower cost competitors or imports
•Maturing categories, products, or services
•Price wars
•Product substitution
EXTERNAL FACTORS EVALUATION
(EFE) MATRIX:
ScoreRatingWeightOpportunities
.484.12The young migrants to America are increasing
.303.10Personal Care products usage is increasing
.182.09Men also using the cosmetic products
.222.11Latin America represents a growth
opportunity
.243.08The older age women entering to the
cosmetic industry
.091.09Women in China, India and Middle East are
rapidly growing Interested in purchasing more
cosmetics
EXTERNAL FACTORS EVALUATION
(EFE) MATRIX:
ScoreRatingWeightThreats
.404.10The young age women are decreasing
.303.10The racial and ethnic issues
.142.07Consumers’ concerns about product safety
.102.05The competition is increasing day by day
.041.04Strong competitors are entering to industry
.153.05Disposable income of Americans decreasing
2.641
From the above analysis we can conclude that the company position is not too
much bad not too much good.
INTERNAL FACTORS EVALUATION
(IFE) MATRIX:
ScoreRatingWeightStrengths
.243.08Strong social responsibility programs.
.273.09Minimum management expenses
.404.10Strong marketing program
.364.09Strong research and development
program
.243.08Large mass merchandisers and chain
drug stores
.153.05Great operating efficiency and use of
capital assets
.273.09Continues new product development
INTERNAL FACTORS EVALUATION
(IFE) MATRIX:
ScoreRatingWeightWeaknesses
.222.11A huge amount of long term debts
.081.08High prices than competitors
.041.04Lack of financial resources
.182.09Minimum diversified products compared
with competitors
.082.04Large amount of advertising expenses
.061.06Decrease in current assets and increase
in current liabilities
2.591
From the above analysis we can conclude that the company internal position is
only .09 is not too much strong because the minimum score is 2.50 and it got
only .09 points more than the average score
THE STRATEGIC POSITION AND
ACTION EVALUATION (SPACE) MATRIX
• Competitive• Defensive
• Aggressive• Conservative.
Market penetration.
Market development
Product development
Related diversification
Vertical integrations
Market penetration
Market development
Diversification.
Vertical integrations
Market penetration
Product development
Retrenchment
Divestures
Liquidation
THE SPACE MATRIX
RatingFinancial Strengths (FS)
1Operating income
1Net income
1Working capital
1Leverage
2Inventory turn over
1Earning per share
7Total
RatingIndustry Strengths (IS)
4Growth potential
4Profit potential
3Ease of entry into the market
3Resource utilization
14Total
THE SPACE MATRIX
RatingEnvironmental Stability (ES)
-5Price elasticity of demand
-4Competitive pressure
-4Demand variability
-5Price range of competing firms
-2Risk involved in business
-20Total
RatingCompetitive Advantage (CA)
-3Control over supplier and distributors
-4Market share
-3Customer loyalty
-4Product life cycle
-3Product price
-17Total
CONCLUSION
• ES average is -20/ 5 = -4.00 IS average is +14/ 4 = +3.50
• CA average is -17/5 = -3.40 FS average is +7/ 6 = +1.17
• x-axes : -3.40 + (+3.50 = +0.10
• y-axes : -4.00 + (+1.17)= -2.83
• From the above analysis and diagram we can conclude that the
best strategy for Revlon is competitive strategy which contains
backward, forward and horizontal integrations, market
penetration, market development, and product development.
High competition
Rapid market growth
THE BOSTON CONSULTING GROUP
(BCG) MATRIX
High growth, High
market share
Low growth, High
market share
High growth, Low
market share
Low growth, Low
market share
The BCG Matrix demonstrates that the company’s is in medium position
relative to the industry market share
CONCLUSION
• market is growing world wide even in America the young
migrants increasing year by year but the competitive position of
Revlon is not strong because the competitors are Proctor &
Gamble, Unilever, Avon Products, Inc’ which is very strong and
have popular brand names. Therefore according to Grand
Strategy Matrix the Revlon lies in quadrant II. According to this
quadrant the Revlon needs strategies like Market development,
Market penetration, Product development, Horizontal integration,
Divestiture, and Liquidation
As we saw in the case study of Revlon which was actually written in 2007 that
the Company is in great troubles. The financial position is also very weak and it
generates losses in the recent years. After applying the tools and techniques of
strategic management our conclusion is as follow.
 The company should develop new markets, which is not tapped by the
competitors.
 The company should improve the quality of products as well as the price
minimization efforts should be taken.
 The company also need to increase sales through increasing marketing
efforts.
 The other strategy option is the integration it may be forward, backward
or horizontal integration.
 The company should sell some unprofitable division.
 The last option is liquidation. If the company fails to follow the above
strategies then it should liquidate the business.
RECOMMENDATIONS

Revlon, inc company

  • 1.
    Arab Academy forScience Technology & Maritime Transport Strategic Management Prof. Dr. Cherine Soliman Presented by: Sherin Haroun El. Rashied
  • 2.
    INDEX • Part one:Revlon Company • History • Product • Mission statement • Vision • Objectives • Part Two: Situation Analysis • Competitors • Competitive Profile Matrix (CPM) • S.W.O.T. Analysis • External Factor Evaluation Matrix – EFE Matrix • Internal Factor Evaluation Matrix – IFE Matrix • S.W.O.T Matrix • Part Three: Recommendation & Conclusion
  • 4.
    HISTORY • Revlon wasfounded in 1932, by Charles Revson and his brother Joseph, along with a chemist, Charles Lachman, who contributed the "L" in the REVLON name. Starting with a single product - a nail enamel unlike any before it - the three founders pooled their meager resources and developed a unique manufacturing process. • In the 1990's, Revlon revitalized its cosmetics business and strengthened its industry leadership role. Revlon introduced the first transfer resistant lipcolor which led to a full ColorStayTM Collection of transfer-resistant products. The company closed the gap on its closest competitors and reached a dramatic goal - the #1 brand in mass color cosmetics. Revlon again became a public company in 1996, listed on the New York Stock Exchange (NYSE: REV).
  • 5.
    PRODUCTS • COLORSTAY™ • REVLONCUSTOMEYES™ • REVLON SUPER LUSTROUS™ • REVLON PHOTOREADY™ • REVLON AGE DEFYING • REVLON LUXURIOUS COLOR™ • REVLON GROW LUSCIOUS™
  • 6.
    MISSION • To emergeas the leader in cosmetic and personal care throughout the world. Revlon takes pride in manufacturing the top skin care and strives to please young and older woman alike.
  • 7.
    VISION • Revlon Inc.Vision is to satisfy the needs of their customers with glamour and excitement that they provide at an affordable price.
  • 8.
    OBJECTIVES “In our factory,we make lipstick. In our advertising, we sell hope.” ~ Charles Revson Revlon Cosmetics
  • 9.
    TRANSLATION OF OBJECTIVE Build and leverage our strong brands, particularly the Revlon brand  Improve the execution of our strategies and plans, and provide for continued improvement in our organizational capability  Continue to strengthen our international business  Improve our operating profit margins and cash flow Presented in the 2007 annual report by Revlon Board of Directors, and Operating Committee, along with David L. Kennedy, President and CEO
  • 11.
  • 16.
    COMPETITORS • The Revlon’smajor competitors are Proctor and Gamble, Avon Products, Estee Lauder Companies, L’Oreal, and Unilever. Other competitors include small companies such as Urban Decay, Specialty stores such as Bath and Body Works, Body Shop, and Victoria’s Secret.
  • 17.
    EXAMPLE FOR THEDEGREE OF COMPETITION
  • 19.
    COMPETITIVE PROFILE MATRIX(CPM) P&GL’OrealRevlon Weighted Score RatingWeighted Score RatingWeighted Score RatingWeightCritical Success Factors .453.604.453.15Price .404.404.303.10Financial Position .303.404.404.10Consumer Loyalty .404.303.303.10Advertising .404.303.404.10Product Quality .453.453.453.15Innovation .303.202.404.10Market Share .183.183.183.06Management .604.604.453.15Global Expansion 3.483.433.331Total
  • 20.
    •Cost advantage •Asset leverage •Effectivecommunication •High R&D •Innovation •Online growth •Loyal customers •Market share leadership •Strong management team •Strong brand equity •Strong financial position •Supply chain •Pricing •Real estate •Reputation management •Unique products •Acquisitions •Asset leverage •Financial markets (raise money through debt, etc) •Emerging markets and expansion abroad •Innovation •Online •Product and services expansion •Takeover •Bad communication •Diseconomies to scale •Not innovative •Not diversified •Poor supply chain •Weak management team •Weak real estate •Weak, damaged brand •Competition •Cheaper technology •Economic slowdown •External changes (government, politics, taxes, etc) •Exchange rate fluctuations •Lower cost competitors or imports •Maturing categories, products, or services •Price wars •Product substitution
  • 21.
    EXTERNAL FACTORS EVALUATION (EFE)MATRIX: ScoreRatingWeightOpportunities .484.12The young migrants to America are increasing .303.10Personal Care products usage is increasing .182.09Men also using the cosmetic products .222.11Latin America represents a growth opportunity .243.08The older age women entering to the cosmetic industry .091.09Women in China, India and Middle East are rapidly growing Interested in purchasing more cosmetics
  • 22.
    EXTERNAL FACTORS EVALUATION (EFE)MATRIX: ScoreRatingWeightThreats .404.10The young age women are decreasing .303.10The racial and ethnic issues .142.07Consumers’ concerns about product safety .102.05The competition is increasing day by day .041.04Strong competitors are entering to industry .153.05Disposable income of Americans decreasing 2.641 From the above analysis we can conclude that the company position is not too much bad not too much good.
  • 23.
    INTERNAL FACTORS EVALUATION (IFE)MATRIX: ScoreRatingWeightStrengths .243.08Strong social responsibility programs. .273.09Minimum management expenses .404.10Strong marketing program .364.09Strong research and development program .243.08Large mass merchandisers and chain drug stores .153.05Great operating efficiency and use of capital assets .273.09Continues new product development
  • 24.
    INTERNAL FACTORS EVALUATION (IFE)MATRIX: ScoreRatingWeightWeaknesses .222.11A huge amount of long term debts .081.08High prices than competitors .041.04Lack of financial resources .182.09Minimum diversified products compared with competitors .082.04Large amount of advertising expenses .061.06Decrease in current assets and increase in current liabilities 2.591 From the above analysis we can conclude that the company internal position is only .09 is not too much strong because the minimum score is 2.50 and it got only .09 points more than the average score
  • 25.
    THE STRATEGIC POSITIONAND ACTION EVALUATION (SPACE) MATRIX • Competitive• Defensive • Aggressive• Conservative. Market penetration. Market development Product development Related diversification Vertical integrations Market penetration Market development Diversification. Vertical integrations Market penetration Product development Retrenchment Divestures Liquidation
  • 26.
    THE SPACE MATRIX RatingFinancialStrengths (FS) 1Operating income 1Net income 1Working capital 1Leverage 2Inventory turn over 1Earning per share 7Total RatingIndustry Strengths (IS) 4Growth potential 4Profit potential 3Ease of entry into the market 3Resource utilization 14Total
  • 27.
    THE SPACE MATRIX RatingEnvironmentalStability (ES) -5Price elasticity of demand -4Competitive pressure -4Demand variability -5Price range of competing firms -2Risk involved in business -20Total RatingCompetitive Advantage (CA) -3Control over supplier and distributors -4Market share -3Customer loyalty -4Product life cycle -3Product price -17Total
  • 28.
    CONCLUSION • ES averageis -20/ 5 = -4.00 IS average is +14/ 4 = +3.50 • CA average is -17/5 = -3.40 FS average is +7/ 6 = +1.17 • x-axes : -3.40 + (+3.50 = +0.10 • y-axes : -4.00 + (+1.17)= -2.83 • From the above analysis and diagram we can conclude that the best strategy for Revlon is competitive strategy which contains backward, forward and horizontal integrations, market penetration, market development, and product development.
  • 29.
  • 30.
    THE BOSTON CONSULTINGGROUP (BCG) MATRIX High growth, High market share Low growth, High market share High growth, Low market share Low growth, Low market share The BCG Matrix demonstrates that the company’s is in medium position relative to the industry market share
  • 32.
    CONCLUSION • market isgrowing world wide even in America the young migrants increasing year by year but the competitive position of Revlon is not strong because the competitors are Proctor & Gamble, Unilever, Avon Products, Inc’ which is very strong and have popular brand names. Therefore according to Grand Strategy Matrix the Revlon lies in quadrant II. According to this quadrant the Revlon needs strategies like Market development, Market penetration, Product development, Horizontal integration, Divestiture, and Liquidation
  • 33.
    As we sawin the case study of Revlon which was actually written in 2007 that the Company is in great troubles. The financial position is also very weak and it generates losses in the recent years. After applying the tools and techniques of strategic management our conclusion is as follow.  The company should develop new markets, which is not tapped by the competitors.  The company should improve the quality of products as well as the price minimization efforts should be taken.  The company also need to increase sales through increasing marketing efforts.  The other strategy option is the integration it may be forward, backward or horizontal integration.  The company should sell some unprofitable division.  The last option is liquidation. If the company fails to follow the above strategies then it should liquidate the business. RECOMMENDATIONS