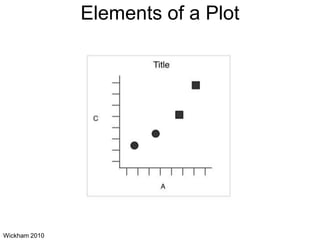
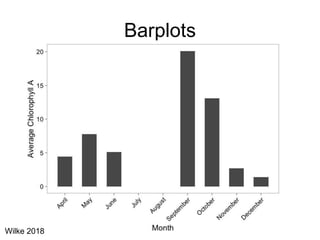
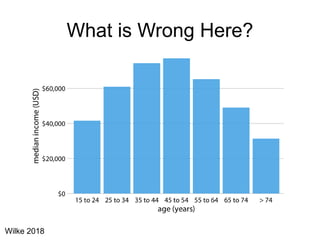
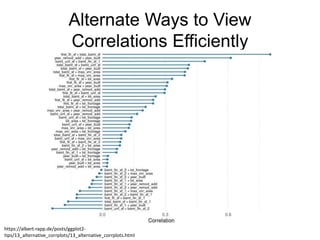
This document discusses principles and techniques for effective data visualization. It covers the history of data visualization, basic elements like scales and coordinates, and aesthetics such as using color, size, and shape to distinguish groups. Specific visualization types are examined like bar plots, histograms, scatterplots, and maps. Transforming variables through operations like log scaling and using facets to add dimensions are also discussed. The goal is to choose visualizations and design techniques that make relationships and patterns in the data as clear and understandable as possible.