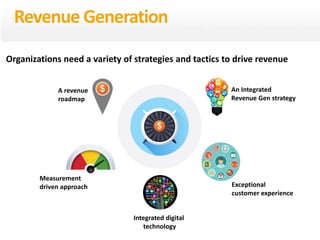
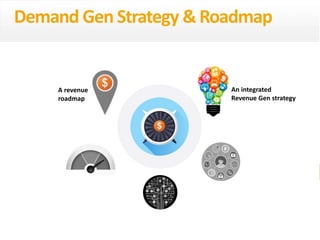
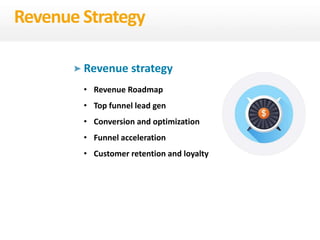
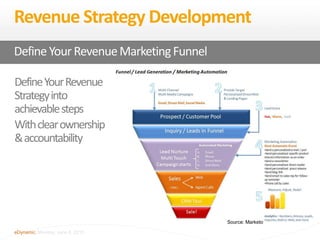
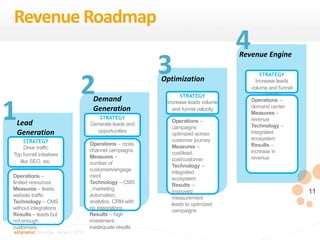
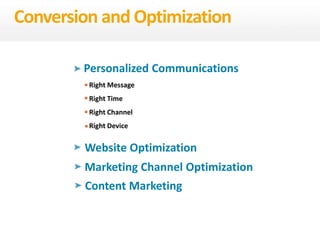
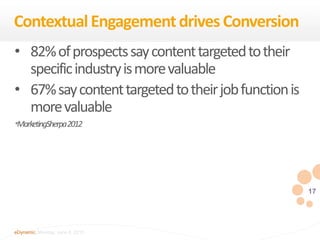
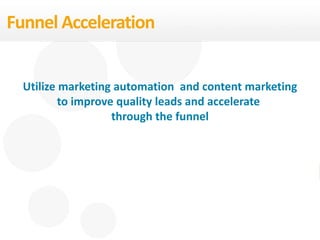
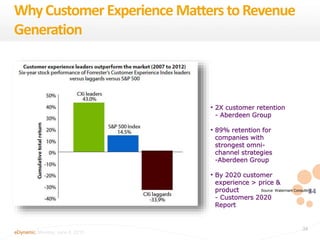
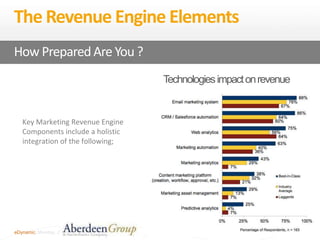
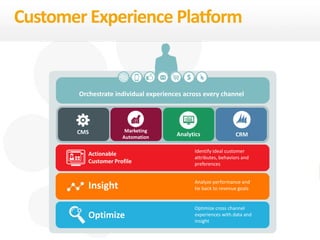
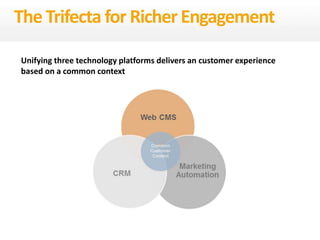
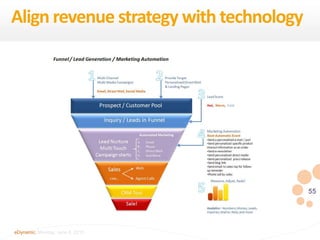
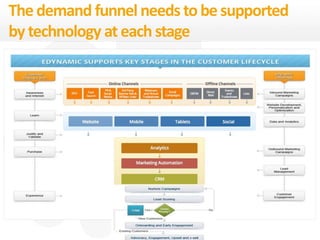
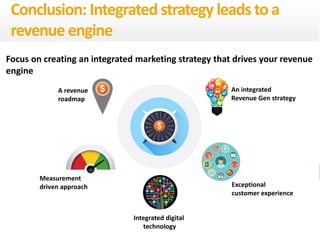
Turn your digital
marketing
programs into a
Revenue
Engine
Buyer is informed Buyer Journey
is dynamic and cross channel
Buyer has
little attention
The buyer has changed
Unprecedented change in buying
Source: Marketo
Marketing has more influence
on the buying journey
Marketing has control
over the buying funnel
Marketing has more influence than it ever did
To engage the new buyer, marketing needs to focus on revenue
and marketing performance needs to be tied to revenue
Revenue has become the most important
metric
Source: altryx report on metrics
5
Marketers cannot co-
ordinate across
channels
Unable to measure
82%
of enterprise marketers have no
synchronized view of customer data.
Source: Forrester
Technology is not integrated and
doesn’t
enable marketers
85%
CMOs say their efforts at implementing an
Omni-channel customer strategy are thwarted by a
lack of access to data and/or inadequate tools.
Source: Mckinsey
Marketers are
unable
to drive great
customer
experiences
Marketers struggle to engage customers and
drive great experiences
Customer
Experience
is poor
94% of customers have
discontinued communication
with a company because of
irrelevant messages.
— Blue Research
6
Lack of insights, integrated marketing
and a bad customer experience has a
specific impact on revenue
A revenue
roadmap
Measurement
driven approach
Integrated digital
technology
Exceptional
customer experience
Organizations need a variety of strategies and tactics to drive revenue
An Integrated
Revenue Gen strategy
Revenue Generation
8
eDynamic, Monday, June 8, 2015
An integrated
Revenue Gen strategy
A revenue
roadmap
Demand Gen Strategy & Roadmap
Revenue strategy
• Revenue Roadmap
• Top funnel lead gen
• Conversion and optimization
• Funnel acceleration
• Customer retention and loyalty
Revenue Strategy
10
eDynamic, Monday, June 8, 2015
DefineYourRevenue
Strategyinto
achievablesteps
Withclearownership
&accountability
Revenue Strategy Development
DefineYour RevenueMarketingFunnel
Source: Marketo
11
eDynamic, Monday, June 8, 2015
STRATEGY
Drive traffic
Top funnel initiatives
like SEO, etc.
Lead
Generation
STRATEGY
Generate leads and
opportunities
Operations – cross
channel campaigns
Measures – number of
customers/engagement
Technology – CMS ,
marketing automation,
analytics, CRM with no
integrations
Results – high
investment, inadequate
results
Demand
Generation
STRATEGY
Increase leads volume
and funnel velocity
Operations –
campaigns optimized
across customer
journey
Measures – cost/lead,
cost/customer
Technology –
integrated ecosystem
Results – improved
measurement leads to
optimized campaigns
Optimization
1
2
3
4
STRATEGY
Increase leads
volume and funnel
velocity
Operations –
demand center
Measures –
revenue
Technology –
integrated
ecosystem
Results – increase in
revenue
Revenue Engine
Operations – limited
resources
Measures – leads,
website traffic
Technology – CMS
without integrations
Results – leads but not
enough customers-
Revenue Roadmap
TopFunnel
LeadGen
Persona Based Content Marketing
Website Conversion
Paid, Earned and Owned Media
Advertising – Re-targeting
Top Funnel Strategies
Conversion
and Optimization
Personalized Communications
Right Message
Right Time
Right Channel
Right Device
Website Optimization
Marketing Channel Optimization
Content Marketing
Conversion and Optimization
17
eDynamic, Monday, June 8, 2015
• 82%ofprospectssaycontenttargetedtotheir
specificindustryismorevaluable
• 67%saycontenttargetedtotheirjobfunctionis
morevaluable
*MarketingSherpa2012
ContextualEngagementdrivesConversion
18
eDynamic, Monday, June 8, 2015
Your Website with a Conversion
Engine.
Content + Strategy + Testing = Leads = Revenue
19
eDynamic, Monday, June 8, 2015
Calltoactioniskeyto
drivingconversion
•Merchandiseyour
product
•CreateScent
•Simpleandpersuasive
content
•ObviousandEngagingcall
toaction
•Relevance,valueand
whathappensnext
Call to action tips the prospects
Funnel
Acceleration
50%
of leads
are not ready to buy
22
eDynamic, Monday, June 8, 2015
Funnel Acceleration
Utilize marketing automation and content marketing
to improve quality leads and accelerate
through the funnel
23
eDynamic, Monday, June 8, 2015
45%
COMPANIES USING MARKETING
AUTOMATION SOURCE 45%
MORE PIPELINE THAN THOSE
WHO DON’T USE MARKETING
AUTOMATION
Marketo
24
eDynamic, Monday, June 8, 2015
70%
Companies that invest in
marketing automation solutions
see 70% faster sales cycle times
and 54% improvement in quota
achievement.
Bulldog Solutions
25
eDynamic, Monday, June 8, 2015
25
Customer
Retention and Loyalty
Customer Retention and Loyalty
Onboard customers
Promote Usage & Adoption
Continue to Educate & Train
Target for cross sell and upsell
27
eDynamic, Monday, June 8, 2015
Drives Revenue
28
eDynamic, Monday, June 8, 2015
Understand your
Buying Cycle
Segment
your audience
Map the
Messages
Implement
the Platforms
Target the buying lifecycle
29
eDynamic, Monday, June 8, 2015
Focus on copy
Adopt a problem-solution approach to copy
Speak directly to the reader
Concentrate on decision points
Re-think Lead Gen forms/CTAs
Un-gate some copy as a preview
Add visual cues
Focus the reader on your goals
Best-in-Class Content :
Usethewebsitetoconverttheunknowntotheknown
30
eDynamic, Monday, June 8, 2015
Best-in-Class Content :
DevelopThoughtLeadership
Target content for specific audiences
Repurpose existing material
Add graphic elements
Use tools and calendars to streamline production
Promote on multiple channels (COPE)
Focus on distribution
Understand this is an iterative process; you get what you put in
31
eDynamic, Monday, June 8, 2015
Best-in-Class Content :
Focusthereaderonyourgoals
32
eDynamic, Monday, June 8, 2015
Best-in-Class Content :
COPE (Create once, publish everywhere)
33
eDynamic, Monday, June 8, 2015
Exceptional
customer experience
Organizations need a variety of strategies and tactics to drive revenue
Exceptional Customer Experience
34
eDynamic, Monday, June 8, 2015
34
Source: Watermark Consulting
• 2X customer retention
- Aberdeen Group
• 89% retention for
companies with
strongest omni-
channel strategies
-Aberdeen Group
• By 2020 customer
experience > price &
product
- Customers 2020
Report
WhyCustomer Experience Matters toRevenue
Generation
35
eDynamic, Monday, June 8, 2015
94%
of customers have
discontinued communication
with a company because of
irrelevant messages.
Blue Research
36
eDynamic, Monday, June 8, 2015
Understand your
customer
37
eDynamic, Monday, June 8, 2015
CUSTOMER JOURNEY MAP
Relevant, personalized communication across
all channels drives revenue
Cross channel,
multi device
Personalized to a
customer journey
87%
OF TOP-PERFORMING MARKETERS SAY TARGETING CAMPAIGNS TO
AUDIENCE SEGMENTS IS THE LARGEST VALUE DRIVER, WITH 78%
LISTING SEGMENTATION AS THE #1 MARKETING-AUTOMATION
CAPABILITY THEY CAN’T LIVE WITHOUT.
Gleanster
39
eDynamic, Monday, June 8, 2015
Multi-channel 1:1 Journey
SVP Marketing
in an Insurance
company
looking for a
new CMS
platform
Finds landing
page with
white paper
by ‘So Easy’
CMS
Posts on
Twitter
Receives email on
why ‘So Easy’ CMS
is so easy to use
Speaks to Sales and
starts having
presentations and
meetings
Registers for
downloading Downloads
white paper
on how to
select a new
CMS
Reads white
paper on
mobile device
via cloud
After becoming
customer
becomes an
advocate
Sees display ad with So
Easy CMS
customer Testimonial
Becomes
known
Love the “So Easy” CMS!
40
eDynamic, Monday, June 8, 2015
Insights driven by a single view of the
customer
Insights driven by a single
view of the customer
41
eDynamic, Monday, June 8, 2015
77%
Marketers indicated
improvement in revenue
by gathering customer
intelligence.
Forrester Customer Intelligence Survey
42
eDynamic, Monday, June 8, 2015
42
A single view of the customer is
essential for marketers to deliver 1:1
marketing – to deliver the right
message to the right person at the
right time, and now, on right
channel.
90%
Customers say SVC is
essential to cross-
channel success
Source: Signal Report
43
eDynamic, Monday, June 8, 2015
Useanalytics toperformfinancially better
andexecutedecisions faster
Research: http://www.bain.com/publications/articles/big_data_the_organizational_challenge.aspx
• Closing the loop - getting ROI reporting
• Reporting across the entire funnel
• Understanding how marketing influences pipeline and closed deals
• Lack of integration
• Lack of a clear path on which reports demonstrate "success". This may
be due to lack of focus on defining metrics
Challenges to calculating marketing ROI
1. Define the insights needed
2. Establish metrics to measure ROI
3. Map the data Sources
4. Understand your customer journey and Revenue Attribution Model
5. Understand the cost metrics
6. Establish reporting & insights
6 Steps to Marketing ROI
Integratedata,providesingleviewofcustomerandcustomizereportingto
trackrevenueattributedtorightchannelandimprovecustomerexperience
DEFINE INSIGHTS NEEDED:
What information do you need to know to
answer the question?
Which campaigns drove the most
qualified leads?
Which campaigns delivered the
highest return?
Which campaign type drives the
most engagement?
DEFINE METRICS:
Which metrics or data points help you
required insight?
Tool MQLs by campaign Total
SALs by campaign
Cost per lead by channel
Total revenue by campaign type
ROI by campaign
Website visits by campaign
Form conversion by campaign
Click-to-open rate by campaign
Customer
MAP DATA SOURCES
Where can the metrics and data
points be found?
Check if External
CRM
Marketing Automation
CRM Marketing Automation
Agency and vendor
Internal financial systems
Marketing Automation
Web Analytics
Define that Metrics that really matter
Gather the data sources tocalculate your
defined metrics
49
eDynamic, Monday, June 8, 2015
DefineaCommon
DefinitionofaLead
Key measures and alignment
1. Last Interaction attribution model, the last touchpoint would
receive 100% of credit for the sale.
2. First Interaction attribution model, the first touchpoint would
receive 100% of credit for the sale.
3. Linear attribution model, each touchpoint in the conversion
path would share equal credit (25% each) for the sale.
4. Time Decay attribution model, the touchpoints closest in time
to the sale get most of the credit.
Attributionmodelistherule,orsetofrules,thatdetermineshowcredit
forconversionsisassignedto achannel duringcustomerjourney
51
eDynamic, Monday, June 8, 2015
Integrated digital
technology
Technology drives revenue
52
eDynamic, Monday, June 8, 2015
Technologiesimpactonrevenue
The Revenue Engine Elements
Key Marketing Revenue Engine
Components include a holistic
integration of the following;
How PreparedAre You ?
53
eDynamic, Monday, June 8, 2015
Customer Experience Platform
Orchestrate individual experiences across every channel
CMS Marketing
Automation
Analytics
Actionable
Customer Profile
Insight
Optimize
Identify ideal customer
attributes, behaviors and
preferences
Analyze performance and
tie back to revenue goals
Optimize cross channel
experiences with data and
insight
CRM
Unifying three technology platforms delivers an customer experience
based on a common context
The Trifecta for Richer Engagement
55
eDynamic, Monday, June 8, 2015
Align revenue strategy with technology
The demand funnel needs to be supported
by technology at each stage
57
eDynamic, Monday, June 8, 2015
A revenue
roadmap
Measurement
driven approach
Integrated digital
technology
Exceptional
customer experience
Focus on creating an integrated marketing strategy that drives your revenue
engine
An integrated
Revenue Gen strategy
Conclusion: Integrated strategy leads to a
revenue engine

Digital Revenue Engine: Campaigns + Content = Revenue

  • 1.
  • 2.
    Buyer is informedBuyer Journey is dynamic and cross channel Buyer has little attention The buyer has changed
  • 3.
    Unprecedented change inbuying Source: Marketo
  • 4.
    Marketing has moreinfluence on the buying journey Marketing has control over the buying funnel Marketing has more influence than it ever did
  • 5.
    To engage thenew buyer, marketing needs to focus on revenue and marketing performance needs to be tied to revenue Revenue has become the most important metric Source: altryx report on metrics
  • 6.
    5 Marketers cannot co- ordinateacross channels Unable to measure 82% of enterprise marketers have no synchronized view of customer data. Source: Forrester Technology is not integrated and doesn’t enable marketers 85% CMOs say their efforts at implementing an Omni-channel customer strategy are thwarted by a lack of access to data and/or inadequate tools. Source: Mckinsey Marketers are unable to drive great customer experiences Marketers struggle to engage customers and drive great experiences Customer Experience is poor 94% of customers have discontinued communication with a company because of irrelevant messages. — Blue Research
  • 7.
    6 Lack of insights,integrated marketing and a bad customer experience has a specific impact on revenue
  • 8.
    A revenue roadmap Measurement driven approach Integrateddigital technology Exceptional customer experience Organizations need a variety of strategies and tactics to drive revenue An Integrated Revenue Gen strategy Revenue Generation
  • 9.
    8 eDynamic, Monday, June8, 2015 An integrated Revenue Gen strategy A revenue roadmap Demand Gen Strategy & Roadmap
  • 10.
    Revenue strategy • RevenueRoadmap • Top funnel lead gen • Conversion and optimization • Funnel acceleration • Customer retention and loyalty Revenue Strategy
  • 11.
    10 eDynamic, Monday, June8, 2015 DefineYourRevenue Strategyinto achievablesteps Withclearownership &accountability Revenue Strategy Development DefineYour RevenueMarketingFunnel Source: Marketo
  • 12.
    11 eDynamic, Monday, June8, 2015 STRATEGY Drive traffic Top funnel initiatives like SEO, etc. Lead Generation STRATEGY Generate leads and opportunities Operations – cross channel campaigns Measures – number of customers/engagement Technology – CMS , marketing automation, analytics, CRM with no integrations Results – high investment, inadequate results Demand Generation STRATEGY Increase leads volume and funnel velocity Operations – campaigns optimized across customer journey Measures – cost/lead, cost/customer Technology – integrated ecosystem Results – improved measurement leads to optimized campaigns Optimization 1 2 3 4 STRATEGY Increase leads volume and funnel velocity Operations – demand center Measures – revenue Technology – integrated ecosystem Results – increase in revenue Revenue Engine Operations – limited resources Measures – leads, website traffic Technology – CMS without integrations Results – leads but not enough customers- Revenue Roadmap
  • 13.
  • 14.
    Persona Based ContentMarketing Website Conversion Paid, Earned and Owned Media Advertising – Re-targeting Top Funnel Strategies
  • 15.
  • 16.
  • 17.
    Personalized Communications Right Message RightTime Right Channel Right Device Website Optimization Marketing Channel Optimization Content Marketing Conversion and Optimization
  • 18.
    17 eDynamic, Monday, June8, 2015 • 82%ofprospectssaycontenttargetedtotheir specificindustryismorevaluable • 67%saycontenttargetedtotheirjobfunctionis morevaluable *MarketingSherpa2012 ContextualEngagementdrivesConversion
  • 19.
    18 eDynamic, Monday, June8, 2015 Your Website with a Conversion Engine. Content + Strategy + Testing = Leads = Revenue
  • 20.
    19 eDynamic, Monday, June8, 2015 Calltoactioniskeyto drivingconversion •Merchandiseyour product •CreateScent •Simpleandpersuasive content •ObviousandEngagingcall toaction •Relevance,valueand whathappensnext Call to action tips the prospects
  • 21.
  • 22.
  • 23.
    22 eDynamic, Monday, June8, 2015 Funnel Acceleration Utilize marketing automation and content marketing to improve quality leads and accelerate through the funnel
  • 24.
    23 eDynamic, Monday, June8, 2015 45% COMPANIES USING MARKETING AUTOMATION SOURCE 45% MORE PIPELINE THAN THOSE WHO DON’T USE MARKETING AUTOMATION Marketo
  • 25.
    24 eDynamic, Monday, June8, 2015 70% Companies that invest in marketing automation solutions see 70% faster sales cycle times and 54% improvement in quota achievement. Bulldog Solutions
  • 26.
    25 eDynamic, Monday, June8, 2015 25 Customer Retention and Loyalty
  • 27.
    Customer Retention andLoyalty Onboard customers Promote Usage & Adoption Continue to Educate & Train Target for cross sell and upsell
  • 28.
    27 eDynamic, Monday, June8, 2015 Drives Revenue
  • 29.
    28 eDynamic, Monday, June8, 2015 Understand your Buying Cycle Segment your audience Map the Messages Implement the Platforms Target the buying lifecycle
  • 30.
    29 eDynamic, Monday, June8, 2015 Focus on copy Adopt a problem-solution approach to copy Speak directly to the reader Concentrate on decision points Re-think Lead Gen forms/CTAs Un-gate some copy as a preview Add visual cues Focus the reader on your goals Best-in-Class Content : Usethewebsitetoconverttheunknowntotheknown
  • 31.
    30 eDynamic, Monday, June8, 2015 Best-in-Class Content : DevelopThoughtLeadership Target content for specific audiences Repurpose existing material Add graphic elements Use tools and calendars to streamline production Promote on multiple channels (COPE) Focus on distribution Understand this is an iterative process; you get what you put in
  • 32.
    31 eDynamic, Monday, June8, 2015 Best-in-Class Content : Focusthereaderonyourgoals
  • 33.
    32 eDynamic, Monday, June8, 2015 Best-in-Class Content : COPE (Create once, publish everywhere)
  • 34.
    33 eDynamic, Monday, June8, 2015 Exceptional customer experience Organizations need a variety of strategies and tactics to drive revenue Exceptional Customer Experience
  • 35.
    34 eDynamic, Monday, June8, 2015 34 Source: Watermark Consulting • 2X customer retention - Aberdeen Group • 89% retention for companies with strongest omni- channel strategies -Aberdeen Group • By 2020 customer experience > price & product - Customers 2020 Report WhyCustomer Experience Matters toRevenue Generation
  • 36.
    35 eDynamic, Monday, June8, 2015 94% of customers have discontinued communication with a company because of irrelevant messages. Blue Research
  • 37.
    36 eDynamic, Monday, June8, 2015 Understand your customer
  • 38.
    37 eDynamic, Monday, June8, 2015 CUSTOMER JOURNEY MAP
  • 39.
    Relevant, personalized communicationacross all channels drives revenue Cross channel, multi device Personalized to a customer journey 87% OF TOP-PERFORMING MARKETERS SAY TARGETING CAMPAIGNS TO AUDIENCE SEGMENTS IS THE LARGEST VALUE DRIVER, WITH 78% LISTING SEGMENTATION AS THE #1 MARKETING-AUTOMATION CAPABILITY THEY CAN’T LIVE WITHOUT. Gleanster
  • 40.
    39 eDynamic, Monday, June8, 2015 Multi-channel 1:1 Journey SVP Marketing in an Insurance company looking for a new CMS platform Finds landing page with white paper by ‘So Easy’ CMS Posts on Twitter Receives email on why ‘So Easy’ CMS is so easy to use Speaks to Sales and starts having presentations and meetings Registers for downloading Downloads white paper on how to select a new CMS Reads white paper on mobile device via cloud After becoming customer becomes an advocate Sees display ad with So Easy CMS customer Testimonial Becomes known Love the “So Easy” CMS!
  • 41.
    40 eDynamic, Monday, June8, 2015 Insights driven by a single view of the customer Insights driven by a single view of the customer
  • 42.
    41 eDynamic, Monday, June8, 2015 77% Marketers indicated improvement in revenue by gathering customer intelligence. Forrester Customer Intelligence Survey
  • 43.
    42 eDynamic, Monday, June8, 2015 42 A single view of the customer is essential for marketers to deliver 1:1 marketing – to deliver the right message to the right person at the right time, and now, on right channel. 90% Customers say SVC is essential to cross- channel success Source: Signal Report
  • 44.
    43 eDynamic, Monday, June8, 2015 Useanalytics toperformfinancially better andexecutedecisions faster Research: http://www.bain.com/publications/articles/big_data_the_organizational_challenge.aspx
  • 45.
    • Closing theloop - getting ROI reporting • Reporting across the entire funnel • Understanding how marketing influences pipeline and closed deals • Lack of integration • Lack of a clear path on which reports demonstrate "success". This may be due to lack of focus on defining metrics Challenges to calculating marketing ROI
  • 46.
    1. Define theinsights needed 2. Establish metrics to measure ROI 3. Map the data Sources 4. Understand your customer journey and Revenue Attribution Model 5. Understand the cost metrics 6. Establish reporting & insights 6 Steps to Marketing ROI
  • 47.
    Integratedata,providesingleviewofcustomerandcustomizereportingto trackrevenueattributedtorightchannelandimprovecustomerexperience DEFINE INSIGHTS NEEDED: Whatinformation do you need to know to answer the question? Which campaigns drove the most qualified leads? Which campaigns delivered the highest return? Which campaign type drives the most engagement? DEFINE METRICS: Which metrics or data points help you required insight? Tool MQLs by campaign Total SALs by campaign Cost per lead by channel Total revenue by campaign type ROI by campaign Website visits by campaign Form conversion by campaign Click-to-open rate by campaign Customer MAP DATA SOURCES Where can the metrics and data points be found? Check if External CRM Marketing Automation CRM Marketing Automation Agency and vendor Internal financial systems Marketing Automation Marketing Automation Web Analytics
  • 48.
    Define that Metricsthat really matter
  • 49.
    Gather the datasources tocalculate your defined metrics
  • 50.
    49 eDynamic, Monday, June8, 2015 DefineaCommon DefinitionofaLead Key measures and alignment
  • 51.
    1. Last Interactionattribution model, the last touchpoint would receive 100% of credit for the sale. 2. First Interaction attribution model, the first touchpoint would receive 100% of credit for the sale. 3. Linear attribution model, each touchpoint in the conversion path would share equal credit (25% each) for the sale. 4. Time Decay attribution model, the touchpoints closest in time to the sale get most of the credit. Attributionmodelistherule,orsetofrules,thatdetermineshowcredit forconversionsisassignedto achannel duringcustomerjourney
  • 52.
    51 eDynamic, Monday, June8, 2015 Integrated digital technology Technology drives revenue
  • 53.
    52 eDynamic, Monday, June8, 2015 Technologiesimpactonrevenue The Revenue Engine Elements Key Marketing Revenue Engine Components include a holistic integration of the following; How PreparedAre You ?
  • 54.
    53 eDynamic, Monday, June8, 2015 Customer Experience Platform Orchestrate individual experiences across every channel CMS Marketing Automation Analytics Actionable Customer Profile Insight Optimize Identify ideal customer attributes, behaviors and preferences Analyze performance and tie back to revenue goals Optimize cross channel experiences with data and insight CRM
  • 55.
    Unifying three technologyplatforms delivers an customer experience based on a common context The Trifecta for Richer Engagement
  • 56.
    55 eDynamic, Monday, June8, 2015 Align revenue strategy with technology
  • 57.
    The demand funnelneeds to be supported by technology at each stage
  • 58.
    57 eDynamic, Monday, June8, 2015 A revenue roadmap Measurement driven approach Integrated digital technology Exceptional customer experience Focus on creating an integrated marketing strategy that drives your revenue engine An integrated Revenue Gen strategy Conclusion: Integrated strategy leads to a revenue engine

Editor's Notes

  • #3 The buyer has changed. The buyer is more informed The new buyer has many options The buyer has Little attention. There is so much information available and being sent to buyers, that attention is scarce. Design: Image of a buyer with many options? Three icons – One a buyer who is more informed second journey is dynamic and third buyer has little atention. Who has many options one that has very little attention. Sample images above.
  • #4 The buyer has changed. The buyer is more informed The new buyer has many options The buyer has Little attention. There is so much information available and being sent to buyers, that attention is scarce. Design: Image of a buyer with many options? Three icons – One a buyer who is more informed second journey is dynamic and third buyer has little atention. Who has many options one that has very little attention. Sample images above.
  • #5 The buyer has changed. The buyer is more informed The new buyer has many options The buyer has Little attention. There is so much information available and being sent to buyers, that attention is scarce. Design: Image of a buyer with many options? Three icons – One a buyer who is more informed second journey is dynamic and third buyer has little atention. Who has many options one that has very little attention. Sample images above.
  • #6 The buyer has changed. The buyer is more informed The new buyer has many options The buyer has Little attention. There is so much information available and being sent to buyers, that attention is scarce. Design: Image of a buyer with many options? Three icons – One a buyer who is more informed second journey is dynamic and third buyer has little atention. Who has many options one that has very little attention. Sample images above.
  • #9 The buyer has changed. The buyer is more informed The new buyer has many options The buyer has Little attention. There is so much information available and being sent to buyers, that attention is scarce. Design: Image of a buyer with many options? Three icons – One a buyer who is more informed second journey is dynamic and third buyer has little atention. Who has many options one that has very little attention. Sample images above.
  • #10 The buyer has changed. The buyer is more informed The new buyer has many options The buyer has Little attention. There is so much information available and being sent to buyers, that attention is scarce. Design: Image of a buyer with many options? Three icons – One a buyer who is more informed second journey is dynamic and third buyer has little atention. Who has many options one that has very little attention. Sample images above.
  • #11 The buyer has changed. The buyer is more informed The new buyer has many options The buyer has Little attention. There is so much information available and being sent to buyers, that attention is scarce. Design: Image of a buyer with many options? Three icons – One a buyer who is more informed second journey is dynamic and third buyer has little atention. Who has many options one that has very little attention. Sample images above.
  • #13 The buyer has changed. The buyer is more informed The new buyer has many options The buyer has Little attention. There is so much information available and being sent to buyers, that attention is scarce. Design: Image of a buyer with many options? Three icons – One a buyer who is more informed second journey is dynamic and third buyer has little atention. Who has many options one that has very little attention. Sample images above.
  • #15 The buyer has changed. The buyer is more informed The new buyer has many options The buyer has Little attention. There is so much information available and being sent to buyers, that attention is scarce. Design: Image of a buyer with many options? Three icons – One a buyer who is more informed second journey is dynamic and third buyer has little atention. Who has many options one that has very little attention. Sample images above.
  • #16 The buyer has changed. The buyer is more informed The new buyer has many options The buyer has Little attention. There is so much information available and being sent to buyers, that attention is scarce. Design: Image of a buyer with many options? Three icons – One a buyer who is more informed second journey is dynamic and third buyer has little atention. Who has many options one that has very little attention. Sample images above.
  • #18 The buyer has changed. The buyer is more informed The new buyer has many options The buyer has Little attention. There is so much information available and being sent to buyers, that attention is scarce. Design: Image of a buyer with many options? Three icons – One a buyer who is more informed second journey is dynamic and third buyer has little atention. Who has many options one that has very little attention. Sample images above.
  • #20 Let’s you know what your site can do (and tell you how much money you are leaving on the table) – Your site may be working ok – how do you know? The only place you can measurably change your revenue/move the demand curve in a concrete way, using the assets you already have.
  • #24 The buyer has changed. The buyer is more informed The new buyer has many options The buyer has Little attention. There is so much information available and being sent to buyers, that attention is scarce. Design: Image of a buyer with many options? Three icons – One a buyer who is more informed second journey is dynamic and third buyer has little atention. Who has many options one that has very little attention. Sample images above.
  • #28 The buyer has changed. The buyer is more informed The new buyer has many options The buyer has Little attention. There is so much information available and being sent to buyers, that attention is scarce. Design: Image of a buyer with many options? Three icons – One a buyer who is more informed second journey is dynamic and third buyer has little atention. Who has many options one that has very little attention. Sample images above.
  • #30 The buyer has changed. The buyer is more informed The new buyer has many options The buyer has Little attention. There is so much information available and being sent to buyers, that attention is scarce. Design: Image of a buyer with many options? Three icons – One a buyer who is more informed second journey is dynamic and third buyer has little atention. Who has many options one that has very little attention. Sample images above.
  • #31 The buyer has changed. The buyer is more informed The new buyer has many options The buyer has Little attention. There is so much information available and being sent to buyers, that attention is scarce. Design: Image of a buyer with many options? Three icons – One a buyer who is more informed second journey is dynamic and third buyer has little atention. Who has many options one that has very little attention. Sample images above.
  • #32 The buyer has changed. The buyer is more informed The new buyer has many options The buyer has Little attention. There is so much information available and being sent to buyers, that attention is scarce. Design: Image of a buyer with many options? Three icons – One a buyer who is more informed second journey is dynamic and third buyer has little atention. Who has many options one that has very little attention. Sample images above.
  • #33 The buyer has changed. The buyer is more informed The new buyer has many options The buyer has Little attention. There is so much information available and being sent to buyers, that attention is scarce. Design: Image of a buyer with many options? Three icons – One a buyer who is more informed second journey is dynamic and third buyer has little atention. Who has many options one that has very little attention. Sample images above.
  • #34 The buyer has changed. The buyer is more informed The new buyer has many options The buyer has Little attention. There is so much information available and being sent to buyers, that attention is scarce. Design: Image of a buyer with many options? Three icons – One a buyer who is more informed second journey is dynamic and third buyer has little atention. Who has many options one that has very little attention. Sample images above.
  • #35 The buyer has changed. The buyer is more informed The new buyer has many options The buyer has Little attention. There is so much information available and being sent to buyers, that attention is scarce. Design: Image of a buyer with many options? Three icons – One a buyer who is more informed second journey is dynamic and third buyer has little atention. Who has many options one that has very little attention. Sample images above.
  • #36 And customer experience matters: leaders in delivering customer experience show consistently better performance than those that don’t. This makes intuitive sense: treat customers well, and they’ll stay your customers. Here are some facts: Look at the stock performance of Forrester’s Customer Experience Index leaders versus Laggards – which bucket do you want to be in? [CLICK]
  • #40 The buyer has changed. The buyer is more informed The new buyer has many options The buyer has Little attention. There is so much information available and being sent to buyers, that attention is scarce. Design: Image of a buyer with many options? Three icons – One a buyer who is more informed second journey is dynamic and third buyer has little atention. Who has many options one that has very little attention. Sample images above.
  • #41 Step 2: change into an actual visual of a paper to download: Done Step 4: Show an image of a person. You can download from shutterstock.com where we have access: Done. Took it from Google Step 8: change banner to an image with So Easy and a customer smiling: Done Step 9: show a post on Twitter that ‘he likes how easy So Easy CMS is’: Done
  • #42 The buyer has changed. The buyer is more informed The new buyer has many options The buyer has Little attention. There is so much information available and being sent to buyers, that attention is scarce. Design: Image of a buyer with many options? Three icons – One a buyer who is more informed second journey is dynamic and third buyer has little atention. Who has many options one that has very little attention. Sample images above.
  • #53 The buyer has changed. The buyer is more informed The new buyer has many options The buyer has Little attention. There is so much information available and being sent to buyers, that attention is scarce. Design: Image of a buyer with many options? Three icons – One a buyer who is more informed second journey is dynamic and third buyer has little atention. Who has many options one that has very little attention. Sample images above.
  • #55 Edits: Add CRM next to Analytics We provide our clients the ability to orchestrate experiences across every touch-point. In a coordinated manner. We integrate your technology so that you can consistently and relevantly delivery experiences. We create a central profile of the customer that captures data from every touchpoint – website, mobile, social, email, customer portals and offline data such as events. With this rich profile you can engage with customers like never before. We provide analytics insight through reports and dashboarding to ensure that your marketing capaigns deliver performance Finally we provide you tools to optimize experience.
  • #56 The buyer has changed. The buyer is more informed The new buyer has many options The buyer has Little attention. There is so much information available and being sent to buyers, that attention is scarce. Design: Image of a buyer with many options? Three icons – One a buyer who is more informed second journey is dynamic and third buyer has little atention. Who has many options one that has very little attention. Sample images above.
  • #58 The buyer has changed. The buyer is more informed The new buyer has many options The buyer has Little attention. There is so much information available and being sent to buyers, that attention is scarce. Design: Image of a buyer with many options? Three icons – One a buyer who is more informed second journey is dynamic and third buyer has little atention. Who has many options one that has very little attention. Sample images above.
  • #59 The buyer has changed. The buyer is more informed The new buyer has many options The buyer has Little attention. There is so much information available and being sent to buyers, that attention is scarce. Design: Image of a buyer with many options? Three icons – One a buyer who is more informed second journey is dynamic and third buyer has little atention. Who has many options one that has very little attention. Sample images above.