Download as PDF, PPTX

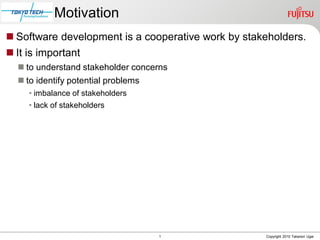
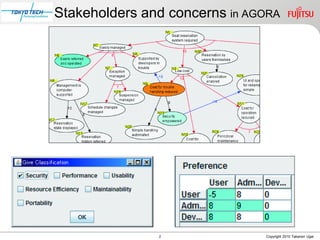
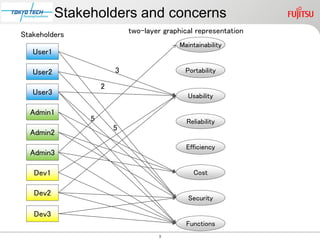
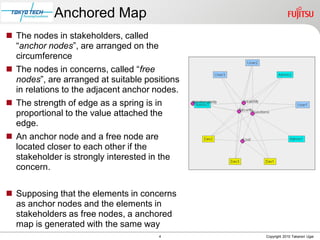
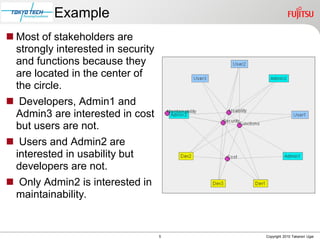
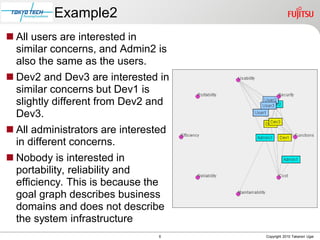


The document presents a technique for visualizing stakeholder concerns in software development using an anchored map. This graphical representation aids requirements analysts by mapping the relationships between stakeholders and system concerns, highlighting priorities and areas of imbalance. Future work will focus on improving scalability for handling data from large numbers of stakeholders.