Download to read offline


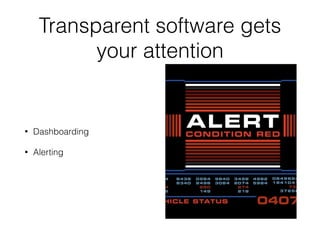
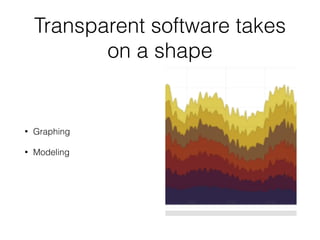
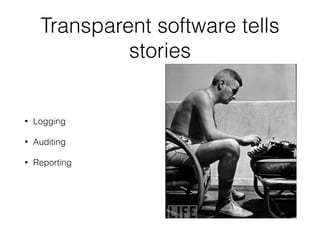
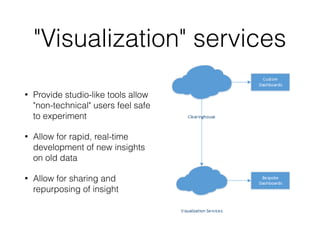
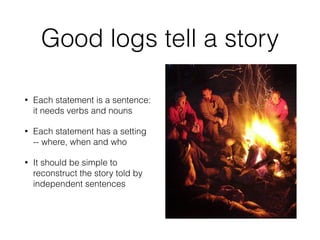
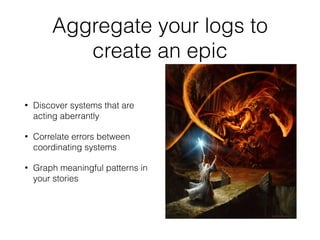
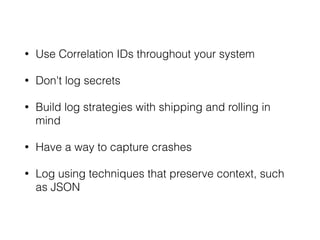


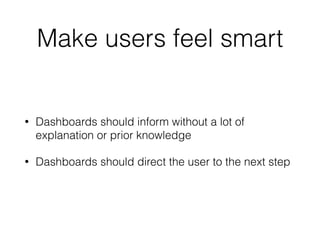
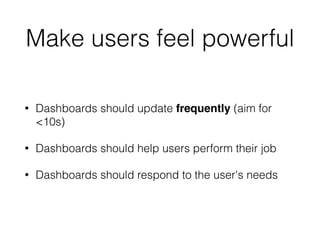

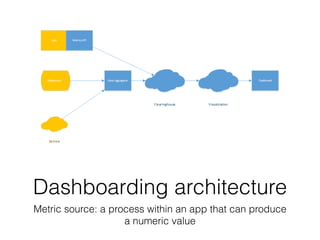
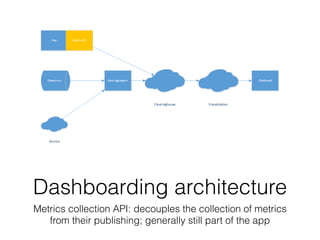
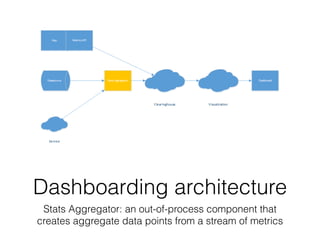
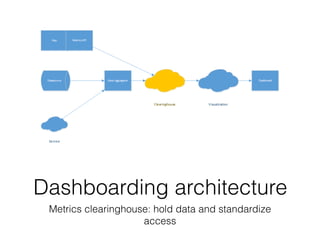


The document discusses the importance of transparent software that enhances user experience by providing clear visibility into application performance and operations. It emphasizes that opaque software can lead to misalignment, productivity loss, and poor customer experiences, while see-through software fosters understanding, control, and safety for users. Key strategies for achieving transparency include effective logging, dashboarding, and democratizing access to information.


![[WSO2Con Asia 2018] Building Reactive Applications Using Event-driven Archite...](https://cdn.slidesharecdn.com/ss_thumbnails/wso2conasia2018-buildingreactiveapplicationsusingevent-drivenarchitecture-180810094630-thumbnail.jpg?width=640&height=640&fit=bounds)


