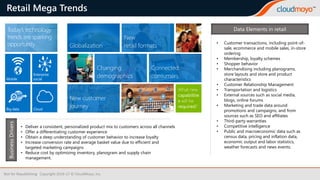
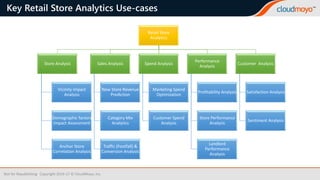
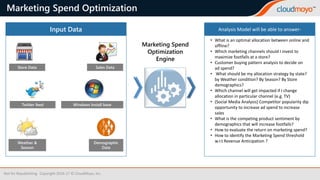
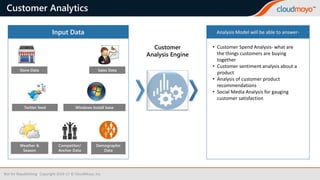
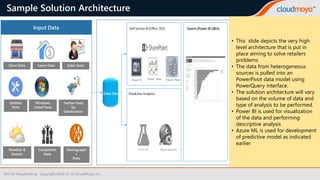
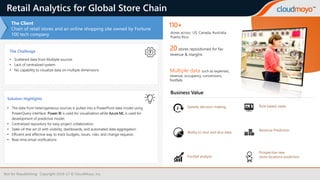
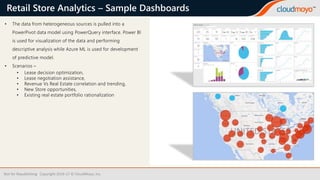
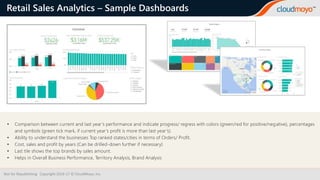
Retail Analytics
Retail Mega Trends
Not for Republishing Copyright 2016-17 © CloudMoyo, Inc.
Connected
consumers
What new
capabilitie
s will be
required?
Changing
demographics
Globalization
New
retail formats
Today’s technology
trends are sparking
opportunity
Mobile
Enterprise
social
Big data Cloud
New customer
journey
• Customer transactions, including point-of-
sale, ecommerce and mobile sales, in-store
ordering
• Membership, loyalty schemes
• Shopper behavior
• Merchandising including planograms,
store layouts and store and product
characteristics
• Customer Relationship Management
• Transportation and logistics
• External sources such as social media,
blogs, online forums
• Marketing and trade data around
promotions and campaigns, and from
sources such as SEO and affiliates
• Third-party warranties
• Competitive intelligence
• Public and macroeconomic data such as
census data, pricing and inflation data,
economic output and labor statistics,
weather forecasts and news events.
Data Elements in retail
• Deliver a consistent, personalized product mix to customers across all channels
• Offer a differentiating customer experience
• Obtain a deep understanding of customer behavior to increase loyalty
• Increase conversion rate and average basket value due to efficient and
targeted marketing campaigns
• Reduce cost by optimizing inventory, planogram and supply chain
management.
BusinessDrivers
Key Retail Store Analytics Use-cases
Not for Republishing Copyright 2016-17 © CloudMoyo, Inc.
Retail Store
Analytics
Store Analysis
Vicinity impact
Analysis
Demographic factors
Impact Assessment
Anchor Store
Correlation Analysis
Sales Analysis
New Store Revenue
Prediction
Category Mix
Analytics
Traffic (Footfall) &
Conversion Analysis
Spend Analysis
Marketing Spend
Optimization
Customer Spend
Analysis
Performance
Analysis
Profitability Analysis
Store Performance
Analysis
Landlord
Performance
Analysis
Customer Analysis
Satisfaction Analysis
Sentiment Analysis
Retail Analytics Roadmap
Not for Republishing Copyright 2016-17 © CloudMoyo, Inc.
Descriptive
Predictive
Prescriptive
Semantics
Business Intelligence
Cause-Effect Analysis
Prediction & Forecasting
What-If Analysis &
Optimization
Context driven understanding
• 360 deg view of Store operations
• Vicinity impact Analysis
• Demographic factors Impact Assessment
• Anchor Store Correlation Analysis
• Category Mix Analytics
• Traffic (Footfall) & Conversion Analysis
• Sales Revenue Predictions
• Demand Forecasting
• Personalized Offer
Recommendations
• Customer Churn Analysis
• SKU Rationalization
• Marketing Spend Optimization
• Social feed analysis
• Sentiment Analysis
Store Data Analysis
Not for Republishing Copyright 2016-17 © CloudMoyo, Inc.
Store Analysis
Engine
Analysis Model focuses on-
• Store Profitability Analysis
• Lease and Sales Analysis by store,
landlord, location
• Vicinity Impact Analysis: What is
the distance that needs to be
maintained between 2 stores?
• Anchor Store Correlation Analysis:
What impact do anchor stores
have on store selection?
Input Data
Lease DataStore Data Sales Data
Demographic
Data
Competitor /
Anchor Data
Weather &
Season
Windows Install base (and
Online)
Utilities Data
Revenue Analysis & Prediction
Not for Republishing Copyright 2016-17 © CloudMoyo, Inc.
Revenue Analysis
Engine
• Where should we plan next store?
• What will revenue of a store be at a
planned location by season, by product?
• What is correlation of Anchor Store
revenue with Microsoft Store revenue?
• What is the impact of season change,
demographics, climate at a location on
my sales?
• What type of store that is suited for a
given location?
Analysis Model answers -Input Data
Lease DataStore Data Sales Data
Demographic
Data
Competitor
Data
Weather &
Season
Windows Install base (and
Online)
Utilities Data
Traffic (Footfall) & Conversion Analysis
Not for Republishing Copyright 2016-17 © CloudMoyo, Inc.
Traffic (Footfall)
& Conversion
Analysis Engine
• What are most preferred categories by
state, city, store, over time?
• What is the user sentiment about the
newly launched category/(s) based on
Twitter feed analysis?
• What is the competing product
sentiment by demographics that will
increase footfalls?
• Conversion/Footfall change Vs
Marketing Spend (ROI)
Analysis Model will be able to answer-Input Data
Lease DataStore Data Sales Data
Demographic
Data
Competitor/
Anchor Data
Weather &
Season
Windows Install baseUtilities Data
Marketing Spend Optimization
Not for Republishing Copyright 2016-17 © CloudMoyo, Inc.
Marketing Spend
Optimization
Engine
• What is an optimal allocation between online and
offline?
• Which marketing channels should I invest to
maximize footfalls at a store?
• Customer buying pattern analysis to decide on
ad spend?
• What should be my allocation strategy by state?
by Weather condition? By Season? By Store
demographics?
• Which channel will get impacted if I change
allocation in particular channel (e.g. TV)
• (Social Media Analysis) Competitor popularity dip
opportunity to increase ad spend to increase
sales
• What is the competing product sentiment by
demographics that will increase footfalls?
• How to evaluate the return on marketing spend?
• How to identify the Marketing Spend threshold
w.r.t Revenue Anticipation ?
Analysis Model will be able to answer-Input Data
Store Data Sales Data
Demographic
Data
Weather &
Season
Windows Install baseTwitter feed
Customer Analytics
Not for Republishing Copyright 2016-17 © CloudMoyo, Inc.
Customer
Analysis Engine
• Customer Spend Analysis- what are
the things customers are buying
together
• Customer sentiment analysis about a
product
• Analysis of customer product
recommendations
• Social Media Analysis for gauging
customer satisfaction
Analysis Model will be able to answer-Input Data
Store Data Sales Data
Demographic
Data
Competitor/
Anchor Data
Weather &
Season
Windows Install baseTwitter feed
Workforce Management – Crew Scheduling
Not for Republishing Copyright 2016-17 © CloudMoyo, Inc.
Crew
Management
• Allocation of right crew to right
function
• Shift management
• Optimum utilization
• Scheduling, rostering
Analysis Model will be able to answer-Input Data
Day of the Week Skill/ Expertise
Employee
Data
Festival /
Season
Time
Sample Solution Architecture
Not for Republishing Copyright 2016-17 © CloudMoyo, Inc.
Input Data
Lease DataStore Data Sales Data
Demographi
c
Data
Competitor
Data
Weather &
Season
Windows
Install base
SelfServiceBI(Office365) Search(PowerBIQ&A)
PowerBI Power View Power Pivot
PredictiveAnalytics
Azure ML Web Service
Twitter Feed
by
Geolocation
Utilities
Data
Data Set
• This slide depicts the very high
level architecture that is put in
place aiming to solve retailers
problems
• The data from heterogeneous
sources is pulled into an
PowerPivot data model using
PowerQuery interface.
• The solution architecture will vary
based on the volume of data and
type of analysis to be performed.
• Power BI is used for visualization
of the data and performing
descriptive analysis
• Azure ML is used for development
of predictive model as indicated
earlier
CloudMoyo Case-Studies
Retail Analytics for Global Store Chain
Not for Republishing Copyright 2016-17 © CloudMoyo, Inc.
Solution Highlights
• The data from heterogeneous sources is pulled into a PowerPivot data model using
PowerQuery interface. Power BI is used for visualization while Azure ML is used for
development of predictive model.
• Centralized repository for easy project collaboration
• State-of-the-art UI with visibility, dashboards, and automated data aggregation
• Efficient and effective way to track budgets, issues, risks, and change requests
• Real-time email notifications
The Challenge
• Scattered data from Multiple sources
• Lack of centralized system
• No capability to visualize data on multiple dimensions
The Client
Chain of retail stores and an online shopping site owned by Fortune
100 tech company
Business Value
?
Speedy decision-making Role based views
Ability to slice and dice data
Revenue Prediction
Footfall analysis
Prospective new
store-locations prediction
110+
stores across US, Canada, Australia,
Puerto Rico
20 stores repositioned for fav
revenue & margins
Multiple data such as expenses,
revenue, occupancy, conversions,
footfalls
Retail Store Analytics – Sample Dashboards
Not for Republishing Copyright 2016-17 © CloudMoyo, Inc.
• The data from heterogeneous sources is pulled into a
PowerPivot data model using PowerQuery interface. Power BI
is used for visualization of the data and performing
descriptive analysis while Azure ML is used for development
of predictive model.
• Scenarios –
• Lease decision optimization,
• Lease negotiation assistance,
• Revenue Vs Real Estate correlation and trending,
• New Store opportunities,
• Existing real estate portfolio rationalization
Retail Sales Analytics – Sample Dashboards
Not for Republishing Copyright 2016-17 © CloudMoyo, Inc.
• Comparison between current and last year’s performance and indicate progress/ regress with colors (green/red for positive/negative), percentages
and symbols (green tick mark, if current year’s profit is more than last year’s).
• Ability to understand the businesses Top ranked states/cities in terms of Orders/ Profit.
• Cost, sales and profit by years (Can be drilled-down further if necessary)
• Last tile shows the top brands by sales amount.
• Helps in Overall Business Performance, Territory Analysis, Brand Analysis
Corporate Headquarters
Bellevue, WA – 98007
Phone: +1 (425) 885-5800
Mid-America Center
Overland Park, KS - 66210
Phone: +1 (816) 399-3992
East Center
Jacksonville, Florida
Phone: +1 (904) 647-4700
Solutions and Innovation Center
Pune, India
Phone: +91 6627 7878
Thank You

Retail Analytics Solution - CloudMoyo

  • 1.
  • 2.
    Retail Mega Trends Notfor Republishing Copyright 2016-17 © CloudMoyo, Inc. Connected consumers What new capabilitie s will be required? Changing demographics Globalization New retail formats Today’s technology trends are sparking opportunity Mobile Enterprise social Big data Cloud New customer journey • Customer transactions, including point-of- sale, ecommerce and mobile sales, in-store ordering • Membership, loyalty schemes • Shopper behavior • Merchandising including planograms, store layouts and store and product characteristics • Customer Relationship Management • Transportation and logistics • External sources such as social media, blogs, online forums • Marketing and trade data around promotions and campaigns, and from sources such as SEO and affiliates • Third-party warranties • Competitive intelligence • Public and macroeconomic data such as census data, pricing and inflation data, economic output and labor statistics, weather forecasts and news events. Data Elements in retail • Deliver a consistent, personalized product mix to customers across all channels • Offer a differentiating customer experience • Obtain a deep understanding of customer behavior to increase loyalty • Increase conversion rate and average basket value due to efficient and targeted marketing campaigns • Reduce cost by optimizing inventory, planogram and supply chain management. BusinessDrivers
  • 3.
    Key Retail StoreAnalytics Use-cases Not for Republishing Copyright 2016-17 © CloudMoyo, Inc. Retail Store Analytics Store Analysis Vicinity impact Analysis Demographic factors Impact Assessment Anchor Store Correlation Analysis Sales Analysis New Store Revenue Prediction Category Mix Analytics Traffic (Footfall) & Conversion Analysis Spend Analysis Marketing Spend Optimization Customer Spend Analysis Performance Analysis Profitability Analysis Store Performance Analysis Landlord Performance Analysis Customer Analysis Satisfaction Analysis Sentiment Analysis
  • 4.
    Retail Analytics Roadmap Notfor Republishing Copyright 2016-17 © CloudMoyo, Inc. Descriptive Predictive Prescriptive Semantics Business Intelligence Cause-Effect Analysis Prediction & Forecasting What-If Analysis & Optimization Context driven understanding • 360 deg view of Store operations • Vicinity impact Analysis • Demographic factors Impact Assessment • Anchor Store Correlation Analysis • Category Mix Analytics • Traffic (Footfall) & Conversion Analysis • Sales Revenue Predictions • Demand Forecasting • Personalized Offer Recommendations • Customer Churn Analysis • SKU Rationalization • Marketing Spend Optimization • Social feed analysis • Sentiment Analysis
  • 5.
    Store Data Analysis Notfor Republishing Copyright 2016-17 © CloudMoyo, Inc. Store Analysis Engine Analysis Model focuses on- • Store Profitability Analysis • Lease and Sales Analysis by store, landlord, location • Vicinity Impact Analysis: What is the distance that needs to be maintained between 2 stores? • Anchor Store Correlation Analysis: What impact do anchor stores have on store selection? Input Data Lease DataStore Data Sales Data Demographic Data Competitor / Anchor Data Weather & Season Windows Install base (and Online) Utilities Data
  • 6.
    Revenue Analysis &Prediction Not for Republishing Copyright 2016-17 © CloudMoyo, Inc. Revenue Analysis Engine • Where should we plan next store? • What will revenue of a store be at a planned location by season, by product? • What is correlation of Anchor Store revenue with Microsoft Store revenue? • What is the impact of season change, demographics, climate at a location on my sales? • What type of store that is suited for a given location? Analysis Model answers -Input Data Lease DataStore Data Sales Data Demographic Data Competitor Data Weather & Season Windows Install base (and Online) Utilities Data
  • 7.
    Traffic (Footfall) &Conversion Analysis Not for Republishing Copyright 2016-17 © CloudMoyo, Inc. Traffic (Footfall) & Conversion Analysis Engine • What are most preferred categories by state, city, store, over time? • What is the user sentiment about the newly launched category/(s) based on Twitter feed analysis? • What is the competing product sentiment by demographics that will increase footfalls? • Conversion/Footfall change Vs Marketing Spend (ROI) Analysis Model will be able to answer-Input Data Lease DataStore Data Sales Data Demographic Data Competitor/ Anchor Data Weather & Season Windows Install baseUtilities Data
  • 8.
    Marketing Spend Optimization Notfor Republishing Copyright 2016-17 © CloudMoyo, Inc. Marketing Spend Optimization Engine • What is an optimal allocation between online and offline? • Which marketing channels should I invest to maximize footfalls at a store? • Customer buying pattern analysis to decide on ad spend? • What should be my allocation strategy by state? by Weather condition? By Season? By Store demographics? • Which channel will get impacted if I change allocation in particular channel (e.g. TV) • (Social Media Analysis) Competitor popularity dip opportunity to increase ad spend to increase sales • What is the competing product sentiment by demographics that will increase footfalls? • How to evaluate the return on marketing spend? • How to identify the Marketing Spend threshold w.r.t Revenue Anticipation ? Analysis Model will be able to answer-Input Data Store Data Sales Data Demographic Data Weather & Season Windows Install baseTwitter feed
  • 9.
    Customer Analytics Not forRepublishing Copyright 2016-17 © CloudMoyo, Inc. Customer Analysis Engine • Customer Spend Analysis- what are the things customers are buying together • Customer sentiment analysis about a product • Analysis of customer product recommendations • Social Media Analysis for gauging customer satisfaction Analysis Model will be able to answer-Input Data Store Data Sales Data Demographic Data Competitor/ Anchor Data Weather & Season Windows Install baseTwitter feed
  • 10.
    Workforce Management –Crew Scheduling Not for Republishing Copyright 2016-17 © CloudMoyo, Inc. Crew Management • Allocation of right crew to right function • Shift management • Optimum utilization • Scheduling, rostering Analysis Model will be able to answer-Input Data Day of the Week Skill/ Expertise Employee Data Festival / Season Time
  • 11.
    Sample Solution Architecture Notfor Republishing Copyright 2016-17 © CloudMoyo, Inc. Input Data Lease DataStore Data Sales Data Demographi c Data Competitor Data Weather & Season Windows Install base SelfServiceBI(Office365) Search(PowerBIQ&A) PowerBI Power View Power Pivot PredictiveAnalytics Azure ML Web Service Twitter Feed by Geolocation Utilities Data Data Set • This slide depicts the very high level architecture that is put in place aiming to solve retailers problems • The data from heterogeneous sources is pulled into an PowerPivot data model using PowerQuery interface. • The solution architecture will vary based on the volume of data and type of analysis to be performed. • Power BI is used for visualization of the data and performing descriptive analysis • Azure ML is used for development of predictive model as indicated earlier
  • 12.
  • 13.
    Retail Analytics forGlobal Store Chain Not for Republishing Copyright 2016-17 © CloudMoyo, Inc. Solution Highlights • The data from heterogeneous sources is pulled into a PowerPivot data model using PowerQuery interface. Power BI is used for visualization while Azure ML is used for development of predictive model. • Centralized repository for easy project collaboration • State-of-the-art UI with visibility, dashboards, and automated data aggregation • Efficient and effective way to track budgets, issues, risks, and change requests • Real-time email notifications The Challenge • Scattered data from Multiple sources • Lack of centralized system • No capability to visualize data on multiple dimensions The Client Chain of retail stores and an online shopping site owned by Fortune 100 tech company Business Value ? Speedy decision-making Role based views Ability to slice and dice data Revenue Prediction Footfall analysis Prospective new store-locations prediction 110+ stores across US, Canada, Australia, Puerto Rico 20 stores repositioned for fav revenue & margins Multiple data such as expenses, revenue, occupancy, conversions, footfalls
  • 14.
    Retail Store Analytics– Sample Dashboards Not for Republishing Copyright 2016-17 © CloudMoyo, Inc. • The data from heterogeneous sources is pulled into a PowerPivot data model using PowerQuery interface. Power BI is used for visualization of the data and performing descriptive analysis while Azure ML is used for development of predictive model. • Scenarios – • Lease decision optimization, • Lease negotiation assistance, • Revenue Vs Real Estate correlation and trending, • New Store opportunities, • Existing real estate portfolio rationalization
  • 15.
    Retail Sales Analytics– Sample Dashboards Not for Republishing Copyright 2016-17 © CloudMoyo, Inc. • Comparison between current and last year’s performance and indicate progress/ regress with colors (green/red for positive/negative), percentages and symbols (green tick mark, if current year’s profit is more than last year’s). • Ability to understand the businesses Top ranked states/cities in terms of Orders/ Profit. • Cost, sales and profit by years (Can be drilled-down further if necessary) • Last tile shows the top brands by sales amount. • Helps in Overall Business Performance, Territory Analysis, Brand Analysis
  • 16.
    Corporate Headquarters Bellevue, WA– 98007 Phone: +1 (425) 885-5800 Mid-America Center Overland Park, KS - 66210 Phone: +1 (816) 399-3992 East Center Jacksonville, Florida Phone: +1 (904) 647-4700 Solutions and Innovation Center Pune, India Phone: +91 6627 7878 Thank You