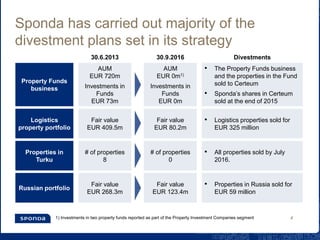
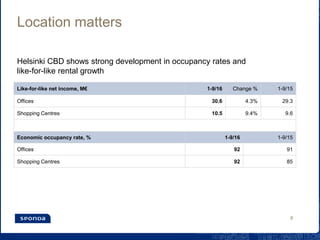
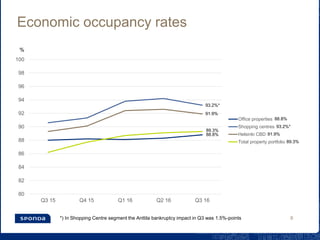
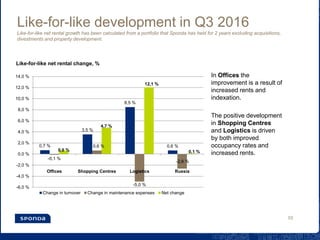
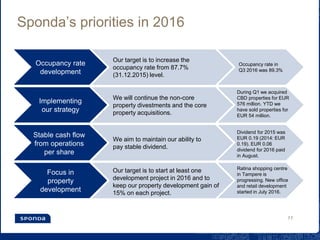
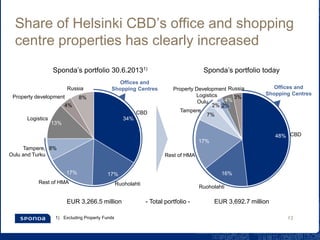
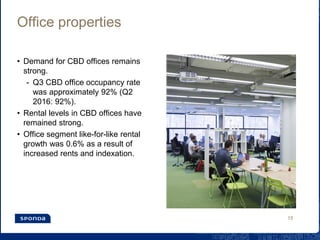
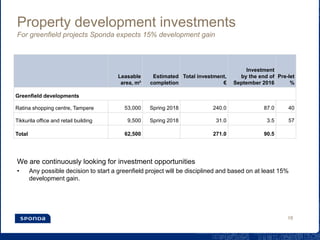
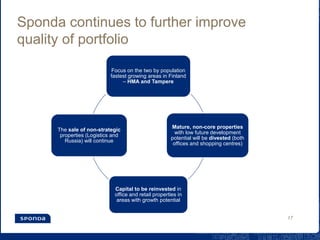
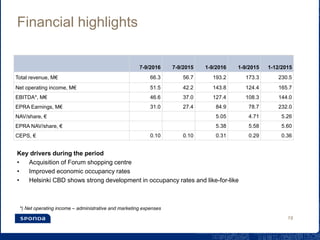
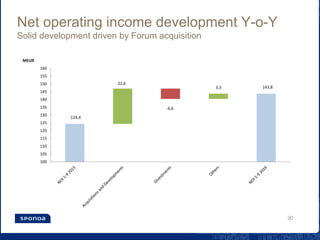
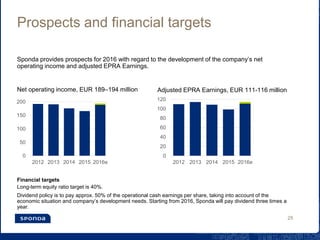
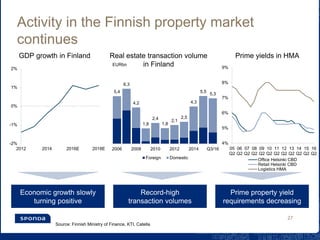
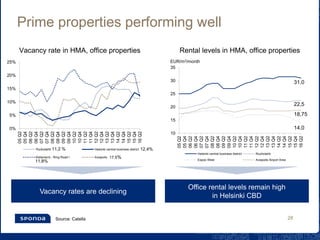
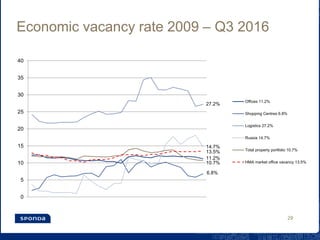
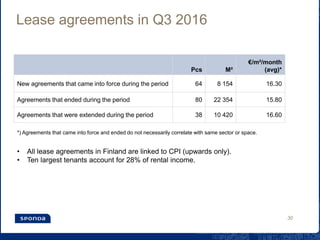
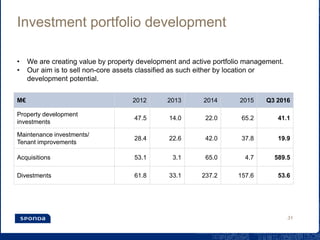
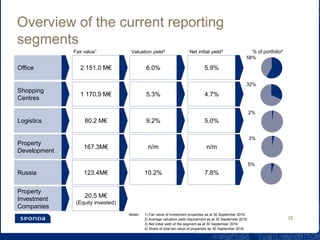
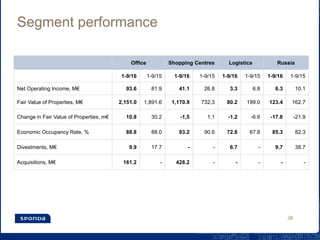
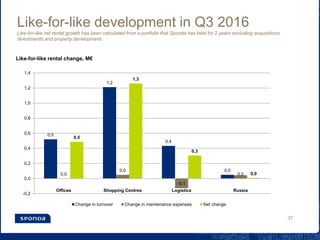
Sponda reported strong financial results for Q3 2016. Key highlights included continued positive performance in the shopping centre segment driven by like-for-like rental growth of 4.7% and occupancy increasing to 93.2%. Sponda largely completed its planned divestment of non-core assets, selling logistics properties and its remaining Russian portfolio. Business conditions in Finland remain positive with economic growth turning positive, record high real estate transaction volumes, and decreasing prime property yield requirements. Sponda is focused on further improving portfolio quality by investing in growth areas like Helsinki and Tampere and divesting mature properties with lower potential.
Etude PwC IPO Watch Europe Q1 2015 (avril 2015)PwC France
Le total des IPO en Europe a atteint 16,4 milliards d’euros au premier trimestre 2015, soit le meilleur début d’année depuis 15 ans.
- L’activité a été tirée par des opérations supérieures à 1 milliard d’euros à Madrid, à Londres, en Suisse et à Amsterdam.
- Sur la place londonienne, l’activité a été plus modérée, et sa contribution ne s’élève qu’à 28 %, contre 52 % au premier trimestre 2014.
- Selon les estimations de PwC, le niveau des fonds levés par introduction en bourse au premier semestre 2015 devrait correspondre à celui de l’année dernière au niveau européen, avec toutefois une dynamique plus soutenue en Europe continentale.
Technopolis provides the best addresses for companies to operate and succeed in five countries in the Nordic-Baltic region. In this presentation we present our financial highlights from fiscal year 2014.
The mining census is conducted once every three to five years. It collects data on the nature and structure of the mining industry. The results of the Census of Mining present data collected from all mines that were registered for mineral rights with the Department of Mineral Resources (DMR) in 2015. The report presents statistics from the following variables collected: income generated by the industry (including sales revenue by commodity), employment levels and average salaries in the industry, expenditure, as well as details and rand values of raw and capitalised materials purchased and services outsourced by the mining industry at both national and provincial level.
We describe existing and anticipated future benefits
of an end-to-end methodology for annotating formal RDF
statements representing temporal knowledge to be extracted
from text, as well as for authoring and validating test and/or
application queries to exercise that knowledge. Extraction is
driven by a target ontology of temporal and domain concepts
supporting an intelligence analyst’s timeline tool. Both the tool
and the methodology are supported at several points by an
implemented temporal reasoning engine, in a way that we argue
ultimately advances machine reading technology by increasing
both sophistication and quality expectations about temporal
annotations and extraction.
Company Information
American Mfg Company is a quality manufacturer of replacement parts for the wide variety of mud pumps, centrifugal pumps, drilling rigs, and swivels found on the World market today.
American's manufacturing plant is located in beautiful St. Joseph, Minnesota in America's heartland. A highly trained staff uses state-of-the-art equipment and proven quality control methods to produce the finest pump replacement parts found in the market today.
Our pump parts are used in many different industries including the water well, oilfield, geothermal and horizontal directional drilling industries. Every part we make is manufactured to standards equal or exceeding those of the O.E.M.
Next generation analytics and cybersecurity solutions that takes a holistic approach to enabling, protecting, managing and supporting mission critical enterprise systems.
Presentation delivered by Bryan Ware, CTO at Haystax Technology at The Research Board Symposium on Information Risk Management in NYC. This presentation provides an overview of the importance of this approach. Contact the author for a more detailed explanation of the approach.
Haystax Technology Labs presentation of white-paper on advanced threat analytics at 9th International Semantic Technologies Intelligence for Defense and Security (STIDS)
Technopolis provides the best addresses for companies to operate and succeed in five countries in the Nordic-Baltic region. The company develops, owns and operates a chain of 21 smart business parks that combine services with flexible and modern office space. The company’s core value is to continuously exceed customer expectations by providing outstanding solutions to 1,700 companies and their 40,000 employees in Finland, Norway, Estonia, Russia and Lithuania. The Technopolis Plc share (TPS1V) is listed on NASDAQ OMX Helsinki.
This presentation by Morris Kleiner (University of Minnesota), was made during the discussion “Competition and Regulation in Professions and Occupations” held at the Working Party No. 2 on Competition and Regulation on 10 June 2024. More papers and presentations on the topic can be found out at oe.cd/crps.
This presentation was uploaded with the author’s consent.
This presentation, created by Syed Faiz ul Hassan, explores the profound influence of media on public perception and behavior. It delves into the evolution of media from oral traditions to modern digital and social media platforms. Key topics include the role of media in information propagation, socialization, crisis awareness, globalization, and education. The presentation also examines media influence through agenda setting, propaganda, and manipulative techniques used by advertisers and marketers. Furthermore, it highlights the impact of surveillance enabled by media technologies on personal behavior and preferences. Through this comprehensive overview, the presentation aims to shed light on how media shapes collective consciousness and public opinion.
Sharpen existing tools or get a new toolbox? Contemporary cluster initiatives...Orkestra
UIIN Conference, Madrid, 27-29 May 2024
James Wilson, Orkestra and Deusto Business School
Emily Wise, Lund University
Madeline Smith, The Glasgow School of Art
Acorn Recovery: Restore IT infra within minutesIP ServerOne
Introducing Acorn Recovery as a Service, a simple, fast, and secure managed disaster recovery (DRaaS) by IP ServerOne. A DR solution that helps restore your IT infra within minutes.
Have you ever wondered how search works while visiting an e-commerce site, internal website, or searching through other types of online resources? Look no further than this informative session on the ways that taxonomies help end-users navigate the internet! Hear from taxonomists and other information professionals who have first-hand experience creating and working with taxonomies that aid in navigation, search, and discovery across a range of disciplines.
0x01 - Newton's Third Law: Static vs. Dynamic AbusersOWASP Beja
f you offer a service on the web, odds are that someone will abuse it. Be it an API, a SaaS, a PaaS, or even a static website, someone somewhere will try to figure out a way to use it to their own needs. In this talk we'll compare measures that are effective against static attackers and how to battle a dynamic attacker who adapts to your counter-measures.
About the Speaker
===============
Diogo Sousa, Engineering Manager @ Canonical
An opinionated individual with an interest in cryptography and its intersection with secure software development.
2. 2
1. Highlights for the Period – Kari Inkinen
2. Portfolio Development – Pia Arrhenius
3. Financials – Niklas Nylander
4. Business Environment and Business Update – Kari Inkinen
5. Q & A
4. Sponda has carried out majority of the
divestment plans set in its strategy
30.6.2013 30.9.2016 Divestments
Property Funds
business
AUM
EUR 720m
Investments in
Funds
EUR 73m
AUM
EUR 0m1)
Investments in
Funds
EUR 0m
• The Property Funds business
and the properties in the Fund
sold to Certeum
• Sponda’s shares in Certeum
sold at the end of 2015
Logistics
property portfolio
Fair value
EUR 409.5m
Fair value
EUR 80.2m
• Logistics properties sold for
EUR 325 million
Properties in
Turku
# of properties
8
# of properties
0
• All properties sold by July
2016.
Russian portfolio
Fair value
EUR 268.3m
Fair value
EUR 123.4m
• Properties in Russia sold for
EUR 59 million
1) Investments in two property funds reported as part of the Property Investment Companies segment 4
5. Q3 2016 in brief
• Continued solid performance in Q3
especially in Shopping Centre segment
- Like-for-like development in both shopping
centres and offices were positive, 4.7% and
0.6% respectively
• Occupancy rate increased to 89.3%
(30.9.2015: 86.2%)
- Shopping Centres 93.2% (30.9.2015: 90.6%)
- Office Properties 88.8% (30.9.2015: 88.0%)
• Forum selected as the best shopping
centre in Finland
• Divestments YTD were EUR 54 million
5
7. Cash earnings and dividend per share
0,37 0,37
0,40 0,40
0,37
0,36
0,31
0,15 0,16
0,17
0,18
0,19 0,19
0,00
0,05
0,10
0,15
0,20
0,25
0,30
0,35
0,40
0,45
2010 2011 2012 2013 2014 2015 Q3 2016
CEPS Dividend
7
(*
*) A dividend of EUR 0.06 per share was paid in August 2016, which will be part for the total
dividend to be paid for financial year 2016.
EUR
8. Location matters
Helsinki CBD shows strong development in occupancy rates and
like-for-like rental growth
8
Like-for-like net income, M€ 1-9/16 Change % 1-9/15
Offices 30.6 4.3% 29.3
Shopping Centres 10.5 9.4% 9.6
Economic occupancy rate, % 1-9/16 1-9/15
Offices 92 91
Shopping Centres 92 85
9. Economic occupancy rates
80
82
84
86
88
90
92
94
96
98
100
Q3 15 Q4 15 Q1 16 Q2 16 Q3 16
Office properties
Shopping centres
Helsinki CBD
Total property portfolio
9
%
88.8%
93.2%*
91.9%
89.3%
*) In Shopping Centre segment the Anttila bankruptcy impact in Q3 was 1.5%-points
88.8%
89.3%
91.9%
93.2%*
10. Like-for-like development in Q3 2016
Like-for-like net rental growth has been calculated from a portfolio that Sponda has held for 2 years excluding acquisitions,
divestments and property development.
In Offices the
improvement is a result of
increased rents and
indexation.
The positive development
in Shopping Centres
and Logistics is driven
by both improved
occupancy rates and
increased rents.
10
0,7 %
3,5 %
8,5 %
0,6 %
-0,1 %
0,6 %
-5,0 %
-2,6 %
0,6 %
4,7 %
12,1 %
0,1 %
-6,0 %
-4,0 %
-2,0 %
0,0 %
2,0 %
4,0 %
6,0 %
8,0 %
10,0 %
12,0 %
14,0 %
Offices Shopping Centres Logistics Russia
Like-for-like net rental change, %
Change in turnover Change in maintenance expenses Net change
11. Sponda’s priorities in 2016
11
Occupancy rate
development
Our target is to increase the
occupancy rate from 87.7%
(31.12.2015) level.
Occupancy rate in
Q3 2016 was 89.3%
Implementing
our strategy
We will continue the non-core
property divestments and the core
property acquisitions.
We aim to maintain our ability to
pay stable dividend.
Focus in
property
development
Stable cash flow
from operations
per share
Our target is to start at least one
development project in 2016 and to
keep our property development gain of
15% on each project.
During Q1 we acquired
CBD properties for EUR
576 million. YTD we
have sold properties for
EUR 54 million.
Ratina shopping centre
in Tampere is
progressing. New office
and retail development
started in July 2016.
Dividend for 2015 was
EUR 0.19 (2014: EUR
0.19). EUR 0.06
dividend for 2016 paid
in August.
13. Share of Helsinki CBD’s office and shopping
centre properties has clearly increased
Sponda’s portfolio 30.6.20131) Sponda’s portfolio today
13%
4%
Logistics
Property development
CBD
17%
Ruoholahti
17%
Rest of HMA
8%Tampere,
Oulu and Turku
Russia
8%
34%
Property Development
3%Logistics
2%
48% CBD
2%
Oulu
Tampere
4%
7%
Russia
Ruoholahti
Rest of HMA
16%
17%
1) Excluding Property Funds
Offices and
Shopping Centres Offices and
Shopping Centres
13
EUR 3,692.7 millionEUR 3,266.5 million - Total portfolio -
14. Shopping centres
• The economic occupancy rate was 93.2%
- The Anttila bankruptcy impact in Q3 was 1.5%-points
• The Finnish Council of Shopping Centers reports growth numbers for
Finnish shopping centres in Q3
- Footfall in Finland 5.9% and in HMA 6.3%
- Sales improved by 6.0%, in HMA by 5.4%
• Sponda’s combined footfall of all shopping centres increased by 3.6%
compared to Q3 2015.
• Combined OCR of all shopping centres including Forum was 15.3%.
• Combined sales of all shopping centres including Forum increased by
1.8% compared to Q3 2015.
• Like-for-like rental growth was 4.7% as a result of improved occupancy
rates and increased rents.
14
15. Office properties
• Demand for CBD offices remains
strong.
- Q3 CBD office occupancy rate
was approximately 92% (Q2
2016: 92%).
• Rental levels in CBD offices have
remained strong.
• Office segment like-for-like rental
growth was 0.6% as a result of
increased rents and indexation.
15
16. Property development investments
For greenfield projects Sponda expects 15% development gain
16
Leasable
area, m²
Estimated
completion
Total investment,
€
Investment
by the end of
September 2016
Pre-let
%
Greenfield developments
Ratina shopping centre, Tampere 53,000 Spring 2018 240.0 87.0 40
Tikkurila office and retail building 9,500 Spring 2018 31.0 3.5 57
Total 62,500 271.0 90.5
We are continuously looking for investment opportunities
• Any possible decision to start a greenfield project will be disciplined and based on at least 15%
development gain.
17. Sponda continues to further improve
quality of portfolio
Focus on the two by population
fastest growing areas in Finland
– HMA and Tampere
Mature, non-core properties
with low future development
potential will be divested (both
offices and shopping centres)
Capital to be reinvested in
office and retail properties in
areas with growth potential
The sale of non-strategic
properties (Logistics and
Russia) will continue
17
19. Financial highlights
Key drivers during the period
• Acquisition of Forum shopping centre
• Improved economic occupancy rates
• Helsinki CBD shows strong development in occupancy rates and like-for-like
7-9/2016 7-9/2015 1-9/2016 1-9/2015 1-12/2015
Total revenue, M€ 66.3 56.7 193.2 173.3 230.5
Net operating income, M€ 51.5 42.2 143.8 124.4 165.7
EBITDA*, M€ 46.6 37.0 127.4 108.3 144.0
EPRA Earnings, M€ 31.0 27.4 84.9 78.7 232.0
NAV/share, € 5.05 4.71 5.26
EPRA NAV/share, € 5.38 5.58 5.60
CEPS, € 0.10 0.10 0.31 0.29 0.36
*) Net operating income – administrative and marketing expenses
19
20. Net operating income development Y-o-Y
Solid development driven by Forum acquisition
124,4
22,6
-6,6
3,3 143,8
100
105
110
115
120
125
130
135
140
145
150
155
160
MEUR
20
21. Valuation gains/losses
No changes in yield requirements in Q3 (internal valuation)
M€ 7-9/2016 7-9/2015 1-9/2016 1-9/2015 1-12/2015
Changes in yield requirements (Finland) 0.0 0.0 17.1 32.2 39.2
Changes in yield requirements (Russia) 0.0 0.0 (4.1) (7.4) (7.4)
Profit/loss from property development projects 1.5 6.7 5.4 9.7 25.4
Modernization investments (7.4) (6.8) (19.9) (27.5) (37.8)
Change in market rents and maintenance costs (Finland) (3.6) 1.9 10.0 20.4 30.2
Change in market rents and maintenance costs (Russia) (0.4) 1.0 (11.1) (14.3 (26.8)
Change in exchange rates (0.1) (2.4) (2.5) (0.2) 0.3
Investment properties, total (10.0) 0.5 (5.0) 12.9 23.2
Property Investment Companies 0.0 0.0 (2.0) 0.0 0.0
Realised share of profit from real estate funds 0.0 0.0 0.0 0.0 0.0
Group, total (10.0) 0.5 (7.0) 12.9 23.2
21
22. Investment property valuation
M€
-38,6
-5,0
-26,7
61,0
589,5
0,7
10,2
-100,0 0,0 100,0 200,0 300,0 400,0 500,0 600,0 700,0
Reclassifications to non-current assets held for sale
Change in fair value
Divestments
Investments
Acquisitions
Capitalised interest
Investment properties held for sale
22
Investment properties 1 Jan 2016 3,101.7
Investment properties 30 Sep 2016 3,692.7
25. Prospects and financial targets
Financial targets
Long-term equity ratio target is 40%.
Dividend policy is to pay approx. 50% of the operational cash earnings per share, taking into account of the
economic situation and company’s development needs. Starting from 2016, Sponda will pay dividend three times a
year.
25
0
50
100
150
200
2012 2013 2014 2015 2016e
0
20
40
60
80
100
120
2012 2013 2014 2015 2016e
Sponda provides prospects for 2016 with regard to the development of the company’s net
operating income and adjusted EPRA Earnings.
Net operating income, EUR 189–194 million Adjusted EPRA Earnings, EUR 111-116 million
30. Lease agreements in Q3 2016
Pcs M²
€/m²/month
(avg)*
New agreements that came into force during the period 64 8 154 16.30
Agreements that ended during the period 80 22 354 15.80
Agreements that were extended during the period 38 10 420 16.60
*) Agreements that came into force and ended do not necessarily correlate with same sector or space.
• All lease agreements in Finland are linked to CPI (upwards only).
• Ten largest tenants account for 28% of rental income.
30
31. Investment portfolio development
M€ 2012 2013 2014 2015 30.9.2016
Property development
investments
47.5 14.0 22.0 65.2 41.1
Maintenance investments/
Tenant improvements
28.4 22.6 42.0 37.8 19.9
Acquisitions 53.1 3.1 65.0 4.7 589.5
Divestments 61.8 33.1 237.2 157.6 53.6
• We are creating value by property development and active portfolio management.
• Our aim is to sell non-core assets classified as such either by location or
development potential.
31
34. Largest shareholders 31 October 2016
Major shareholders No. of shares Holding %
1. Mercator Invest Ab 95,344,608 28.07
Mercator Invest Ab
Oy Palsk Ab
53,180,863
42,163,745
15.66
12.41
2. HC Fastigheter Holding Oy Ab 34,181,172 10.06
3. Varma Mutual Pension Insurance Company 29,083,070 8.56
4. Elo Pension Company 4,893,083 1.44
5. Åbo Akademi University Foundation 4,096,430 1.21
6. The State Pension Fund 3,850,000 1.13
7. Odin Eiendom 1,528,633 0.45
8. Danske Invest Finnish Institutional Equity Fund 1,007,000 0.30
9. OP-Finland Small Firms Fund 895,812 0.26
10. OP-Finland Value Fund 813,221 0.24
Nominee-registered shareholders 36.12% of the total
34
35. Overview of the current reporting
segments
35
Office 2 151.0 M€ 6.0% 5.9%
Shopping
Centres
1 170.9 M€ 5.3% 4.7%
Logistics 80.2 M€ 9.2% 5.0%
Russia 123.4M€ 10.2% 7.8%
Property
Investment
Companies
20.5 M€
(Equity invested)
Notes: 1) Fair value of investment properties as at 30 September 2016.
2) Average valuation yield requirement as at 30 September 2016.
3) Net initial yield of the segment as at 30 September 2016.
4) Share of total fair value of properties as 30 September 2016.
% of portfolio4
2%
3%
32%
5%
58%
Fair value1 Valuation yield2 Net initial yield3
Property
Development
167.3M€ n/m n/m
37. Like-for-like development in Q3 2016
Like-for-like net rental growth has been calculated from a portfolio that Sponda has held for 2 years excluding acquisitions,
divestments and property development.
37
0,5
1,2
0,4
0,0
0,0
0,0
-0,1
0,0
0,5
1,3
0,3
0,0
-0,2
0,0
0,2
0,4
0,6
0,8
1,0
1,2
1,4
Offices Shopping Centres Logistics Russia
Like-for-like rental change, M€
Change in turnover Change in maintenance expenses Net change
38. Lease agreement composition Q3 2016
Average lease maturity
38
0 2 4 6
Total
Russia
Logistics
Shopping centres
Office
Q3 2016
Q3 2015
Yrs
Lease maturity profile, % of rental income
8,0
0,3
10,9
26,3
1,30,97,0
3,1
14,9
10,0
3,2
3,4
4,8
5,6 0,3
Tenant breakdown by sector, based on rental income
Professional, scientific and technical
Energy
Public sector
Wholesale/Retail
Education
Logistics/Transport
Hotel and catering business
Media/Publishing
Other services
Banking/Investment
Construction
Industry/Manufacturing
Healthcare
Telecommunications
Other
0
5
10
15
20
25
Q3 2015 Q3 2016
39. Profit & loss statement
M€ 7-9/2016 7-9/2015 1-9/2016 1-9/2015 1-12/2015
Total revenue 66.3 56.7 193.2 173.3 230.5
Expenses (14.8) (14.5) (49.5) (48.9) (64.8)
Net operating income 51.5 42.2 143.8 124.4 165.7
Profit on sale of inv. properties 0.9 0.0 0.9 (1.5) (4.5)
Valuation gain / loss (10.0) 0.5 (7.0) 12.9 23.2
Depreciation of goodwill (0.8) (2.6) (2.1) (2.6) (3.0)
Profit/loss on sales of associated companies (0.1) - (0.1) - 5.2
Profit on sale of trading properties 0.8 - 13.3 2.6 2.8
SGA expenses (4.9) (5.2) (16.4) (16.1) (21.7)
Share of profit from associated companies - 3.4 - 10.2 10.2
Other operating income/expenses (0.1) 0.0 0.4 0.3 0.2
Operating profit 37.2 38.3 132.8 130.3 178.1
Financial income and expenses (12.8) (13.0) (38.1) (36.8) (48.9)
Profit before taxes 24.4 25.3 94.7 93.4 129.2
Taxes from previous and current fin. years (0.1) (0.3) (2.5) (1.7) (9.3)
Deferred taxes (5.6) (7.1) (14.9) (22.5) 107.3
Profit for the period 18.8 18.0 77.2 69.2 227.2
39
40. Balance sheet
40
M€ 30.9.2016 30.9.2015 31.12.2015
ASSETS
Investment properties 3,692.7 3,161.4 3,101.7
Other non-current assets 62.3 78.7 61.4
Fixed assets & other non-current assets, total 3,755.0 3,240.1 3,163.1
Current assets, total 51.1 35.7 267.7
Non-current assets held for sale 38.6 185.1 10.2
Assets, total 3,844.8 3,461.0 3,441.0
SHAREHOLDERS’ EQUITY AND LIABILITIES
Shareholders’ equity, total 1,810.1 1,430.4 1,585.0
Non-current liabilities, total 1,531.2 1,645.6 1,192.0
Current liabilities, total 503.5 385.0 664.0
Shareholders’ equity and liabilities, total 3,844.8 3,461.0 3,441.0
42. EPRA NAV calculation
5.38€/share
*) Deferred tax relating to fair valuation of property and interest rate derivatives
42
1 200,0
1 300,0
1 400,0
1 500,0
1 600,0
1 700,0
1 800,0
1 900,0
Equity attributable to
equity holders of parent
company
Other equity reserve Fair value of financial
instruments
Deferred tax liabilities
from fair value
assessment of
investment properties
Goodwill relating to fair
value assessment of
properties
Total
1 808.6 -94.0
33.1
90.6 -9.5 1 828.8
*